


Unsolved
This post is more than 5 years old
2 Posts
0
2239
I want to select expansion in my reports on the basis of metrics(name).
Hi all,
Can any one could help me on how to expand selection on the basis of metrics (name) only. i.e. lets suppose I have all together 10000 interface entries but i just want to select expansion on the interface where my metric Availability is less than 100%. Purpose of this is that i want graphs of only interfaces where Availability was less than 100%.
Flo_csI
166 Posts
1
January 31st, 2017 01:00
Hi,
The easiest way is to have a table which list your interfaces (usual expansion on part) with their availability.
In Value Setting of the Availability cell put a threshold & select Value Display > Display Minor Severity and Above.
A report template with an example is available here : Interfaces with outage Template.xml
Rgds.
mirubaig
2 Posts
0
February 1st, 2017 08:00
Hi bauagonzo,
I know thats its a template. Thanks for your sharing. I have this with me. but the problem i face is i have want report which shows all high utilized interfaces it serves me by showing all the links above my threshold level in tabular form but as far as graphs is concern i found only this option that i plot graphs one by pone bu using the interactive table.
What i want is that i want to see the graphs of all the interfaces in single window or each graph for each interface. I hope it will help to answer.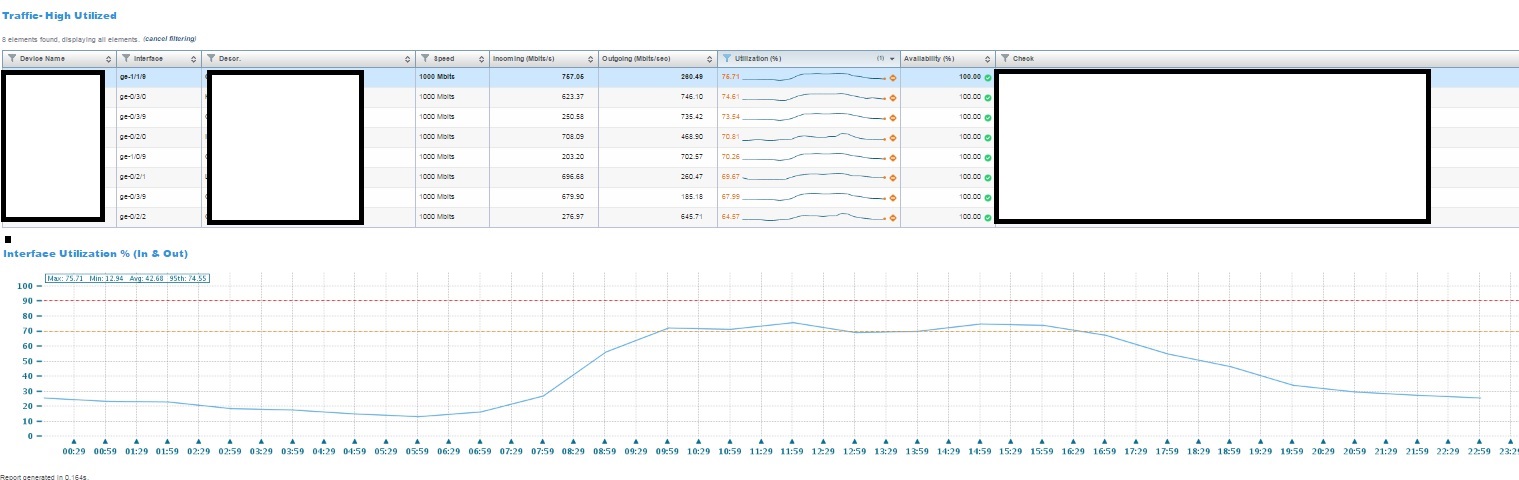
Flo_csI
166 Posts
0
February 3rd, 2017 02:00
Hi,
We can put all Interfaces charts in a single windows but we can not the charts to be displayed based on a threshold.
Sorry.
isakats
141 Posts
0
February 3rd, 2017 05:00
Hi mirubaig,
You could try filtering on the availability column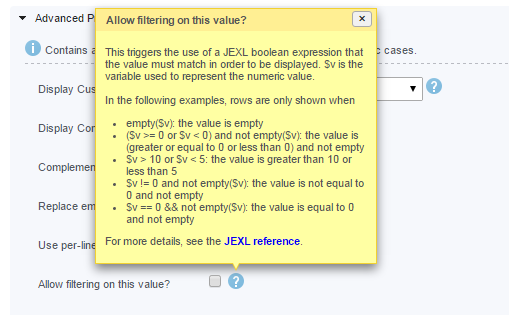
hth