This post is more than 5 years old
3 Posts
0
155452
Storage Latency
Hi Team,
I am currently in the process of investigating whether there are any storage performance issues in our current VMware environment. What I would like is a simple report showing a graphical representation of storage latency over a 24/48 hour period.
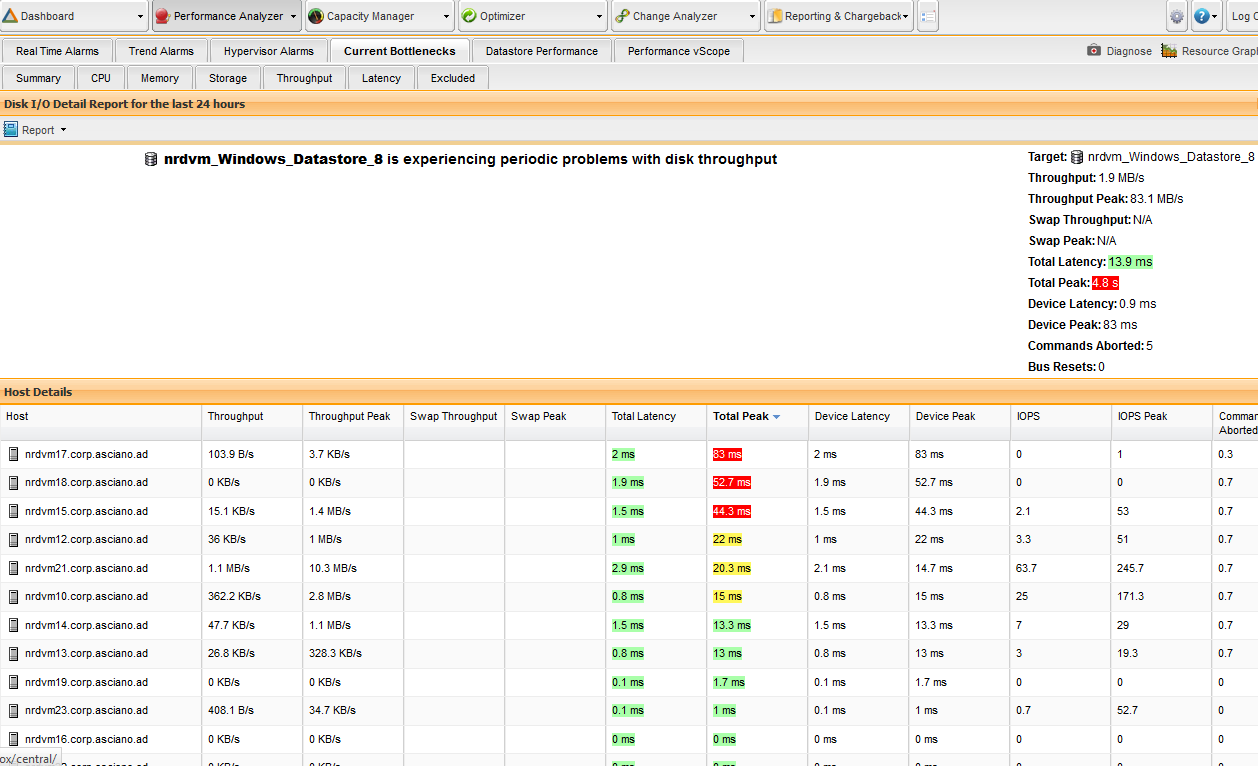
The home screen dashboard shows "75 Datastores have been experiencing high-latency issues over the past 24 hours". This is common at each logon and can increase to over 200 datastores with issues. Looking at the Performance/ Current Bottlenecks/ Latency tabs it shows total peak for many datastores at about 800ms. This looks to be a major storage performance latency problem in our environment. However, looking at the Performance/ Datastore Performance tab the average and peak latency is way below this value.
Is there something I am missing?

DELL-Kevin Fl
22 Posts
0
September 17th, 2013 17:00
Hi Fadi,
Looking at the screenshots you sent - Datastore Performance averages your individual datastore/host performance metrics. So, by using Datastore Performance, you're getting the full picture of what's going on with that datastore. Considering some of the individual performances in the Current Bottlenecks tab, you may/may not want to look in to storage vMotioning any of the heavy hitting VM's.
DELL-Kevin Fl
22 Posts
0
September 10th, 2013 17:00
Hi Fadi,
Looking at the screenshots you sent, the Current Bottlenecks one doesn't show all the columns, nor the navigation tree - so I'll make my best guess as to what's going on here...
the first one is from Current Bottlenecks - Latency. This takes into account the hosts that are also attached to that datastore. There are multiple ESX(i) hosts attached to your datastores. So there will be different levels of performance at that level - device and kernel latencies are also taken into account.
Latency peaks can occur when there are actions going on in the background, such as backups or a heavy load of SQL transactions being processed.
In Datastore Performance, it's showing the average and total latency of the datastores only. Datastore Performance would be the best report to use. Average Latency is the column to focus on. In your second screenshot, you do have some datastores approaching 30 ms - what we'd consider to be in the warning zone. If the average datastore latency continues to creep up, it may be time to storage vMotion some virtual machines around.
Hope this helps,
Kevin
fadi1
3 Posts
0
September 10th, 2013 22:00
Hi Kevin,
Thanks for your reply. The navigation tree is set to the "Hosts and Clusters" root folder. I do understand there are multiple hosts attached to the datastores and device and kernel latencies. However, what I am unsure about is why the Current bottlenecks for Latency shows such high values and a "red alert" for storage whilst the Datastore Performance tab does not reflect any such serious issue. It seems from the Current bottlenecks/latency tab we need to take immediate action and when looking at the Datastore Performance tab it is more of a long-term warning.
Hope this makes it clearer.
Regards,
Fadi
DELL-Kevin Fl
22 Posts
0
September 11th, 2013 12:00
Hi Fadi,
With the Current Bottlenecks, it's looking at the Peak Latency - it's more of an alerting mechanism to make you aware that you are experiencing some high latency peaks, but you're total latency looks good. Double click one of the datastores and see if there's any further info offered.
fadi1
3 Posts
0
September 14th, 2013 03:00
Hi Kevin,
The high latency peaks seem very high. I have taken another set of screenshots as an example and also drilled down into the datastore experiencing the highest peak latency. From this screen it looks to me like we have a big problem but it makes it confusing as the datastore performance screen shows a different set of results.