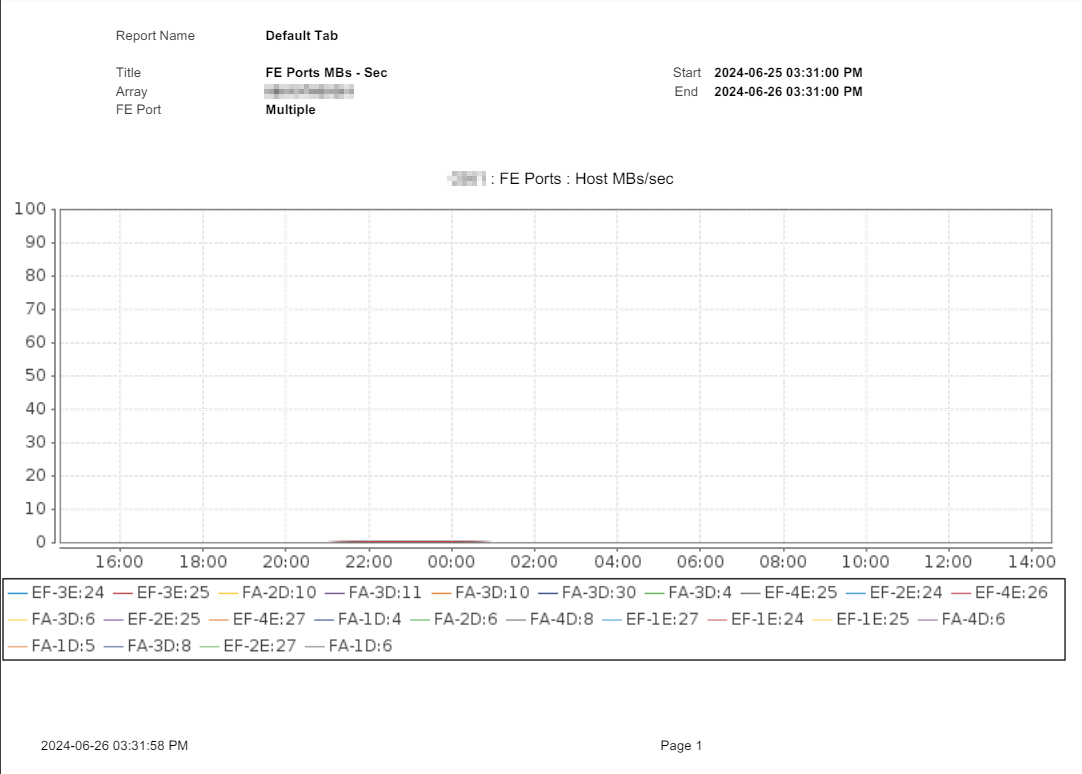
Unisphere for PowerMax: PDF Chart Report only Shows Data in Tabular format-No Graph is Present
Summary: Unisphere for PowerMax PDF Chart Report for FE Ports % Busy is only showing data in tabular format. There is no graph present.
Symptoms
Unisphere for PowerMax v9.2.3.11
The graph is present in Unisphere when running a Chart Report for FE Port Metrics (for example Host MBs/sec).
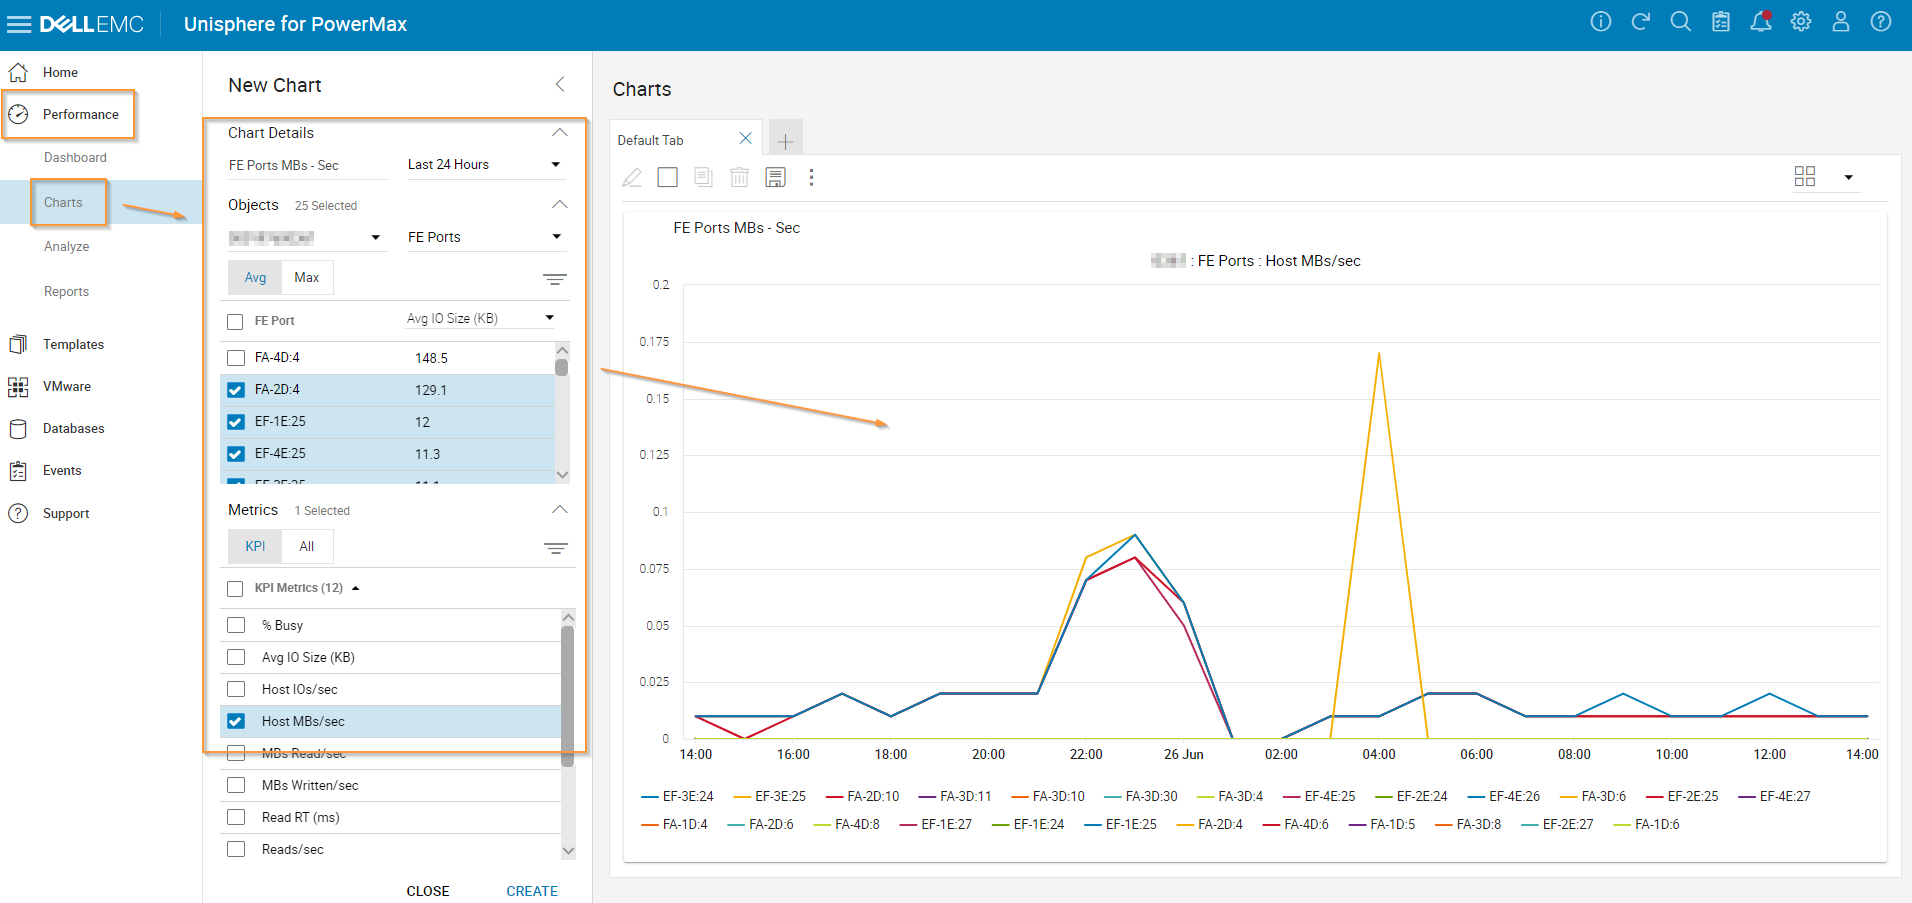
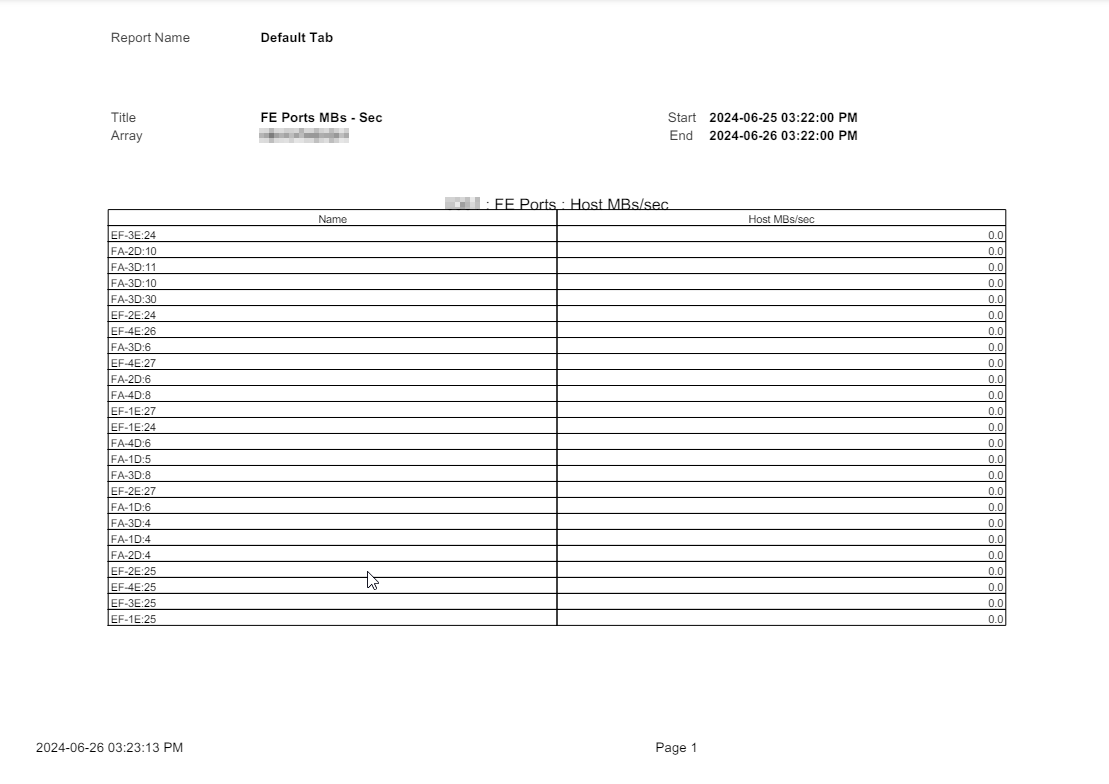
However, when the PDF Chart Report is generated, it shows data in tabular format with no graph present.
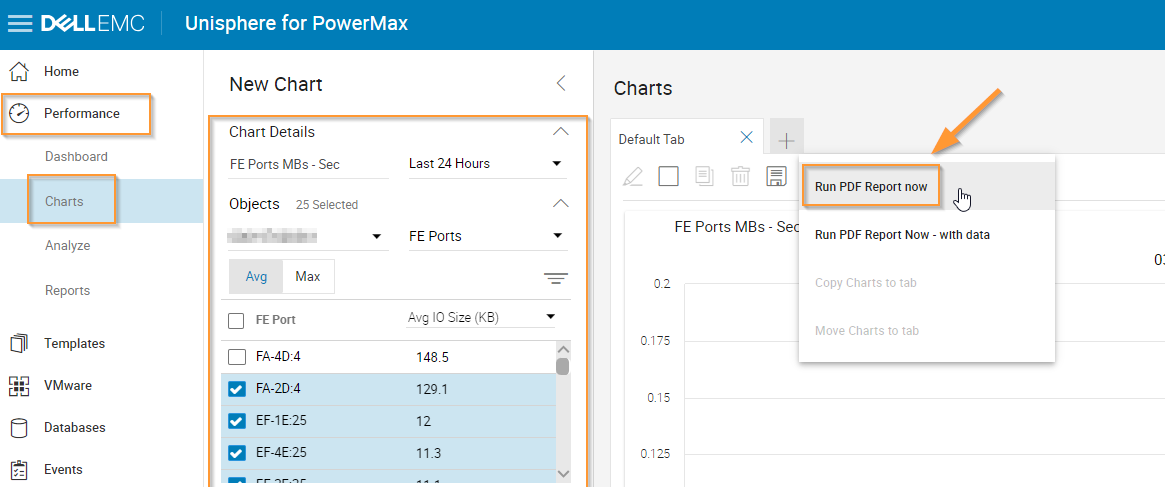
See the PDF Report example below:
Cause
This is expected behavior.
For every chart PDF report in Unisphere, if a chart report is required for a PDF export, the maximum number of metric objects that can be selected is 24, whether that be Port Groups, Storage Groups, Masking Views, and so on.
If the number of metric objects selected is greater than 24, then no chart is displayed in the PDF report, just tabular data.
Resolution
Select 24 or fewer metric objects for the chart report:
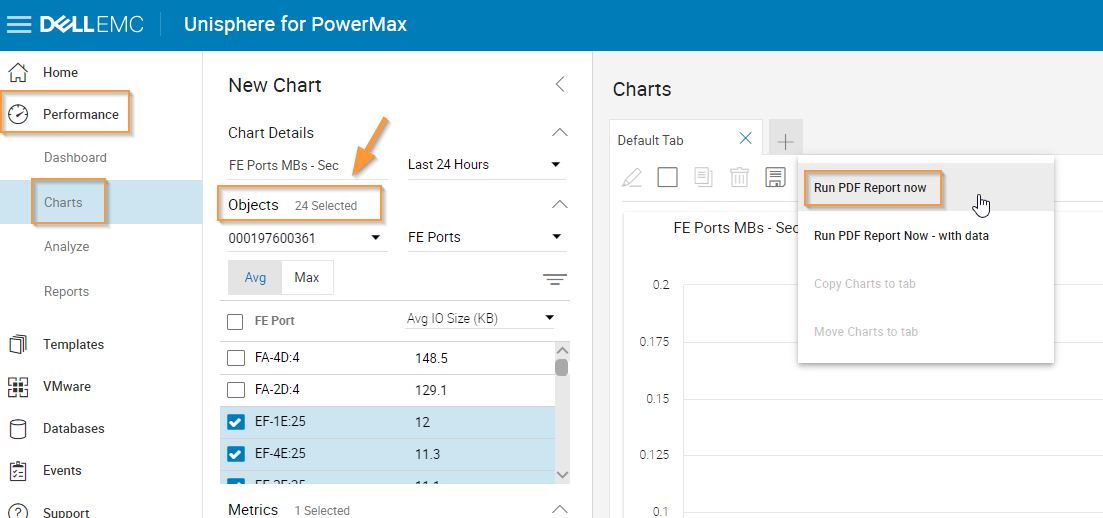
See the example report below: