VSS Tracing and Troubleshooting Options
Summary: This article describes how it is possible to implement a few tracing options for Microsoft Volume Shadow Copy Service VSS. Sometimes it is necessary to collect debug information at the VSS layer for troubleshooting issues involving snapshots creation. ...
Instructions
VSS technology is a fundamental component in several data protection solutions and facilitates the backup capabilities of Microsoft Windows systems. Nevertheless, many elements can make a VSS snapshot failing and it might be useful to extend the troubleshooting at the VSS component and its modules.
This article is based on the VSSTrace.exe binary tool which offers several options for tracing the VSS service at the time the snapshot is attempted and might provide meaningful information for troubleshooting purpose.VSSTrace.exe is included with the Microsoft Windows Software Development Kit (SDK) which can be downloaded from Microsoft Download Center: Windows SDK downloads - Windows apps | Microsoft Learn
For more information about VSSTrace.exe, see: Using Tracing Tools with VSS - Win32 apps | Microsoft Learn
Once Windows SDK is installed, vsstrace.exe can be found in the following location.
C:\Program Files (x86)\Windows Kits\10\bin\10.0.26100.0\x64\vsstrace.exe
The following command syntax is used to redirect the VSSTrace output to a file:vsstrace -o c:\Temp\VSSTrace\myTrace1.txt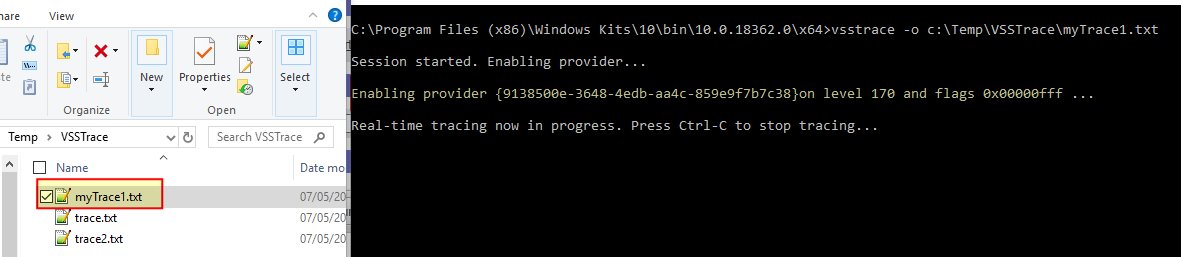
At the time the VSS snapshots are attempted, the traced VSS modules are written to the log file so that further analysis can be made.
VSS Module Considerations:
Selective tracing for VSS modules that are believed relevant for further troubleshooting can help to reduce the size of collected data and trace file. VSSTrace allows tracing of specific and named modules, for example: the VSS service is itself known as the coordinator, the requester, the VSS writers, so forth. If there is the doubt that an error is generated by the requester or by writers, restrict the trace to a specific module or modules.
Every module has a mask which can be used as a flag in the statement for VSSTrace. The following statement, for example, will disable tracing for all the modules (-f 0) and enables the trace for VSS Writers:vsstrace -f 0 +WRITER -o C:\Temp\VSSTrace\myTraceWriters.txt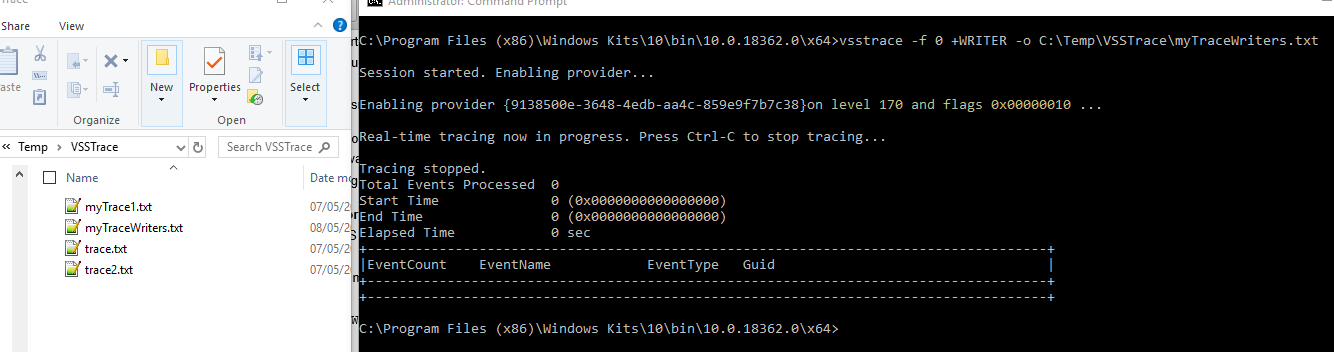
When the trace starts, the mask 0x00000010 is reported and corresponds to the Writer module flag.
It is then possible to append all the modules following the syntax: -f 0 +<MODULE> +<MODULE> +<MODULE> ...
A list of available modules can be obtained by using the following command:
vsstrace -help modules

Available modules:
    Module  :  Flag        : Default :  Description

------------:--------------:---------:----------------------------------------------
    EXCEPT  :  0x00000001  :   ON    :  C++ exception handling
     COORD  :  0x00000002  :   ON    :  VSS Coordinator service
     SWPRV  :  0x00000004  :   ON    :  System Provider service
    BUCOMP  :  0x00000008  :   ON    :  Requester and backup metadata processing
    WRITER  :  0x00000010  :   ON    :  Writer infrastructure and VSS hosted writers
    VSSAPI  :  0x00000020  :   ON    :  Miscellaneous VSSAPI exported routines
    HWDIAG  :  0x00000040  :   ON    :  Hardware Provider diagnostics
     ADMIN  :  0x00000080  :   ON    :  Command line utilities
     VSSUI  :  0x00000100  :   ON    :  Shadow Copies for Shared Folders UI
      TEST  :  0x00000200  :   ON    :  Internal test infrastructure (unused)
     IOCTL  :  0x00000400  :   ON    :  IOCTL and FSCTL operations
       GEN  :  0x00000800  :   ON    :  General purpose utilities (noisy)
     WRXML  :  0x00001000  :   OFF   :  Writer metadata processing (noisy)
    VSSXML  :  0x00002000  :   OFF   :  Metadata processing base classes (noisy)
   FSSPROV  :  0x00004000  :   OFF   :  File Server Shadow Copy Provider
  FSSAGENT  :  0x00008000  :   OFF   :  File Server Shadow Copy Agent
     FSSMD  :  0x00010000  :   OFF   :  File Server Shadow Copy Metadata
Level Considerations:
There are 21 different levels with the default set at 170 which means that up to modules function return values are logged. Level 255 is the maximum but a lot of data is included into the trace file if this level is selected.
The following example enables tracing level 190: Function Parameters Verbose for the VSS service only:
vsstrace -f 0 +COORD -l 190 -o C:\Temp\VSSTrace\myTraceVSSService190.txt

C:\Program Files (x86)\Windows Kits\10\bin\10.0.18362.0\x64>vsstrace -f 0 +COORD -l 190 -o C:\Temp\VSSTrace\myTraceVSSService190.txt

Session started. Enabling provider...

Enabling provider {9138500e-3648-4edb-aa4c-859e9f7b7c38}on level 190 and flags 0x00000002 ...

Real-time tracing now in progress. Press Ctrl-C to stop tracing...

Tracing stopped.
Total Events Processed  0
Start Time              0 (0x0000000000000000)
End Time                0 (0x0000000000000000)
Elapsed Time            0 sec
+-------------------------------------------------------------------------------------+
|EventCount    EventName            EventType   Guid                                  |
+-------------------------------------------------------------------------------------+
+-------------------------------------------------------------------------------------+
190 is then reported as the current tracing level for module whose mask is 0x00000002 corresponding to the VSS coordinator.
The description for the available levels is here below for reference:
Available levels:
       000  :  None
       020  :  Fatal Errors
       030  :  Unhandled Exception
       040  :  Error
       050  :  Assertion
       060  :  Warning
       080  :  Exception Handling
       100  :  Event Log Activity
       120  :  General Information
       140  :  Code flow
       160  :  Function enter/exit
       170  :  Function return values (Default level)
       180  :  Function Parameters
       190  :  Function Parameters Verbose
       200  :  Verbose Info Level 1
       210  :  Verbose Info Level 2
       220  :  Verbose Info Level 3
       230  :  Fast Code Level 1
       240  :  Fast Code Level 2
       250  :  Fast Code Level 3
       255  :  All
Manual Snapshot Troubleshooting:
The best way would be to replicate the use case that triggers the error situation but, as this might not be always possible, the simplest approach to check the VSS service functionality and to test whether the VSSTrace binary has been correctly set up with the wanted parameters is to generate a restore point on demand.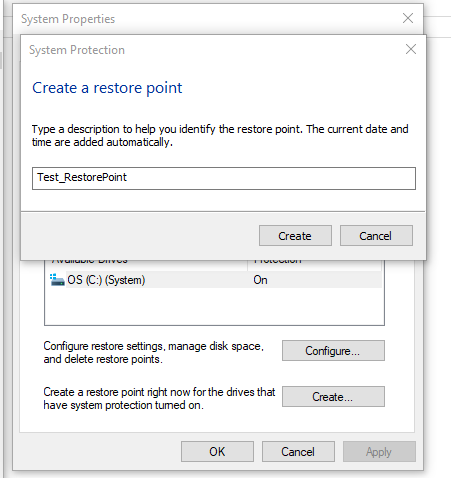
Here a restore point is created on demand which in turn results in a shadows copy creation:
C:\Program Files (x86)\Windows Kits\10\bin\10.0.18362.0\x64>vssadmin list shadows

Contents of shadow copy set ID: {41167b4f-2da1-47cf-a9d6-235adf1e29df}
   Contained 1 shadow copies at creation time: 08/05/2019 18:12:12
      Shadow Copy ID: {09144331-79a6-4f34-9994-7ea22a72fbbd}
         Original Volume: (C:)\\?\Volume{49ec4df8-2a9b-4f9a-8fa8-c9fe8e10943b}\
         Shadow Copy Volume: \\?\GLOBALROOT\Device\HarddiskVolumeShadowCopy9
         Originating Machine: XXXXXXXXXXXXXX.corp.emc.com
         Service Machine: XXXXXXXXXXXXXX.corp.emc.com
         Provider: 'Microsoft Software Shadow Copy provider 1.0'
         Type: ClientAccessibleWriters
         Attributes: Persistent, Client-accessible, No auto release, Differential, Auto recovered
vssadmin returns the list of the current available shadows and by creation date and time, the manual created restore points are identified.
Now, enabling the VSSTrace and generating a restore point start a VSS trace that might already include some interesting data for further troubleshooting.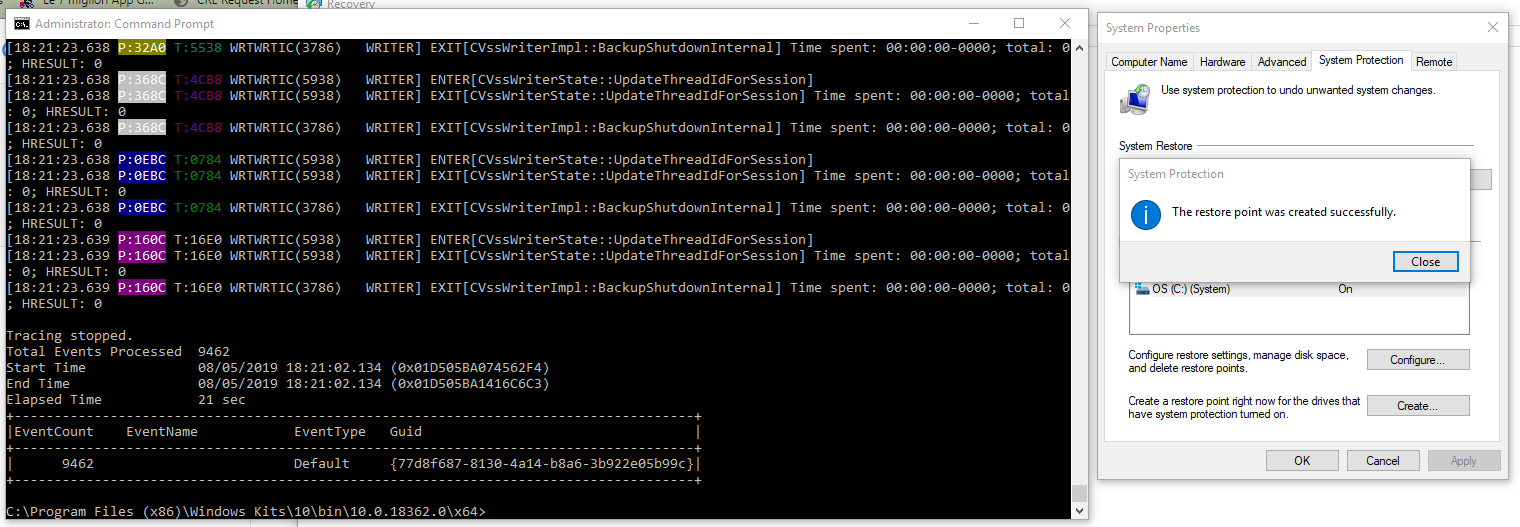
In the above figure, a restore point was created while the VSSTrace was enabled for WRITER module only:vsstrace -f 0 +WRITER -o C:\Temp\VSSTrace\myTraceWriters.txt
When the restore point was created and the VSS service invoked, the relevant WRITER module activities were collected and traced as expected.
Keeping manually created restore points makes no sense so after the trace is collected, it is necessary to remove them.vssadmin allows to selective removal of shadow copies by their IDs:
Use the following command to list VSS snapshots:
vssadmin list shadows
Delete the snapshots:
vssadmin delete shadows /shadow=SNAPSHOT_GUID
Use Event Viewer to get Error Codes and Messages.
In the host where VSS issues are happening the event viewer can be run by: eventvwr.msc /s
Limit the search within Windows Logs --> Application and Windows Logs --> System.
Filter by: VSS and VolSnap
VSS-related messages are eventually displayed there.