ECS: OBS: xDoctor: RAP025: One or more network interfaces are down or missing
Summary: xDoctor reports a warning error indicating that one of the ECS interfaces is down to the switches.
Symptoms
Beginning with ECS xDoctor v4.8‑109.0 and ObjectScale xDoctor v5.1‑109.0, RAP025 (One or more network interfaces are down or missing) is implemented as an auto‑healer. When switch connectivity issues exceed the configured Error or Critical severity threshold, xDoctor raises a RAP025 alert and automatically initiates its integrated repair orchestration workflow. This workflow performs the required remediation actions, if xDoctor auto‑healers are enabled.
Note: If your environment is running an xDoctor version earlier than ECS xDoctor v4.8‑109.0 or ObjectScale xDoctor v5.1‑109.0, the RAP025 auto‑healer functionality is not available. In these versions, remediation must be performed using the AutoPilot process described below or by following the manual remediation steps outlined in the Resolution section.
Alert That Triggers RAP025 Auto‑Healing
The RAP025 auto‑healing workflow is triggered when node interface failure is detected crossing the configured Error or Critical severity threshold. Once this threshold is exceeded, xDoctor generates a RAP025 alert, which serves as the trigger for the automated repair process.
Alert Output Example
Note: In xDoctor versions prior to ECS xDoctor v4.8‑109.0 and ObjectScale xDoctor v5.1‑109.0, this condition results in an alert only. Automatic remediation is not performed.
----------------------------------------------
INFO - Auto Healer for interface_down disabled
----------------------------------------------
Extra     = Auto Healer for interface_down disabled
Timestamp = 2026-03-24_205634
PSNT      = CKM00190800120 @ 4.8-109.0

-------------------------------------------------------------------------------------
ERROR - (Cached) One or more network interfaces are down or missing
-------------------------------------------------------------------------------------
Node      = Nodes
Extra     = {"Nodes": {"169.254.1.4": ["pslave-1"]}}
RAP       = RAP025
Solution  = KB 503814
Timestamp = 2026-04-01_190513
PSNT      = CKMXXXXXXXXXXX @ 4.8-109.0
Auto Healer Remediation (Example)
When auto‑healers are enabled, xDoctor automatically initiates remediation for detected node interface failure by applying common corrective actions outlined in this knowledge base.
----------------------------------------
FIXED - Auto Healer fixed interface_down
----------------------------------------
Node      = Nodes
Extra     = {"Nodes": {"169.254.1.1": ["pslave-0"]}}
Timestamp = 2026-04-01_190513
PSNT      = CKMXXXXXXXXXXX @ 4.8-109.0
Auto Healer Requirement
The xDoctor auto‑healer feature must be enabled for this remediation to occur. Auto‑healers can be enabled either during installation or post‑installation by following the steps outlined in:
KB: ECS: xDoctor: How to Enable xDoctor Auto Healer after tool installation
Manual Validation:
- Check interface link status on the cluster. In the below example, node 4 has NO-CARRIER which means no connection to the secondary-0 interface.
# viprexec -i 'ip link show | egrep "slave-|public"'
admin@node1:~> viprexec -i 'ip link show | egrep "slave-|public"'

Output from host : 1xx.1xx.219.1
bash: public: command not found
3: slave-0: <BROADCAST,MULTICAST,SLAVE,UP,LOWER_UP> mtu 1500 qdisc mq master public state UP mode DEFAULT group default qlen 1000
5: slave-1: <BROADCAST,MULTICAST,SLAVE,UP,LOWER_UP> mtu 1500 qdisc mq master public state UP mode DEFAULT group default qlen 1000
10: public: <BROADCAST,MULTICAST,MASTER,UP,LOWER_UP> mtu 1500 qdisc noqueue state UP mode DEFAULT group default

Output from host : 1xx.1xx.219.2
bash: public: command not found
3: slave-0: <BROADCAST,MULTICAST,SLAVE,UP,LOWER_UP> mtu 1500 qdisc mq master public state UP mode DEFAULT group default qlen 1000
5: slave-1: <BROADCAST,MULTICAST,SLAVE,UP,LOWER_UP> mtu 1500 qdisc mq master public state UP mode DEFAULT group default qlen 1000
10: public: <BROADCAST,MULTICAST,MASTER,UP,LOWER_UP> mtu 1500 qdisc noqueue state UP mode DEFAULT group default

Output from host : 1xx.1xx8.219.3
bash: public: command not found
4: slave-0: <BROADCAST,MULTICAST,SLAVE,UP,LOWER_UP> mtu 1500 qdisc mq master public state UP mode DEFAULT group default qlen 1000
5: slave-1: <BROADCAST,MULTICAST,SLAVE,UP,LOWER_UP> mtu 1500 qdisc mq master public state UP mode DEFAULT group default qlen 1000
10: public: <BROADCAST,MULTICAST,MASTER,UP,LOWER_UP> mtu 1500 qdisc noqueue state UP mode DEFAULT group default

Output from host : 1xx.1xx.219.4
bash: public: command not found
2: slave-0: <NO-CARRIER,BROADCAST,MULTICAST,SLAVE,UP> mtu 1500 qdisc mq master public state DOWN mode DEFAULT group default qlen 1000
5: slave-1: <BROADCAST,MULTICAST,SLAVE,UP,LOWER_UP> mtu 1500 qdisc mq master public state UP mode DEFAULT group default qlen 1000
10: public: <BROADCAST,MULTICAST,MASTER,UP,LOWER_UP> mtu 1500 qdisc noqueue state UP mode DEFAULT group default
- Confirm that there is a detected link by the individual interfaces:
# viprexec -i "echo slave-0;sudo ethtool slave-0 | grep 'Link detected:';echo slave-1;sudo ethtool slave-1 | grep 'Link detected:'"
admin@node1:~> viprexec -i "echo slave-0;sudo ethtool slave-0 | grep 'Link detected:';echo slave-1;sudo ethtool slave-1 | grep 'Link detected:'" Output from host : 1xx.1xx.219.1 slave-0 Link detected: yes slave-1 Link detected: yes Output from host : 1xx.1xx.219.2 slave-0 Link detected: yes slave-1 Link detected: yes Output from host : 1xx.1xx.219.3 slave-0 Link detected: yes slave-1 Link detected: yes Output from host : 1xx.1xx.219.4 slave-0 Link detected: no slave-1 Link detected: yes
- Confirm if the switches are Arista on Gen 1 or Gen 2, and Dell (or other model) on Gen 3 environments.
# viprexec -i "sudo lldpcli show neigh | grep SysDescr"
Gen 1 or Gen 2
admin@ecssh121:~> viprexec -i "sudo lldpcli show neigh | grep SysDescr"

Output from host : 1xx.1xx.219.1
    SysDescr:     Arista Networks EOS version 4.11.7.2 running on an Arista Networks DCS-7150S-24
    SysDescr:     Arista Networks EOS version 4.11.7.2 running on an Arista Networks DCS-7150S-24
    SysDescr:     Arista Networks EOS version 4.15.6M running on an Arista Networks DCS-7048T-A

Output from host : 1xx.1xx.219.2
    SysDescr:     Arista Networks EOS version 4.11.7.2 running on an Arista Networks DCS-7150S-24
    SysDescr:     Arista Networks EOS version 4.11.7.2 running on an Arista Networks DCS-7150S-24
    SysDescr:     Arista Networks EOS version 4.15.6M running on an Arista Networks DCS-7048T-A

Output from host : 1xx.1xx.219.3
    SysDescr:     Arista Networks EOS version 4.11.7.2 running on an Arista Networks DCS-7150S-24
    SysDescr:     Arista Networks EOS version 4.11.7.2 running on an Arista Networks DCS-7150S-24
    SysDescr:     Arista Networks EOS version 4.15.6M running on an Arista Networks DCS-7048T-A

Output from host : 1xx.1xx.219.4
    SysDescr:     Arista Networks EOS version 4.11.7.2 running on an Arista Networks DCS-7150S-24
    SysDescr:     Arista Networks EOS version 4.11.7.2 running on an Arista Networks DCS-7150S-24
    SysDescr:     Arista Networks EOS version 4.15.6M running on an Arista Networks DCS-7048T-A
Gen 3
admin@ecsnode1:~> viprexec -i "sudo lldpcli show neigh | grep SysDescr"

Output from host : 1xx.1xx.219.1
    SysDescr:     OS10
    SysDescr:     OS10
    SysDescr:     OS10
    SysDescr:     OS10

Output from host : 1xx.1xx.219.2
    SysDescr:     OS10
    SysDescr:     OS10
    SysDescr:     OS10
    SysDescr:     OS10

Output from host : 1xx.1xx.219.3
    SysDescr:     OS10
    SysDescr:     OS10
    SysDescr:     OS10
    SysDescr:     OS10

Output from host : 1xx.1xx.219.4
    SysDescr:     OS10
    SysDescr:     OS10
    SysDescr:     OS10
    SysDescr:     OS10

Output from host : 1xx.1xx.219.5
    SysDescr:     OS10
    SysDescr:     OS10
    SysDescr:     OS10
    SysDescr:     OS10

Output from host : 1xx.1xx.219.6
    SysDescr:     OS10
    SysDescr:     OS10
    SysDescr:     OS10
    SysDescr:     OS10

Output from host : 1xx.1xx.219.7
    SysDescr:     OS10
    SysDescr:     OS10
    SysDescr:     OS10
    SysDescr:     OS10

Output from host : 11xx.1xx.219.8
    SysDescr:     OS10
    SysDescr:     OS10
    SysDescr:     OS10
    SysDescr:     OS10
- Check public interface configuration for bonding secondary-0 and secondary-1 for public on the node showing no link that is detected from the command in step 2:
# sudo cat /etc/sysconfig/network/ifcfg-public
admin@node4:~> sudo cat /etc/sysconfig/network/ifcfg-public
BONDING_MASTER=yes
BONDING_MODULE_OPTS="miimon=100 mode=4 xmit_hash_policy=layer3+4"
BONDING_SLAVE0=slave-0
BONDING_SLAVE1=slave-1
BOOTPROTO=static
IPADDR=xxx.xxx.xxx.xxx/xx
MTU=1500
STARTMODE=auto
- Confirm the correct Link aggregation Control Protocol (LACP) parameter is set on the nodes. (IEEE 802.3ad Dynamic link aggregation is the default setting and is expected.)
Command:
# viprexec -i "grep Mode /proc/net/bonding/public"
Example:
admin@node1:~> viprexec -i "grep Mode /proc/net/bonding/public"

Output from host : 1xx.1xx.219.1
Bonding Mode: IEEE 802.3ad Dynamic link aggregation

Output from host : 1xx.1xx.219.2
Bonding Mode: IEEE 802.3ad Dynamic link aggregation

Output from host : 1xx.1xx.219.3
Bonding Mode: IEEE 802.3ad Dynamic link aggregation

Output from host : 1xx.1xx.219.4
Bonding Mode: IEEE 802.3ad Dynamic link aggregation
- Confirm that the connections are consistent to the ports and the interfaces are connected by running the following:
Ethernet10 = node 2
Ethernet11 = node 3
Ethernet12 = node 4
Ethernet13 = node 5
Ethernet14 = node 6
Ethernet15 = node 7
Ethernet16 = node 8
# viprexec -i "sudo lldpcli show neigh | egrep 'SysName|PortID'"
admin@ecssh121:~> viprexec -i "sudo lldpcli show neigh | egrep 'SysName|PortID'"
Output from host : 1xx.1xx.219.1
    SysName:      rabbit
    PortID:       ifname Ethernet9
    SysName:      hare
    PortID:       ifname Ethernet9
    SysName:      turtle
    PortID:       ifname Ethernet1

Output from host : 1xx.1xx.219.2
    SysName:      rabbit
    PortID:       ifname Ethernet10
    SysName:      hare
    PortID:       ifname Ethernet10
    SysName:      turtle
    PortID:       ifname Ethernet2

Output from host : 1xx.1xx.219.3
    SysName:      hare
    PortID:       ifname Ethernet11
    SysName:      rabbit
    PortID:       ifname Ethernet11
    SysName:      turtle
    PortID:       ifname Ethernet3

Output from host : 1xx.1xx.219.4
    SysName:      hare
    PortID:       ifname Ethernet12
    SysName:      turtle
    PortID:       ifname Ethernet4
Gen 3 ECS mappings for the nodes are as follows to the corresponding switch ports:
ethernet1/1/2 = node 2
ethernet1/1/3 = node 3
ethernet1/1/4 = node 4
ethernet1/1/5 = node 5
ethernet1/1/6 = node 6
ethernet1/1/7 = node 7
ethernet1/1/8 = node 8
- Confirm that the connections are up for the ECS connecting to the four ECS Gen 3 switches frontend rabbit and hare backend fox and hound.
# viprexec -i "sudo lldpcli show neigh | egrep 'SysName|PortID'"
admin@ecsnode1:~> viprexec -i "sudo lldpcli show neigh | egrep 'SysName|PortID'"

Output from host : 1xx.1xx.219.1
    SysName:      rabbit
    PortID:       ifname ethernet1/1/1
    SysName:      hare
    PortID:       ifname ethernet1/1/1
    SysName:      fox
    PortID:       ifname ethernet1/1/1
    SysName:      hound
    PortID:       ifname ethernet1/1/1

Output from host : 192.168.219.2
    SysName:      rabbit
    PortID:       ifname ethernet1/1/2
    SysName:      hare
    PortID:       ifname ethernet1/1/2
    SysName:      fox
    PortID:       ifname ethernet1/1/2
    SysName:      hound
    PortID:       ifname ethernet1/1/2

Output from host : 1xx.1xx.219.3
    SysName:      rabbit
    PortID:       ifname ethernet1/1/3
    SysName:      hare
    PortID:       ifname ethernet1/1/3
    SysName:      fox
    PortID:       ifname ethernet1/1/3
    SysName:      hound
    PortID:       ifname ethernet1/1/3

Output from host : 1xx.1xx.219.4
    SysName:      rabbit
    PortID:       ifname ethernet1/1/4
    SysName:      hare
    PortID:       ifname ethernet1/1/4
    SysName:      fox
    PortID:       ifname ethernet1/1/4
    SysName:      hound
    PortID:       ifname ethernet1/1/4

Output from host : 1xx.1xx.219.5
    SysName:      rabbit
    PortID:       ifname ethernet1/1/5
    SysName:      hare
    PortID:       ifname ethernet1/1/5
    SysName:      fox
    PortID:       ifname ethernet1/1/5
    SysName:      hound
    PortID:       ifname ethernet1/1/5

Output from host : 1xx.1xx.219.6
    SysName:      rabbit
    PortID:       ifname ethernet1/1/6
    SysName:      hare
    PortID:       ifname ethernet1/1/6
    SysName:      fox
    PortID:       ifname ethernet1/1/6
    SysName:      hound
    PortID:       ifname ethernet1/1/6

Output from host : 1xx.1xx.219.7
    SysName:      rabbit
    PortID:       ifname ethernet1/1/7
    SysName:      hare
    PortID:       ifname ethernet1/1/7
    SysName:      fox
    PortID:       ifname ethernet1/1/7
    SysName:      hound
    PortID:       ifname ethernet1/1/7

Output from host : 1xx.1xx.219.8
    SysName:      rabbit
    PortID:       ifname ethernet1/1/8
    SysName:      hare
    PortID:       ifname ethernet1/1/8
    SysName:      fox
    PortID:       ifname ethernet1/1/8
    SysName:      hound
    PortID:       ifname ethernet1/1/8
- Connect to the rabbit with admin credentials from and check interface status.
ECS Gen 1 or Gen 2
# ssh <switch name>
# show interfaces show interfaces Ethernet<Interface Number>
admin@ecs1:~> ssh rabbit
Password:
Last login: Tue Sep  5 11:13:30 2017 from 1xx.1xx.219.1
rabbit>show interfaces Ethernet12
Ethernet12 is down, line protocol is notpresent (notconnect)
  Hardware is Ethernet, address is 444c.a8de.8f83 (bia 444c.a8de.8f83)
  Description: MLAG group 4
  Member of Port-Channel4
  Ethernet MTU 9214 bytes , BW 10000000 kbit
  Full-duplex, 10Gb/s, auto negotiation: off, uni-link: n/a
  Loopback Mode : None
  0 link status changes since last clear
  Last clearing of "show interface" counters never
  5 minutes input rate 0 bps (0.0% with framing overhead), 0 packets/sec
  5 minutes output rate 0 bps (0.0% with framing overhead), 0 packets/sec
     0 packets input, 0 bytes
     Received 0 broadcasts, 0 multicast
     0 runts, 0 giants
     0 input errors, 0 CRC, 0 alignment, 0 symbol, 0 input discards
     0 PAUSE input
     0 packets output, 0 bytes
     Sent 0 broadcasts, 0 multicast
     0 output errors, 0 collisions
     0 late collision, 0 deferred, 0 output discards
     0 PAUSE output
Command:
ECS Gen 3
# ssh <switch name>
# show interfaces ethernet 1/1/<Interface Number>
Example:
ECS Gen 3
rabbit# show interface ethernet 1/1/4
Ethernet 1/1/9 is up, line protocol is down
Description: VLT Group 9
Port is part of Port-channel 9
Hardware is Dell EMC Eth, address is d8:9e:f3:c6:31:09
    Current address is d8:9e:f3:c6:31:09
Pluggable media not present

Interface index is 17305276
Internet address is not set
Mode of IPv4 Address Assignment: not set
Interface IPv6 oper status: Enabled
MTU 9216 bytes, IP MTU 9184 bytes
LineSpeed 0, Auto-Negotiation off
FEC is auto
Flowcontrol rx off tx off
ARP type: ARPA, ARP Timeout: 60
Last clearing of "show interface" counters: 6 days 17:39:09
Queuing strategy: fifo
Input statistics:
     0 packets, 0 octets
     0 64-byte pkts, 0 over 64-byte pkts, 0 over 127-byte pkts
     0 over 255-byte pkts, 0 over 511-byte pkts, 0 over 1023-byte pkts
     0 Multicasts, 0 Broadcasts, 0 Unicasts
     0 runts, 0 giants, 0 throttles
     0 CRC,  overrun, 0 discarded
Output statistics:
     0 packets, 0 octets
     0 64-byte pkts, 0 over 64-byte pkts, 0 over 127-byte pkts
     0 over 255-byte pkts, 0 over 511-byte pkts, 0 over 1023-byte pkts
     0 Multicasts, 0 Broadcasts, 0 Unicasts
     0 throttles, 0 discarded, 0 Collisions, 0 wreddrops
Rate Info(interval 299 seconds):
     Input 0 Mbits/sec, 0 packets/sec, 0% of line rate
     Output 0 Mbits/sec, 0 packets/sec, 0% of line rate
Time since last interface status change: 6 days 17:39:10
Check for possible network interface (NIC) cards issues:
Another component to check if the nodes message buffer (dmesg) for recent NIC issues on the affected node. In the below example, the NIC loops between being up and down status.
If there is a NIC alert in the dmesg, it may require replacing.
- If ECS Gen 1 or Gen 2 - Provide output to ECS support hardware engineer to analysis.
- If ECS Gen 3 - Provide output to the Dell hardware team who would be expert in EX-series hardware.
Command:
# sudo dmesg -T
Example:
admin@node1:~> sudo dmesg -T
[Tue Jul  6 09:40:56 2021] public: link status definitely up for interface slave-1, 25000 Mbps full duplex
[Tue Jul  6 09:40:56 2021] bnxt_en 0000:04:00.1 slave-1: NIC Link is Down
[Tue Jul  6 09:40:56 2021] public: link status definitely down for interface slave-1, disabling it
[Tue Jul  6 09:40:57 2021] public: link status definitely down for interface slave-1, disabling it
[Tue Jul  6 09:41:09 2021] bnxt_en 0000:04:00.1 slave-1: NIC Link is Up, 25000 Mbps full duplex, Flow control: ON - receive & transmit
[Tue Jul  6 09:41:09 2021] bnxt_en 0000:04:00.1 slave-1: FEC autoneg off encodings: None
[Tue Jul  6 09:41:09 2021] public: link status definitely up for interface slave-1, 25000 Mbps full duplex
[Tue Jul  6 09:41:10 2021] bnxt_en 0000:04:00.1 slave-1: NIC Link is Down
[Tue Jul  6 09:41:10 2021] bnxt_en 0000:04:00.1 slave-1: speed changed to 0 for port slave-1
[Tue Jul  6 09:41:11 2021] public: link status definitely down for interface slave-1, disabling it
[Tue Jul  6 09:41:20 2021] bnxt_en 0000:04:00.1 slave-1: NIC Link is Up, 25000 Mbps full duplex, Flow control: ON - receive & transmit
[Tue Jul  6 09:41:20 2021] bnxt_en 0000:04:00.1 slave-1: FEC autoneg off encodings: None
[Tue Jul  6 09:41:20 2021] public: link status definitely up for interface slave-1, 25000 Mbps full duplex
[Tue Jul  6 09:41:22 2021] bnxt_en 0000:04:00.1 slave-1: NIC Link is Down
[Tue Jul  6 09:41:22 2021] bnxt_en 0000:04:00.1 slave-1: speed changed to 0 for port slave-1
[Tue Jul  6 09:41:22 2021] public: link status definitely down for interface slave-1, disabling it
[Tue Jul  6 09:41:31 2021] bnxt_en 0000:04:00.1 slave-1: NIC Link is Up, 25000 Mbps full duplex, Flow control: ON - receive & transmit
[Tue Jul  6 09:41:31 2021] bnxt_en 0000:04:00.1 slave-1: FEC autoneg off encodings: None
[Tue Jul  6 09:41:32 2021] public: link status definitely up for interface slave-1, 25000 Mbps full duplex
[Tue Jul  6 09:41:33 2021] bnxt_en 0000:04:00.1 slave-1: NIC Link is Down
Cause
Possible Causes
This issue may occur due to one or more of the following conditions:
-
Improperly seated SFP
The Small Form‑Factor Pluggable (SFP) module may not have been fully seated during installation. -
User‑managed switch changes
Changes made on customer‑managed switches outside of Dell control—such as firmware upgrades, configuration changes, or maintenance activities—can cause network links to go down and then renegotiate, as described in the Resolution section. -
Failed ECS networking hardware, including:
- Network Interface Card (NIC)
- Network cable
- Small Form‑Factor Pluggable (SFP) module
- Network switch or switch port
Resolution
xDoctor Auto Healer: ObjectScale xDoctor v5.1‑109.0 / ECS xDoctor v4.8‑109.0 or later
- To manually trigger the Enabled auto healer, run the following command on the
master.racknode. This initiates the rack analyzers, which will validate and auto‑heal the nodes one at a time.
# sudo xdoctor --rap=RAP025
Example:
admin@ecsnode1:~> admin@ecsnode1:~> sudo xdoctor --rap=RAP025
2026-04-01 19:05:13,590: xDoctor_4.8-109.0 - INFO    : Initializing xDoctor v4.8-109.0 ...
2026-04-01 19:05:14,143: xDoctor_4.8-109.0 - INFO    : Removing orphaned session - session_1775070174.306
2026-04-01 19:05:14,146: xDoctor_4.8-109.0 - INFO    : Starting xDoctor session_1775070313.036 ... (SYSTEM)
2026-04-01 19:05:14,146: xDoctor_4.8-109.0 - INFO    : Primary Node Control Check ...
2026-04-01 19:05:14,336: xDoctor_4.8-109.0 - INFO    : xDoctor Composition - Analyzer(s):ac_interface_check
2026-04-01 19:05:14,352: xDoctor_4.8-109.0 - INFO    : Session limited to 0:40:00
2026-04-01 19:05:15,410: xDoctor_4.8-109.0 - INFO    : --------------------
2026-04-01 19:05:15,410: xDoctor_4.8-109.0 - INFO    : ECS Version: 3.8.1.4
2026-04-01 19:05:15,410: xDoctor_4.8-109.0 - INFO    : --------------------
2026-04-01 19:05:15,525: xDoctor_4.8-109.0 - INFO    : xDoctor Pre Features
2026-04-01 19:05:15,526: xDoctor_4.8-109.0 - INFO    : Cron Activation
2026-04-01 19:05:15,526: xDoctor_4.8-109.0 - INFO    : xDoctor already active ...
[... Truncated Output ...]
2026-04-01 19:05:21,987: xDoctor_4.8-109.0 - INFO    : ------------------------------
2026-04-01 19:05:21,992: xDoctor_4.8-109.0 - INFO    : Analyzing collected data ...
2026-04-01 19:05:21,992: xDoctor_4.8-109.0 - INFO    : Analysis Limit: 0:13:00
2026-04-01 19:05:21,993: xDoctor_4.8-109.0 - INFO    : ANALYZER [ac_interface_check]
2026-04-01 19:05:22,291: xDoctor_4.8-109.0 - INFO    : Autohealing interface_down on node 169.254.1.4 ...
2026-04-01 19:08:39,599: xDoctor_4.8-109.0 - INFO    : Autohealing interface_down on node 169.254.1.1 ...
2026-04-01 19:11:19,874: xDoctor_4.8-109.0 - INFO    : All data analyzed in 0:05:57
2026-04-01 19:11:20,709: xDoctor_4.8-109.0 - INFO    : --------------------
2026-04-01 19:11:20,709: xDoctor_4.8-109.0 - INFO    : Diagnosis Summary
2026-04-01 19:11:20,709: xDoctor_4.8-109.0 - INFO    : --------------------
2026-04-01 19:11:20,709: xDoctor_4.8-109.0 - INFO    : PSNT: CKM00190800120
2026-04-01 19:11:20,709: xDoctor_4.8-109.0 - INFO    : --------------------
2026-04-01 19:11:20,710: xDoctor_4.8-109.0 - INFO    : FIXED             =  1
2026-04-01 19:11:20,710: xDoctor_4.8-109.0 - INFO    : CRITICAL          =  0
2026-04-01 19:11:20,710: xDoctor_4.8-109.0 - INFO    : CRITICAL (CACHED) =  0
2026-04-01 19:11:20,710: xDoctor_4.8-109.0 - INFO    : ERROR             =  0
2026-04-01 19:11:20,710: xDoctor_4.8-109.0 - INFO    : ERROR (CACHED)    =  1
2026-04-01 19:11:20,710: xDoctor_4.8-109.0 - INFO    : WARNING           =  0
2026-04-01 19:11:20,710: xDoctor_4.8-109.0 - INFO    : INFO              =  0
2026-04-01 19:11:20,710: xDoctor_4.8-109.0 - INFO    : VERBOSE           =  0
2026-04-01 19:11:20,710: xDoctor_4.8-109.0 - INFO    : REPORT            =  0
2026-04-01 19:11:20,826: xDoctor_4.8-109.0 - INFO    : ---------------------
2026-04-01 19:11:20,826: xDoctor_4.8-109.0 - INFO    : xDoctor Post Features
2026-04-01 19:11:20,826: xDoctor_4.8-109.0 - INFO    : ----------------
2026-04-01 19:11:20,826: xDoctor_4.8-109.0 - INFO    : Data Combiner
2026-04-01 19:11:20,826: xDoctor_4.8-109.0 - INFO    : -------------
2026-04-01 19:11:20,827: xDoctor_4.8-109.0 - INFO    : Created a Data Collection Report (data.xml)
2026-04-01 19:11:20,827: xDoctor_4.8-109.0 - INFO    : ------
2026-04-01 19:11:20,827: xDoctor_4.8-109.0 - INFO    : SysLog
2026-04-01 19:11:20,827: xDoctor_4.8-109.0 - INFO    : ------
2026-04-01 19:11:20,828: xDoctor_4.8-109.0 - INFO    : Using Fabric as Syslog Server
2026-04-01 19:11:20,828: xDoctor_4.8-109.0 - INFO    : Syslog triggered on Warning
2026-04-01 19:11:20,828: xDoctor_4.8-109.0 - INFO    : Forwarded 1 event(s) to syslog
2026-04-01 19:11:20,828: xDoctor_4.8-109.0 - INFO    : ----
2026-04-01 19:11:20,828: xDoctor_4.8-109.0 - INFO    : SNMP
2026-04-01 19:11:20,828: xDoctor_4.8-109.0 - INFO    : ----
2026-04-01 19:11:20,829: xDoctor_4.8-109.0 - INFO    : Using 10.118.165.48:162 as SNMP server
2026-04-01 19:11:20,829: xDoctor_4.8-109.0 - INFO    : SNMP triggered on Warning
2026-04-01 19:11:26,905: xDoctor_4.8-109.0 - INFO    : Triggered 1 SNMPv2c event(s) and the SNMP server acknowledged 0 event(s)
2026-04-01 19:11:26,905: xDoctor_4.8-109.0 - INFO    : ------------
2026-04-01 19:11:26,905: xDoctor_4.8-109.0 - INFO    : ProcComplete
2026-04-01 19:11:26,905: xDoctor_4.8-109.0 - INFO    : ------------
2026-04-01 19:11:26,905: xDoctor_4.8-109.0 - WARNING : ProcComplete is disabled, please re-enable it (xdoctor --config)
2026-04-01 19:11:27,023: xDoctor_4.8-109.0 - INFO    : ----------------
2026-04-01 19:11:27,023: xDoctor_4.8-109.0 - INFO    : Session Archiver
2026-04-01 19:11:27,023: xDoctor_4.8-109.0 - INFO    : ----------------
2026-04-01 19:11:27,033: xDoctor_4.8-109.0 - INFO    : Session Stored in folder      - /usr/local/xdoctor/archive/other/2026-04-01_190513
2026-04-01 19:11:27,033: xDoctor_4.8-109.0 - INFO    : Session Archived as tar       - /usr/local/xdoctor/archive/other/xDoctor-CKMXXXXXXXXXXX-2026-04-01_190513.tgz
2026-04-01 19:11:27,034: xDoctor_4.8-109.0 - INFO    : --------------------------
2026-04-01 19:11:27,034: xDoctor_4.8-109.0 - INFO    : Session Report                - sudo xdoctor --report --archive=2026-04-01_190513
2026-04-01 19:11:27,034: xDoctor_4.8-109.0 - INFO    : ---------------
2026-04-01 19:11:27,034: xDoctor_4.8-109.0 - INFO    : Session Cleaner
2026-04-01 19:11:27,034: xDoctor_4.8-109.0 - INFO    : ---------------
2026-04-01 19:11:27,046: xDoctor_4.8-109.0 - INFO    : Removing folder  (count limit) - /usr/local/xdoctor/archive/other/2026-04-01_180540
2026-04-01 19:11:27,047: xDoctor_4.8-109.0 - INFO    : Removing archive (count limit) - /usr/local/xdoctor/archive/other/xDoctor-CKMXXXXXXXXXXX-2026-04-01_180540.tgz
2026-04-01 19:11:27,051: xDoctor_4.8-109.0 - INFO    : Cleaned 2 archived session(s)
2026-04-01 19:11:27,051: xDoctor_4.8-109.0 - INFO    : -------
2026-04-01 19:11:27,051: xDoctor_4.8-109.0 - INFO    : Emailer
2026-04-01 19:11:27,051: xDoctor_4.8-109.0 - INFO    : -------
2026-04-01 19:11:27,052: xDoctor_4.8-109.0 - INFO    : Using Dedicated Server (25:25) as SMTP Server ...
2026-04-01 19:11:27,052: xDoctor_4.8-109.0 - INFO    : Email Type = Individual Events
2026-04-01 19:11:27,052: xDoctor_4.8-109.0 - INFO    : ------------------------------
2026-04-01 19:11:27,053: xDoctor_4.8-109.0 - INFO    : xDoctor session_1775070313.036 finished in 0:06:14
2026-04-01 19:11:27,075: xDoctor_4.8-109.0 - INFO    : Successful Job:1775070313 Exit Code:200
- Run the session report to review the results of the manual auto‑heal execution.
# sudo xdoctor --report --archive=<session report>
Example:
admin@ecsnode1:~> sudo xdoctor --report --archive=2026-04-01_180344

xDoctor 4.8-109.0
CKMXXXXXXXXXXX - ECS 3.8.1.4

Displaying xDoctor Report (2026-04-01_180344) Filter:[] ...

----------------------------------------
FIXED - Auto Healer fixed interface_down
----------------------------------------
Node      = Nodes
Extra     = {"Nodes": {"169.254.1.1": ["pslave-0"]}}
Timestamp = 2026-04-01_190513
PSNT      = CKMXXXXXXXXXXX @ 4.8-109.0
- In the case you have a failure, open an SR for investigation.
Example of failure:------------------------------------------------------------------------------------- ERROR - (Cached) Auto fix failed - One or more network interfaces are down or missing ------------------------------------------------------------------------------------- Node = Nodes Extra = {"Nodes": {"169.254.1.4": ["pslave-1"]}} RAP = RAP025 Solution = KB 503814 Timestamp = 2026-04-01_190513 PSNT = CKMXXXXXXXXXXX @ 4.8-109.0
xDoctor Auto Pilot:
IMPORTANT: A new feature has been released in xDoctor 4-8.104.0 and later. This knowledge base (KB) is now automated with xDoctor to quickly attempt to recover a node interface by checking both node and switch details. If the script is unable to recover the interface, it provides a detailed summary of its findings.
To set up the automation repository with xDoctor 4-8.104.0 and later, follow ECS: ObjectScale: How to run KB Automation Scripts (Auto Pilot)
- Run the automation command from a node with xDoctor 4-8.104.0 and above.
Note:
--target-nodeis supported for this action. This script was included with the xDoctor 4-8.104.0 release, which features version 3.0 of the Ansible automation scripts.
# sudo xdoctor autopilot --kb 50341 --target-node <Node NAN IP>Example:
admin@ecsnode1:~> sudo xdoctor autopilot --kb 50341 --target-node 169.254.1.1
Checking for existing screen sessions...
Starting screen session 'autopilot_kb_50341_20250627_124206'...
Screen session 'autopilot_kb_50341_20250627_124206' started successfully.
Attaching to screen session 'autopilot_kb_50341_20250627_124206'...
- Review automation summary:
Example:
>TASK [Print all summaries] ***************************************************************************************************************************************************************************
ok: [169.254.1.7] => {
    "msg": [
        "Host: 169.254.1.7",
        "*******************************************************************************",
        "Node interface summary:",
        "*******************************************************************************",
        "Interface status for switch rabbit and node interface(slave-0):",
        "                           Node Interface: UP",
        "                           Node physical link detected: yes",
        "                           Node SFP Vendor: DELL",
        "                           Node SFP PN: VXFJY",
        "                           Node SFP Type: GBIC/SFP defined by 2-wire interface ID",
        "                           Node connection detected: ethernet1/1/7",
        "                           Switch Interface: ethernet1/1/7",
        "                           Switch Speed: 25G",
        "                           Switch Status: up",
        "                           Switch SFP Model: 25GBASE-CR-3.0M",
        "                           Switch SFP Qualified: true",
        "Interface status for switch hare and node interface(slave-1):",
        "                           Node Interface: UP",
        "                           Node physical link detected: yes",
        "                           Node SFP Vendor: DELL",
        "                           Node SFP PN: VXFJY",
        "                           Node SFP Type: GBIC/SFP defined by 2-wire interface ID",
        "                           Node connection detected: ethernet1/1/7",
        "                           Switch Interface: ethernet1/1/7",
        "                           Switch Speed: 25G",
        "                           Switch Status: up",
        "                           Switch SFP Model: 25GBASE-CR-3.0M",
        "                           Switch SFP Qualified: true",
        "Interface status for switch fox and node interface(pslave-0):",
        "                           Node Interface: UP",
        "                           Node physical link detected: yes",
        "                           Node SFP Vendor: DELL",
        "                           Node SFP PN: VXFJY",
        "                           Node SFP Type: GBIC/SFP defined by 2-wire interface ID",
        "                           Node connection detected: ethernet1/1/7",
        "                           Switch Interface: ethernet1/1/7",
        "                           Switch Speed: 25G",
        "                           Switch Status: up",
        "                           Switch SFP Model: 25GBASE-CR-3.0M",
        "                           Switch SFP Qualified: true",
        "Interface status for switch hound and node interface(pslave-1): ",
        "                           Node Interface:UP",
        "                           Node physical link detected:yes",
        "                           Node SFP Vendor: DELL",
        "                           Node SFP PN: VXFJY",
        "                           Node SFP Type: GBIC/SFP defined by 2-wire interface ID",
        "                           Node connection detected: ethernet1/1/7",
        "                           Switch Interface: ethernet1/1/7",
        "                           Switch Speed: 25G",
        "                           Switch Status: up",
        "                           Switch SFP Model: 25GBASE-CR-3.0M",
        "                           Switch SFP Qualified: true",
        "*******************************************************************************",
        "Actions taken and Reccomendations:",
        "*******************************************************************************",
        "Validated node(s) to switch connection are correct: PASS: Node(s) are correctly connected on all reachable Dell managed switches",
        "Validated SFP on the node(s): PASS: SFP detected on all interfaces",
        "Validated interface status on the node(s): PASS: All interfaces are up",
        "Validated SFP on the switches are qualified: PASS: All SFPs are qualified.",
        "Validated Frontend switch(es): PASS: All frontend switches appear to be Dell managed switches.",
        "Validated Backend switch(es): PASS: All backend switch(es) are reachable",
        "*******************************************************************************"
    ]
}

TASK [Fail if validation fails] **********************************************************************************************************************************************************************
skipping: [169.254.1.7] => {"changed": false, "skip_reason": "Conditional result was False", "skipped": true}

PLAY RECAP *******************************************************************************************************************************************************************************************
169.254.1.7                : ok=70   changed=6    unreachable=0    failed=0
localhost                  : ok=8    changed=1    unreachable=0    failed=0

Playbook execution successful
20241112 22:28:58.932: | PASS (2 min 44 sec)
================================================================================
Status: PASS
Time Elapsed: 3 min 1 sec
Debug log: /opt/emc/caspian/service-console/log/20241112_222531_run_KB_Fix/dbg_robot.log
HTML log: /opt/emc/caspian/service-console/log/20241112_222531_run_KB_Fix/log.html
================================================================================

[screen is terminating]
Manual Steps below:
Before doing any work: In cases where user-managed switches get maintained, like firmware upgrades, links can go down and may get renegotiated. The example below is for secondary-0 down after a firmware upgrade done from the user on a user-managed FE switch. The following command is used to renegotiate the interface:
ethtool -r <i/f name>

admin@ecs-n-1:~> sudo ethtool slave-0
Settings for slave-0:
        Supported ports: [ FIBRE ]
        Supported link modes:   1000baseX/Full
                                10000baseSR/Full
        Supported pause frame use: Symmetric
        Supports auto-negotiation: Yes
        Advertised link modes:  1000baseX/Full
                                10000baseSR/Full
        Advertised pause frame use: No
        Advertised auto-negotiation: Yes
        Speed: Unknown!
        Duplex: Unknown! (255)
        Port: FIBRE
        PHYAD: 0
        Transceiver: internal
        Auto-negotiation: off
        Supports Wake-on: g
        Wake-on: g
        Current message level: 0x0000000f (15)
                               drv probe link timer
        Link detected: no
admin@ecs-n-1:~>

admin@ecs-n-1:~> sudo ethtool -r slave-0
admin@ecs-n-1:~>

admin@ecs-n-1:~> sudo ethtool slave-0
Settings for slave-0:
        Supported ports: [ FIBRE ]
        Supported link modes:   1000baseX/Full
                                10000baseSR/Full
        Supported pause frame use: Symmetric
        Supports auto-negotiation: Yes
        Advertised link modes:  1000baseX/Full
                                10000baseSR/Full
        Advertised pause frame use: No
        Advertised auto-negotiation: Yes
        Speed: 10000Mb/s
        Duplex: Full
        Port: FIBRE
        PHYAD: 0
        Transceiver: internal
        Auto-negotiation: off
        Supports Wake-on: g
        Wake-on: g
        Current message level: 0x0000000f (15)
                               drv probe link timer
        Link detected: yes
There are different SFP models that use either copper or fiber. Also, Back-end and Front-End switches may use different types of SFP wires. Confirm which part is required before replacement.
Additional Information
Network cabling
The network cabling diagrams apply to U-Series, D-Series, or C-Series ECS Appliance in a Dell or customer provided rack.
- Hare: 10 GbE public switch is at the top of the rack in a U- or D-Series or the top switch in a C-Series segment.
- Rabbit: 10 GbE public switch is located below the hare in the top of the rack in a U- or D-Series or below the hare switch in a C-Series segment.
- Turtle: 1 GbE private switch that is located below rabbit in the top of the rack in a U-Series or below the hare switch in a C-Series segment.
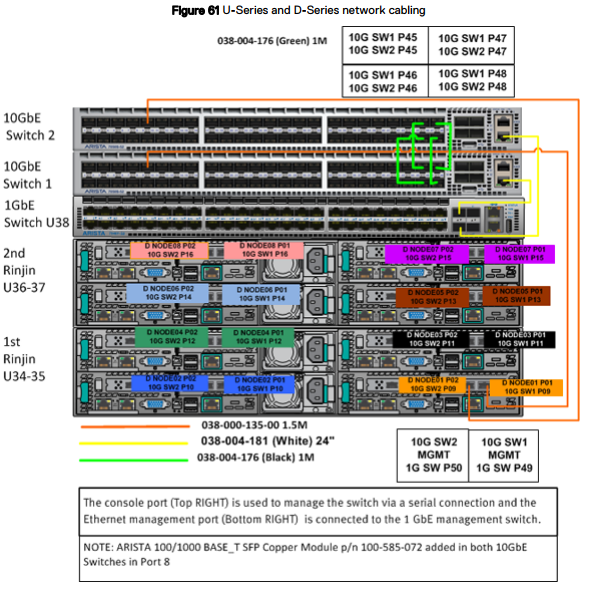
The following figure shows a simplified network cabling diagram for an eight-node rack configuration for a U- or D-Series ECS configured by Dell or customer. Following this figure, other detailed figures and tables provide port, label, and cable color information.
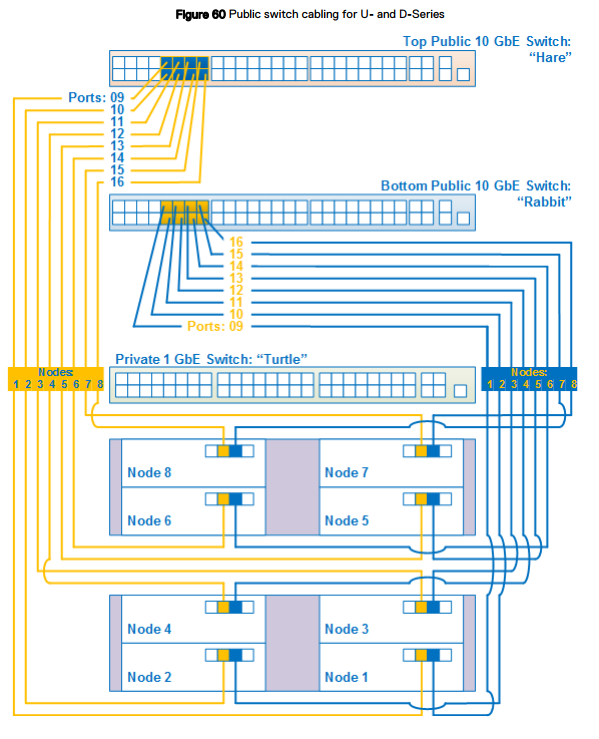
Switch 1 = Rabbit = Bottom switch
Switch 2 = Hare = Top switch
Node ports:
Secondary-0 = P01 = right port - connects to Switch 1 / Rabbit/Bottom switch.
Secondary-1 = P02 = left port - connects to Switch 2 / Hare/Top switch.