DD Health Check Steps for cloud deployed DDVE performance troubleshooting
Summary: Cloud deployed DDVE performance decrease if there are any errors on object-store/account. In cloud environments DDVE depend on the cloud infrastructure, cause of slowness or latency must be nailed down. This doc offers some starting points for the investigation. ...
Instructions
Information about the setup:
Storage account name (autosupport or CLI):
#Storage object-store profile show
DDVE performance details
- Cloud operation histogram (in se mode): It gives all the operations and error stats for cloud object-store.
SE# filesys show detailed-stats 143
--> See Example 1 in additional info. - Object store performance: To see All the requests in the GET/PUT/DELETE operations histogram.
# system show performance custom-view objectstore 1 hr interval 5 min
--> See Example 2 in additional info. - Check for small file workload
- Workloads with many small files may impact Data Domain Virtual Edition performance and file system cleaning. There is no workaround for this limitation. This is documented in DD OS release notes. Data Domain: DDOS Software Versions and Download Links
- See KB Data Domain: Storage Management: Viewing File Distribution for details finding file distribution.
Azure Tools
Choose your BLOB storage account … Scroll down to Monitoring - Metrics à Choose Metrics to start a new Chart.
The transaction-related Metrics to check:
1) Availability
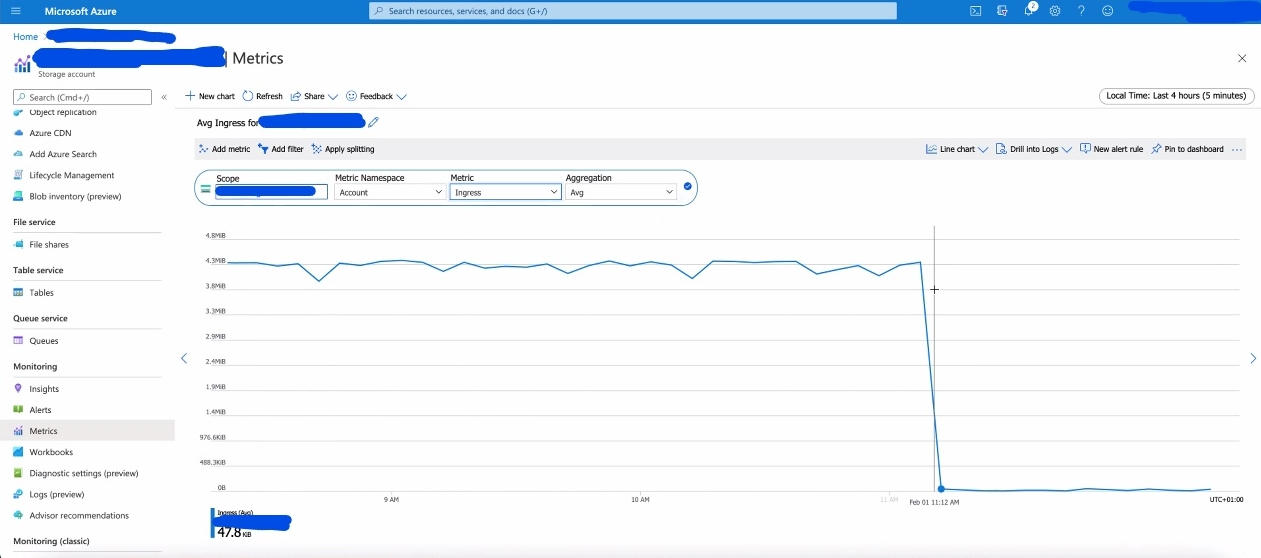
2) Egress and Ingress
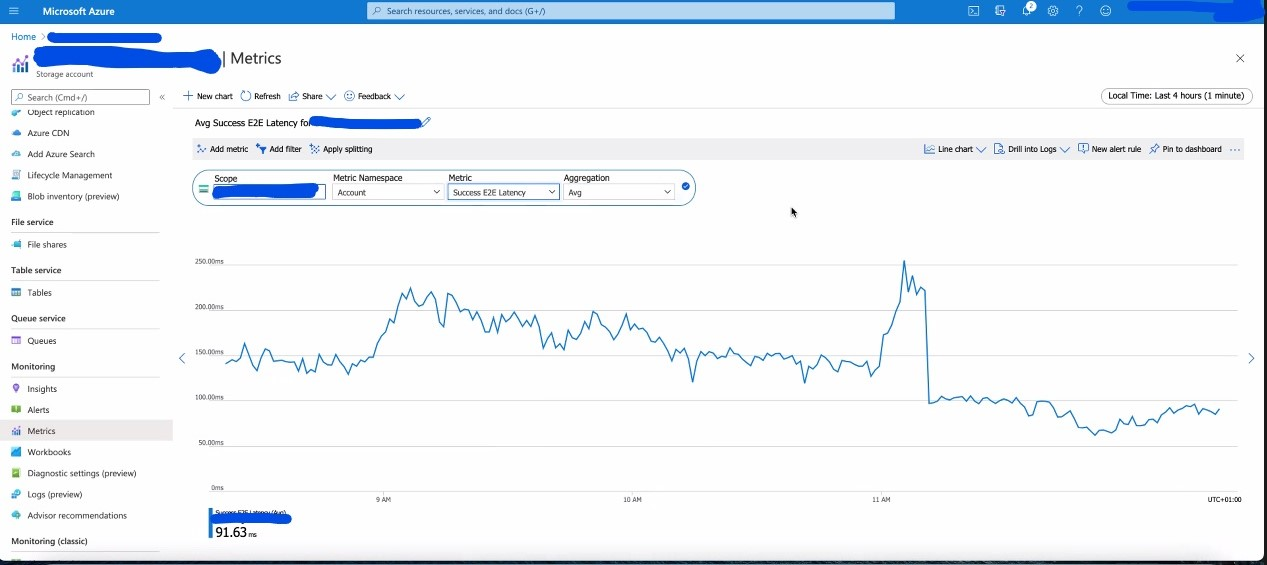
3) Success end to end (E2E) Latency
4) Success server latency
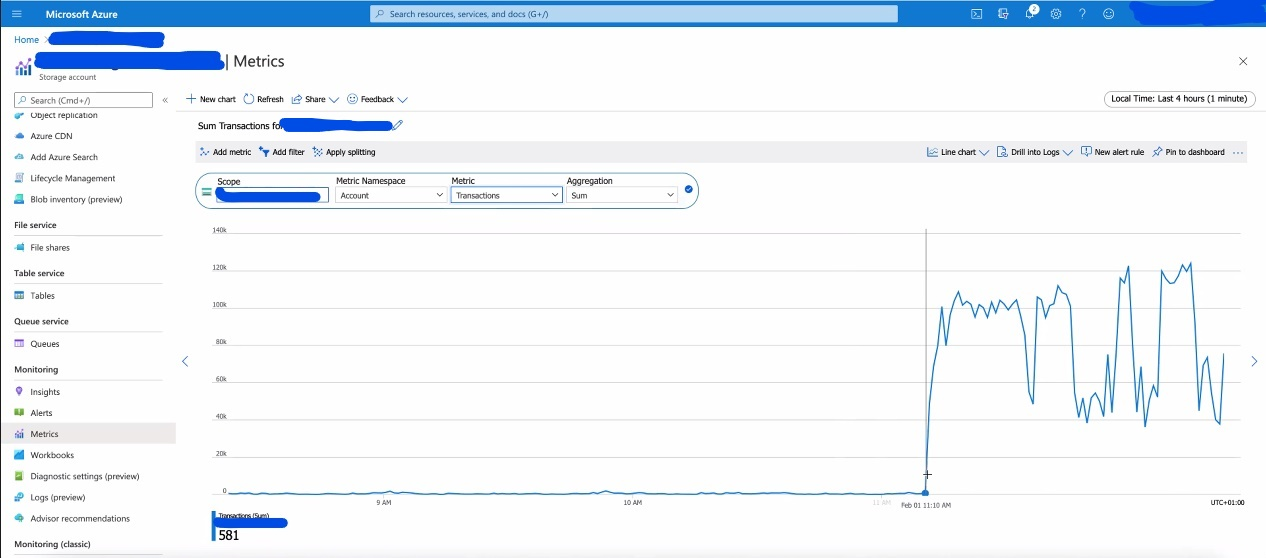
5) Transactions
6) Set the time up to 7 days.
Note: Microsoft support can generate more detailed /different metrics
è See some screenshots below in Additional info.
Abbreviations and Terms
| ATOS | Active Tier on Object Storage |
| BLOB | Microsoft's object storage solution for the cloud |
| Storage account | Unique namespace for your data in Azure |
Additional Information
Show Storage Account:
sysadmin@myddve# Storage object-store profile show
        Account name: mystorageaccountsdisks
        Container name: ddve
        Provider: Azure
Example1:
SE@myddve## filesys show detailed-stats 143

CURL op latency histogram for bucket: myddve
        op                             mean      std-dev     <10 ms    <100 ms     <500ms        <1s        <5s       <10s       <30s       >30s      total        max        min
        cl_namelookup_time          0.035ms      7.473ms 1032154848     273883      76702        573       3367        698          0          0 1032510071   9190.000      0.000
        cl_connect_time             0.483ms      9.101ms 1025872127    6352095     278605       2308       4130        714         92          0 1032510071  10020.000      0.000
        cl_appconnect_time          3.955ms     16.375ms  920458400  108081718    3937267      26735       5106        752         93          0 1032510071  10046.000      0.000
        cl_pretransfer_time         3.980ms     16.393ms  918466565  110063549    3947243      26763       5106        752         93          0 1032510071  10046.000      0.000
        cl_starttransfer_tim       13.004ms     22.011ms  656937890  367616983    7879797      64922       9414        807        257          1 1032510071  30946.000      0.000
        cl_total_time              16.936ms     33.864ms  613181931  398242989   20531439     496186      56329        927        268          2 1032510071  40104.000      2.000
        cl_redirect_time            0.000ms      0.002ms 1032510066          5          0          0          0          0          0          0 1032510071     37.000      0.000

CURL op speed histogram for bucket: myddve
        op                             mean      std-dev     <1KB/s     <2KB/s     <4KB/s     <8KB/s    <16KB/s    <32KB/s    <64KB/s    >64KB/s      total        max        min
        cl_speed_upload           189.287KB/s   2756.530KB/s 1027058892       1770       1641       4676        419        769       1685    5440219 1032510071  83781.000      0.000
        cl_speed_download        8471.076KB/s   5267.179KB/s    7998493    3684431    7259368   27068175   29557114   33928592   38259204  884754694 1032510071  78070.000      0.000

Cloud op stats for bucket: myddve
        Number of PUT object requests         : 5451672
        Number of GET object requests         : 1024738078
        Number of DELETE object requests      : 2320002
        Number of BULK_DELETE object requests : 0
        Number of MULTI COPY object requests  : 0
        Number of LIST object requests        : 0
        Number of SSC object requests         : 0

Cloud error stats for bucket:myddve
        Number of Retries                     : 125
        Number of generic curl errors         : 0
        Number of curl connectivity errors    : 106
        Number of curl op timed out errors    : 0
        Number of curl ssl errors             : 9
        Number of curl got nothing errors     : 0
        Number of curl recv errors            : 6
        Number of curl send errors            : 3
        Number of http 0 errors               : 0
        Number of http 301 errors             : 0
        Number of http 400 errors             : 0
        Number of http 403 errors             : 0
        Number of http 404 errors             : 392
        Number of http 408 errors             : 0
        Number of http 409 errors             : 0
        Number of http 416 errors             : 0
        Number of http 429 errors             : 0
        Number of http 500 errors             : 1
        Number of http 503 errors             : 0
        Number of http 504 errors             : 0
        Number of http 507 errors             : 0
================================================================================================
Example 2:
========
SE@myddve## system show performance custom-view objectstore duration 3 hr interval 1 min
-----------------------------------------------------------------------------------------------------
Time Stamp         | Throughput                     IOPS/s                        Latency           |
                   | MiB/s     MiB/s                                                (ms)            |
Date       Time    |                                                                                |
YYYY-MM-DD HH:MM:SS| GET       PUT           GET     PUT     DELETE      GET       PUT       DELETE |
-----------------------------------------------------------------------------------------------------
2020-12-13 21:53:00  2.0       1.9           37      0       0           32.5      110.8     0.0
2020-12-13 21:54:00  2.5       6.5           49      1       0           24.7      127.3     0.0
2020-12-13 21:55:00  1.9       0.2           33      0       0           31.9      218.7     0.0
2020-12-13 21:56:00  0.7       1.4           11      0       0           36.5      107.5     0.0
2020-12-13 21:57:00  0.7       1.4           12      0       0           27.3      94.9      0.0
2020-12-13 21:58:00  0.0       2.9           0       0       0           0.0       101.4     0.0
2020-12-13 21:59:00  0.0       1.3           0       0       0           0.0       89.5      0.0
2020-12-13 22:00:00  0.0       0.3           0       0       0           0.0       87.8      0.0
2020-12-13 22:01:00  1.3       5.1           24      1       0           9.6       121.9     0.0
2020-12-13 22:02:00  11.5      0.7           241     0       0           33.0      125.5     0.0
2020-12-13 22:03:00  5.4       4.4           116     1       0           39.8      125.6     0.0
2020-12-13 22:04:00  0.4       1.5           6       0       0           12.6      96.2      0.0
2020-12-13 22:05:00  0.2       0.4           3       0       0           10.8      99.3      0.0
Screenshots of Azure Details:
Networker Restore – DD Read Operation = Egress:
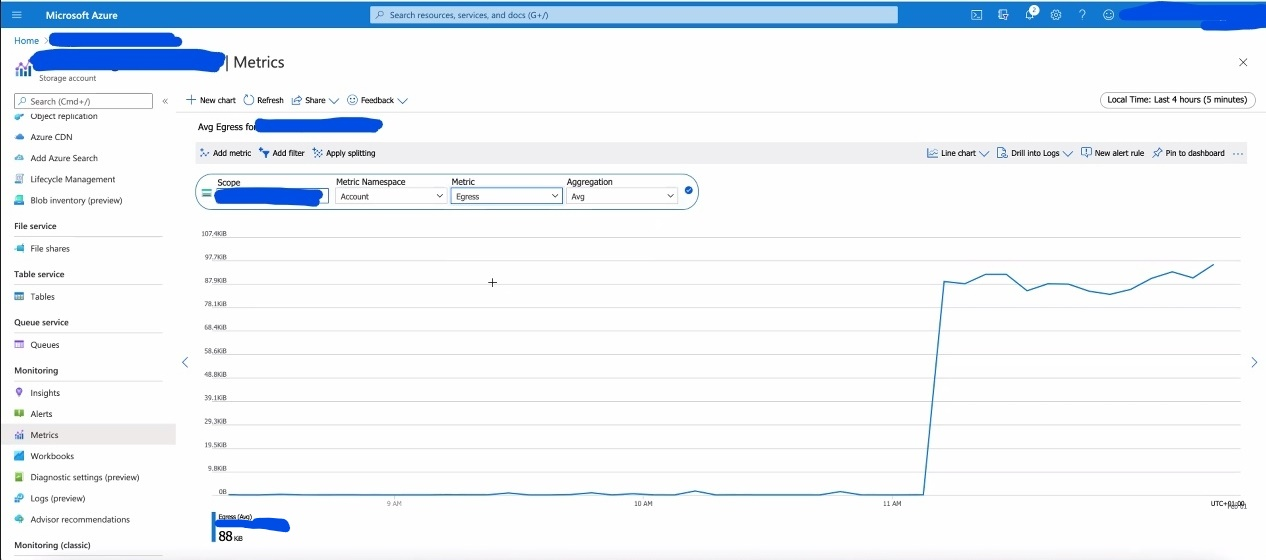
Networker Backup DD Write Operation = Ingress:
E2E Latency:
Transactions: