Article Number: 000121107
Dell Networking: How to Capture Packets on N-Series OS6 Switches and Switch CPU
Summary: Dell Networking: How to Capture Packets on N-Series OS6 Switches
Article Content
Instructions
The objective of this article is to provide information about configuring Switchport analyzer (SPAN) and Remote Switchport analyzer (RSPAN) on N-Series switches along with CPU captures.
The configuration requirements and limitations below apply to the following N-Series models:
SPAN is used to send a copy of the traffic from one port to another port on the switch that has been connected to a SwitchProbe (Wireshark) device or other Remote Monitoring (RMON) probe or security device. SPAN mirrors receive or send (or both) traffic on one or more source ports to a destination port for analysis.
RSPAN has all the features of SPAN, plus support for source ports and destination ports that are distributed across multiple switches, allowing one to monitor any destination port located on the RSPAN VLAN. Hence, you can monitor the traffic on one switch using a device on another switch.

Switch 2:
Switch 2
Other possible options to capture the traffic are listed below:
To save the CPU captured outputs in a PCAP file in flash:
To capture the CPU traffic to the console.
The configuration requirements and limitations below apply to the following N-Series models:
- N1100-ON
- N1500
- N2000
- N2100
- N3000
- N3000E
- N3100
- N4000
SPAN:
SPAN is used to send a copy of the traffic from one port to another port on the switch that has been connected to a SwitchProbe (Wireshark) device or other Remote Monitoring (RMON) probe or security device. SPAN mirrors receive or send (or both) traffic on one or more source ports to a destination port for analysis.
Note: VLAN interfaces may be configured as a source for monitor sessions, but configured monitor sessions are limited to no more than one source VLAN across all configured monitoring sessions.
RSPAN:
RSPAN has all the features of SPAN, plus support for source ports and destination ports that are distributed across multiple switches, allowing one to monitor any destination port located on the RSPAN VLAN. Hence, you can monitor the traffic on one switch using a device on another switch.
SPAN:
Topology:
Configuration:
- Define the session ID and the source interface. In the example given below, 1 is the session ID and Gi1/0/4 is the source interface.
console(config)# monitor session 1 source interface gigabitethernet1/0/4
- Define the destination interface. In the example given below, Gi1/0/8 is the destination interface.
console(config)# monitor session 1 destination ,interface gigabitethernet1/0/8
- Enable the session which is required to start the capture.
console(config)# monitor session 1 mode
Output to verify:
console# show monitor session 1
Session                                : 1
Admin mode                          : Enabled
Type                                     : Local session
Source ports                         :
  Both                                   : Gi1/0/4
Destination port                      :Gi1/0/8
Remove RSPAN Tag              :False
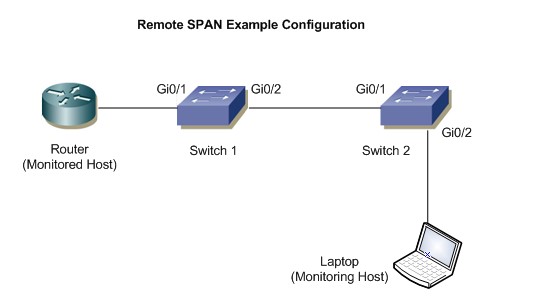
RSPAN:
Topology:
Configuration:
Switch 1:- Define the VLAN which is used for remote-span. In this example, it is VLAN 100.
console(config)# vlan 100
- Specify the VLAN as remote-span.
console(config-vlan100)# remote-span
- Define the session ID and source interface. In this example, the session ID is 1 and the source interface is Gi1/0/2
console(config)# monitor session 1 source interface gigabitethernet1/0/2
- Specify the remote VLAN and destination port which is uplinked to the destination switch.
console(config)# monitor session 1 destination remote vlan 100 reflector-port gigabitethernet 1/0/2
- Enable the session to start the capture.
console(config)# monitor session 1 mode
Switch 2:
- Define the VLAN which is used for RSPAN. In this example, it is VLAN 100.
console(config)# vlan 100
- Specify the VLAN as RSPAN.
console(config-vlan100)# remote-span
- Define the session ID and source interface. In this example, the session ID is 1 and the source interface is VLAN 100
console(config)# monitor session 1 source remote vlan 100
- Define the destination port where capture is collected.
console(config)# monitor session 1 destination gigabitethernet0/2
- Enable the session.
console(config)# monitor session 1 mode
Outputs to Verify:
Switch 1console# show monitor session 1 Session :1 Admin mode : Enabled Type : Remote source session Source ports : Both : Gi1/0/1 Destination port : Gi1/0/2 Remove RSPAN Tag : False Destination RSPAN VLAN : 100
Switch 2
console# show monitor session 1

Session                                     : 1
Admin mode                              : Enabled
Type                                          : Remote source session
Source ports                              :
  Both                                       : VLAN 100
Destination port                         : Gi1/0/2
Remove RSPAN Tag                 : False
Destination RSPAN VLAN          : 100
Other possible options to capture the traffic are listed below:
To save the CPU captured outputs in a PCAP file in flash:
- Define the capture mode to the file to save it in flash:
console(config)# monitor capture mode file
- To start the capture, use the below command:
console(config)# monitor capture Start all
- To Copy the local capture file to a TFTP server:
console# copy flash://cpuPktCapture.pcap tftp://TFTP_server_IP/mypkts.pcap
To capture the CPU traffic to the console.
- Define the capture mode to the line to see the capture in the CLI:
console(config)# monitor capture line
- To start the capture, use below command:
console# monitor capture start all
- To see the capture, use the below command:
console# show monitor capture packets
Article Properties
Affected Product
PowerSwitch N1100-ON Series, PowerSwitch N1500 Series, PowerSwitch N2000 Series, PowerSwitch N2100 Series, PowerSwitch N3000 Series, Dell EMC PowerSwitch N3000E-ON Series, Dell EMC PowerSwitch N3100 Series, PowerSwitch N4000 Series
Last Published Date
15 Apr 2024
Version
5
Article Type
How To