How to Collect Netskope Logs
摘要: Learn step-by-step instructions for how to collect logs for Netskope on Windows, Mac, or Android.
本文章適用於
本文章不適用於
本文無關於任何特定產品。
本文未識別所有產品版本。
說明
The following article provides details on how to collect logs from Netskope clients.
Affected Products:
- Netskope
Affected Operating Systems:
- Windows
- Mac
- Android
Click Windows, Mac, or Android for more information.
Windows
Logs may be collected through the product's:
Click on the appropriate method for more information.
UI
- Log in to the affected endpoint.
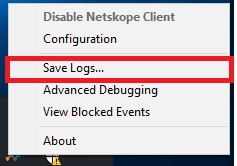
- Right-click the Netskope icon in the System Tray and then click Save Logs.
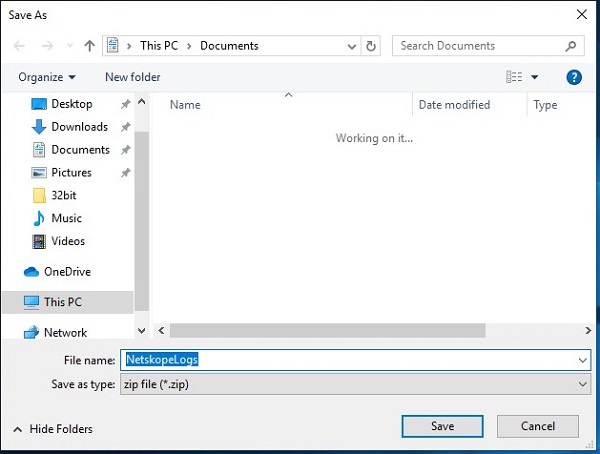
- Choose where to save the log bundle and then click Save.
CLI
- Log in to the affected endpoint.
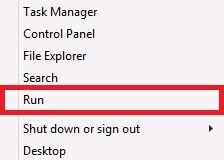
- Right-click the Windows start menu and then select Run.
- In the Run UI, type
cmdand then press CTRL+SHIFT+ENTER. This runs Command Prompt as an administrator.
- In Command Prompt, type
"%ProgramFiles(x86)%\Netskope\STAgent\nsdiag.exe" -o "%USERPROFILE%\Desktop\Netskope.zip"and then press Enter.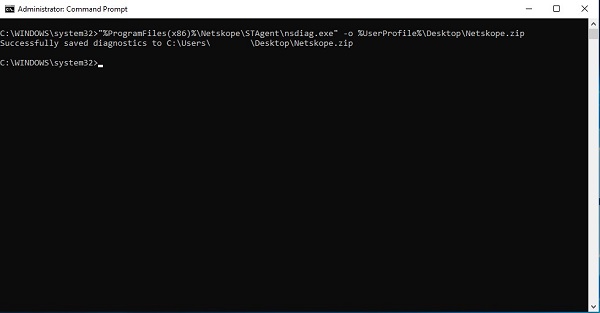
Tenant UI
To successfully collect logs from the tenant UI, the logs require:
- The affected endpoint to be powered on with a valid user logged in.
- The hostname to be provided to Dell Data Security ProSupport.
- The user email to be provided to Dell Data Security ProSupport.
Warning:
- In a web browser, go to the Netskope web console:
- United States data center: https://[TENANT].goskope.com/
- European Union data center: https://[TENANT].eu.goskope.com/
- Frankfurt data center: https://[TENANT].de.goskope.com/
Note: [TENANT] = The tenant name in your environment - Log in to the Netskope web console.
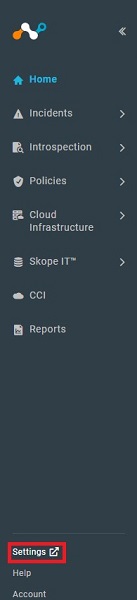
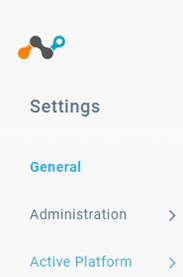
- Click Settings.
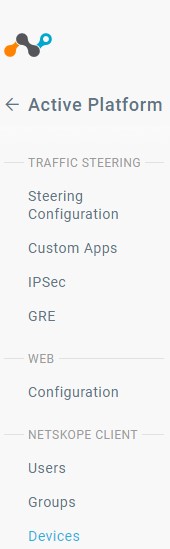
- Click Active Platform.

- Click Devices.
- Locate the affected endpoint, select the
...icon to the right, and then click Collect Log. Note: The device logs are pulled and posted to the Netskope backend within an hour. Only Dell Data Security ProSupport has access to these logs.
Mac
Logs may be collected through the product's:
Click the appropriate method for more information.
UI
- Log in to the affected endpoint.
- Click the Netskope icon in the Menu Bar and then click Save Logs.

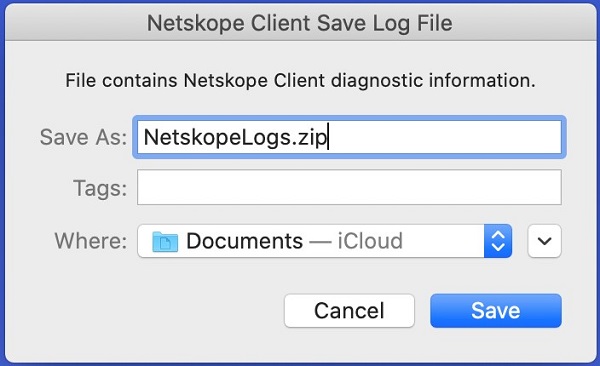
- Choose where to save the log bundle to and then click Save.
Terminal
- Log in to the affected endpoint.
- In the Apple menu, click Go and then select Utilities.

- Double-click Terminal.

- In Terminal, type
/Library/Application\ Support/Netskope/STAgent/nsdiag -o ~/Desktop/Netskope.zipand then press Enter.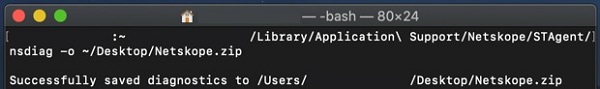
Tenant UI
To successfully collect logs from the tenant UI, the logs require:
- The affected endpoint to be powered on with a valid user logged in.
- The hostname to be provided to Dell Data Security ProSupport.
- The user email to be provided to Dell Data Security ProSupport.
Warning:
- In a web browser, go to the Netskope web console:
- United States data center: https://[TENANT].goskope.com/
- European Union data center: https://[TENANT].eu.goskope.com/
- Frankfurt data center: https://[TENANT].de.goskope.com/
Note: [TENANT] = The tenant name in your environment - Log in to the Netskope web console.

- Click Settings.

- Click Active Platform.
- Click Devices.

- Locate the affected endpoint, select the
...icon to the right, and then click Collect Log.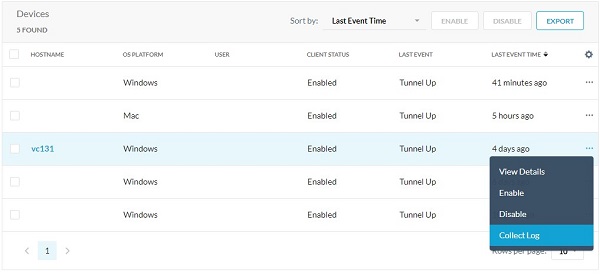 Note: The device logs are pulled and posted to the Netskope backend within an hour. Only Dell Data Security ProSupport has access to these logs.
Android
Logs can be gathered from the app on Android.
- Open your Netskope Client app from your device’s app launcher.
- In the upper right corner, tap the Menu button and then tap Send Log.
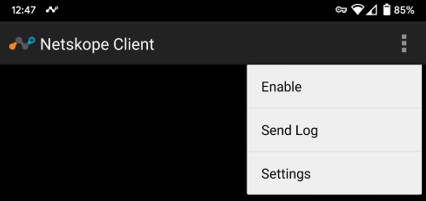
- Your device’s Share Menu displays. Select the way that you would like to send the
NetskopeLogs.zipfile.
To contact support, reference Dell Data Security International Support Phone Numbers.
Go to TechDirect to generate a technical support request online.
For additional insights and resources, join the Dell Security Community Forum.
受影響的產品
Netskope文章屬性
文章編號: 000126727
文章類型: How To
上次修改時間: 01 7月 2025
版本: 9
向其他 Dell 使用者尋求您問題的答案
支援服務
檢查您的裝置是否在支援服務的涵蓋範圍內。