PowerFlex 4.6 Multiple pods keep restarting
Summary: Multiple pods keep restarting during and after a Storage Only (SO) and Compute Only (CO) Resource Group (RG) new deployments. See Additional Info to see if the Temporary Relief instruction helps to stabilize the pods and UI. ...
Symptoms
This behavior has been observed when performing the following tasks in PowerFlex Manager Platform (PFMP) 4.x with a Resource inventory count of 100-200+.
- Attempting to deploy new RGs
- Attempting to expand (Add Node, Add Storage, Add Network) on an existing RG
- Attempting to Retry an RG in Error state
- Performing Update Resource Group Details on an RG
- Running Inventory on many or all Resources in the PFMP Resource Inventory
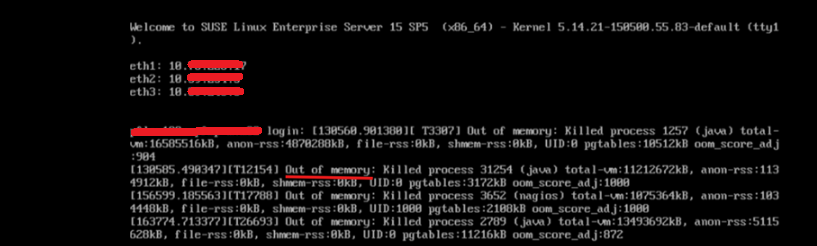
Checking the MVM VM Virtual Console may provide more information as to why an MVM is reporting NotReady and pods are terminating. In this example, the MVM is Out of memory. OOM killer is killing processes to free up memory:
Impact
- Unstable system health state, and UI stop responding or not available
Cause
Due to a software issue in PowerFlex Manager Platform (PFMP) versions 4.5-4.6 PFMP environments with 100-200+ Resources require more Virtual Hardware resources than previously advertised:
Default Settings
14 CPU cores and 32 GB of memory.
Recommended Settings
28 CPU cores and 64 GB of memory.
Resolution
MVM Power Off Procedure
Once all MVMs are in a STATUS of Ready (kubectl get nodes). The following procedure can be applied.
Log in to an MVM and run the following command to validate the CMO database health:
- Validate database health state:
kubectl exec -n powerflex -c database $(kubectl get pods -n powerflex -l='postgres-operator.crunchydata.com/role=master, postgres-operator.crunchydata.com/instance-set' | grep Running | cut -d' ' -f1) -- sh -c 'patronictl list'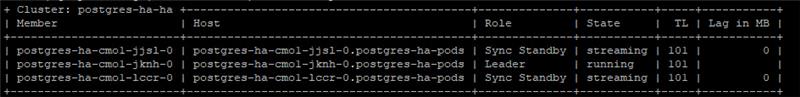
A healthy state is having one MVM as the leader, and the state is running, and two Sync Standby, and the state is streaming.
- Database shutdown
Run the following command on one of the three MVMs.
kubectl patch postgrescluster.postgres-operator.crunchydata.com/postgres-ha -n powerflex --type merge --patch '{"spec":{"shutdown":true}}'The Scope of instruction is for MVMs running as VMs on ESXi hosts managed by vCenter.
- Power off the MVMs using VCenter.
Note: If you are running MVMs in a KVM environment. Use the steps for KVM to shutdown the MVMs If needed, reach out to your KVM administrator for guidance.
- Click on the Cluster level.
- Click the VMs tab
- Apply a filter that results in only the three MVMs listed.
- Click the checkbox for the three MVMs.
- Right click Power> Shut Down Guest OS
Update MVM VMs to configure 28 vCPUs and 64GB of Memory.
Slow performing PFMP UI and/or PFMP environments with 200+ resources require additional CPU and Memory:
New Values
- CPU - 28 cores
- Memory - 64 GB
Note: If you are running MVMs in a KVM environment. Use the steps for KVM to increase CPU and Memory for KVM Virtual Machines. If needed, reach out to your KVM administrator for guidance.
- With the MVMs in a Powered Off State
- Right-click one MVM at a time.
- Click Edit Settings
- Change the value for CPU from 14 to 28
- Change the Memory value from 32 to 64
- Click OK
================================================================================
MVM Power on procedure
- Power on all three MVMs. Wait 5 minutes for
rke2services to come online.
- On each MVM, run the following command to check that the three nodes are in a STATUS of Ready:
kubectl get nodes
If a node is in a STATUS of NotReady. Do the following depending on the output ofsystemctl status rke2-serverStatus of the rke2-server
Do the following
Active
Go to the next step
Activating
Repeat the command to check the rke2-server status until active.
Failed
Attempt to start the service by running the following command:
systemctl start rke2-server - Once the rke2-server is active on all the MVMs, ensure that all nodes are in a Ready STATUS:
Once the nodes are Ready, go to the next step. If an error message appears, wait for a few minutes and try againkubectl get nodes
- Start the CMO DB.
- Start the cluster monitoring operator (CMO) database:
kubectl patch postgrescluster.postgres-operator.crunchydata.com/postgres-ha -n powerflex --type merge --patch '{"spec":{"shutdown":false}}' - Verify the CMO database is healthy with one Leader (running) and two Sync Standby (streaming):
kubectl exec -n powerflex -c database $(kubectl get pods -n powerflex -l='postgres-operator.crunchydata.com/role=master, postgres-operator.crunchydata.com/instance-set' | grep Running | cut -d' ' -f1) -- sh -c 'patronictl list'
- Start the cluster monitoring operator (CMO) database:
- Monitor the PowerFlex management platform status:
- Run the following command to identify the port number for the PowerFlex management platform monitor utility:
kubectl get services monitor-app -n powerflex -o jsonpath="{.spec.ports[0].nodePort}{\"\n\"}" - Wait for 20-30 minutes and check the overall health status of the PowerFlex management platform.
- Run the following command to identify the port number for the PowerFlex management platform monitor utility:
- Go to http://<node IP>:port/, where the node IP address is a management IP address that is configured on any of the MVMs (not the Ingress or PowerFlex Manager IP address).
- Click PFMP status and wait for all entries to turn green.
- PFMP main UI will now be accessible (This can take 20 to 30 minutes).
Impacted Versions
PFMP 4.x
Fixed In Version
PFMP 4.8
Additional Information
Temporary Relief (In case you are unable to increase CPU and MEM)
This may not provide relief in all environments. To reduce the load on PFMP. Disable health monitoring. This is a temporary solution to improve UI performance until the CPU and MEM can be increased. This stops Resource health checks, which place a load on PFMP with large Resource inventories.
- Disable PFxM health monitoring. This command is ran on one of the 3 MVMs.
kubectl scale --replicas=0 deployment/pfxm-health-monitoring -n powerflex- Wait 5 minutes, then browse the PFMP UI. If the stability is improved and the pages load as expected. Leave Health Monitoring disabled for now.
- Once the MVMs have increased CPU and Memory as instructed in the Resolution section above. Run the following command to enable Health Monitoring
- Enable PFxM health monitoring. This command is ran on one of the 3 MVMs.
kubectl scale --replicas=1 deployment/pfxm-health-monitoring -n powerflex