PowerFlex:CPU 概念和故障处理
Summary: 一些用户可能并不了解 CPU 概念以及如何进行基本的故障处理。 本知识库文章提供了与 CPU 相关的信息和故障处理方法。
Instructions
概念解释
-
中央处理器 (CPU):CPU 是执行计算机程序指令的硬件。
它执行计算机系统的基本算术、逻辑和输入/输出操作。
通常称为处理器或插槽 -
CPU 核心:CPU 核心是实际的 CPU 处理组件。
它处理从线程收到的所有命令序列。
也称为 pCPU (VMware) -
CPU 线程:CPU 线程是 CPU 核心的虚拟版本。
线程只是一个有序的指令序列。 -
逻辑核心:每个 CPU 线程直接与逻辑核心进行比较。逻辑核心数测量物理核心可以同时运行的操作数。
借助超线程功能,一个物理核心可以运行两个操作,因此具有两个逻辑核心。 -
超线程:这是 CPU 将其每个物理核心拆分为虚拟核心(称为线程)的过程。
可以在支持它的操作系统 (OS) 和 BIOS 上启用/禁用。 -
虚拟中央处理器 (vCPU):虚拟机 (VM) 操作系统将每个 vCPU 视为单个物理 CPU 核心。
表示分配给虚拟机的物理核心的部分或份额
根据具体的虚拟机管理程序,每个物理核心支持每个虚拟机 5 至 10 个 vCPU。
CPU > 核心 > vCPU 图表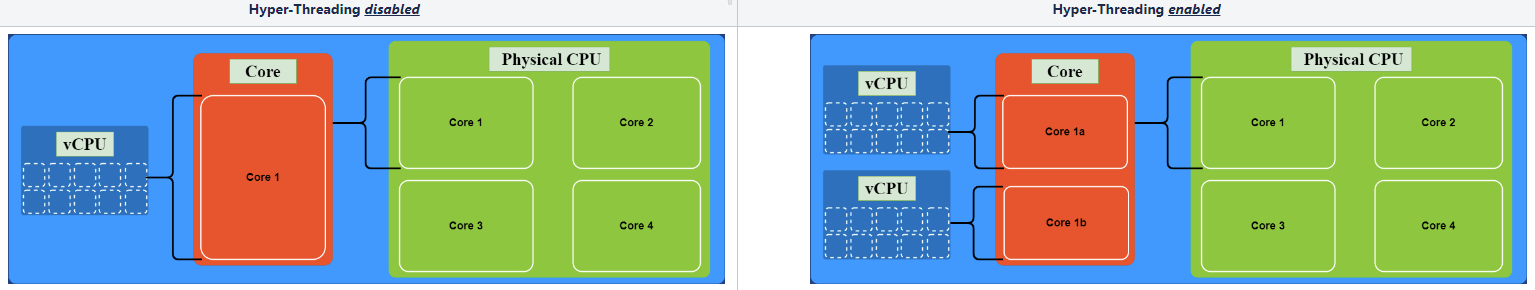
物理核心与逻辑核心lscpu 命令输出
lscpu | egrep 'Socket\(s\)|Core\(s\) per socket|Thread\(s\) per core|CPU\(s\)\:' | tac
示例输出:
Socket(s):              2    ← The motherboard has 2 CPU processors/sockets.
Core(s) per socket:     8    ← Each CPU socket has 8 physical cores. Hence, it has 16 physical cores in total.
Thread(s) per core:     2    ← Each physical CPU core can run 2 threads = Hyper-Threading enabled.
CPU(s):                 32   ← The computer has 2 × 8 × 2 = 32 logical cores in total.
逻辑核心总索引 = CPU 插槽数 × 每个插槽的物理核心数 × 每个物理核心的线程数。
/proc/cpuinfo 文件输出
echo " "; echo "Model Name: "$(cat /proc/cpuinfo|egrep 'model name'|head -1|awk '{for(i=4;i<=20;i++)printf "%s ",$i;print ""}'); cat /proc/cpuinfo | egrep 'processor|physical id|siblings|core id|cpu cores' | sed "s/^processor/\n&/"
输出示例:
所有输出值都从零开始。
processor     : 0    ← The index number of threads.
physical id   : 0    ← CPU socket index #0 (the only one if no other physical id's in the full output).
siblings      : 8    ← The amount of logical cores in the socket.
core id       : 0    ← CPU core index #0.
cpu cores     : 4    ← CPU socket index #0 has 4 physical cores.
逻辑核心总数 = 插槽中的逻辑核心数 × 物理 ID 总数
PowerFlex 文档和日志
要查找有关 PowerFlex 服务器的 CPU 相关信息,您可以使用以下方法:
仅在实时系统上lscpu
echo " ";echo "Model Name: "$(lscpu|egrep 'Model name'|awk '{for(i=4;i<=20;i++)printf "%s ",$i;print ""}');echo " ";lscpu|egrep 'Socket\(s\)|Core\(s\) per socket|Thread\(s\) per core|CPU\(s\)\:'|tac
示例输出:
Model name:             Intel(R) Core(TM) i5-8350U CPU @ 1.70GHz

Socket(s):              1
Core(s) per socket:     4
Thread(s) per core:     2
CPU(s):                 8
在实时系统和 getInfoDump 上
/proc/cpuinfo
echo " ";echo "Model Name: "$(cat /proc/cpuinfo|egrep 'model name'|head -1|awk '{for(i=4;i<=20;i++)printf "%s ",$i;print ""}');cat /proc/cpuinfo|egrep 'processor|physical id|siblings|core id|cpu cores'|sed "s/^processor/\n&/"
对于 getInfoDump,您必须更改 cpuinfo 文件位置,它位于 ...\getInfoDump\server\proc_cpuinfo.txt 下
/proc/cpuinfo 文件比 lscpu - 更全面。如需了解更多信息,请使用以下链接。
示例输出:
Model Name: Intel(R) Core(TM) i5-8350U CPU @ 1.70GHz

processor       : 0
physical id     : 0
siblings        : 8
core id         : 0
cpu cores       : 4

processor       : 1
physical id     : 0
siblings        : 8
core id         : 0
cpu cores       : 4

processor       : 2
physical id     : 0
siblings        : 8
core id         : 1
cpu cores       : 4

processor       : 3
physical id     : 0
siblings        : 8
core id         : 1
cpu cores       : 4

processor       : 4
physical id     : 0
siblings        : 8
core id         : 2
cpu cores       : 4

processor       : 5
physical id     : 0
siblings        : 8
core id         : 2
cpu cores       : 4

processor       : 6
physical id     : 0
siblings        : 8
core id         : 3
cpu cores       : 4

processor       : 7
physical id     : 0
siblings        : 8
core id         : 3
cpu cores       : 4
有关 PowerFlex 系统要求和建议,请参阅戴尔支持网站上的官方文档。
故障处理工具和提示
Linuxtop
此工具可显示用户、任务、CPU 负载和内存使用情况。
要退出 top 功能,请按键盘上的字母“q”。
一些标准命令开关:-i
Idle-processes
这会隐藏所有空闲进程,从而更轻松地对列表进行排序。
-n
Number-of-iterations
指定 top 在结束之前应产生的最大迭代次数或帧数。
-b
Batch-mode
在批处理模式下启动 top,这可用于将 top 的输出发送到其他程序或文件。
-n”开关选项设置迭代限制或者被终止。
运行 top 时其他一些有用的命令包括:M - 按内存用量对任务列表进行排序P - 按处理器用量对任务列表进行排序N - 按进程 ID 对任务列表进行排序T - 按运行时间对任务列表进行排序
mpstat
此工具属于名为 sysstat的软件包,它会显示 CPU 活动。系统显示每个处理器(或处理器核心)的使用情况。
%usr – % CPU usage at the user level.
%nice – % CPU usage for user processes labeled “nice”.
%sys – % CPU usage at the system (Linux kernel) level.
%iowait – % CPU usage idling waiting on a disk read/write.
%irq – % CPU usage handling hardware interrupts.
%soft – % CPU usage handing software interrupts.
%steal – % CPU usage being forced to wait for a hypervisor handling other virtual processors.
%guest – % CPU usage spent running a virtual processor.
%idle – % CPU usage on idle time (no processes, and not waiting on a disk read/write).
iostat
显示平均使用率的命令。系统会显示上次启动以来的平均 CPU 使用率。
sar
此工具管理系统资源。
常用命令开关:-u
此命令开关仅跟踪 CPU 性能
%user: Percentage of CPU utilization that occurred while executing at the user level (application).
%nice: Percentage of CPU utilization that occurred while executing at the user level with nice priority.
%system: Percentage of CPU utilization that occurred while executing at the system level (kernel).
%iowait: Percentage of time that the CPU or CPUs were idle during which the system had an outstanding disk I/O request.
%idle: Percentage of time that the CPU or CPUs were idle and the system did not have an outstanding disk I/O request.
以下命令显示 Linux 系统上 CPU 利用率前 10 位的用户:
ps -eo pcpu,pid,user,args | sort -k 1 -r | head -10
或者
ps -eo pcpu,pid,user,args | sort -r -k1 | less
Vmware在虚拟化环境中,尤其是常用的
在虚拟化环境中,尤其是常用的 VMware ESXi 中,系统资源的使用是分层的,有时过于全面而无法快速分析。
请遵循针对各种代码版本的此 VMware 知识库文章来排查 ESXi 主机/虚拟机性能问题:对 VMware 资源进行故障处理。
UI 和 CLI 均可用于对 CPU 和其他资源的性能进行故障处理。
用户界面:
vCenter Server 从所有连接的 ESXi 主机和虚拟机收集统计数据,并按配置的时间间隔汇总、计算和归档数据。
要访问数据,请启动 vSphere Client,选择您的虚拟机或主机,然后转至 Monitor > Performance > Overview,以获取 CPU、内存、磁盘和网络等主要指标的摘要。
转至 Advanced,然后使用右上角的 View 下拉菜单查看每个指标的更多详细信息。
CLI:esxtop
此工具可显示用户、任务、CPU 负载和内存使用情况。
登录到主机 SSH 会话(需要 root 权限)并键入 esxtop。启动 ESXTOP 时,默认情况下会获得 CPU 视图。
请参阅以下文章,以更全面地了解各种 esxtop 指标和屏幕:ESXTOP 说明。
请注意,对于虚拟机上的特定操作系统/应用程序性能,请遵循相应操作系统/应用程序的供应商提供的相关说明。
一些标准命令开关:-l
在大型环境中,由于必须收集的数据量和必须完成的计算,esxtop 可能具有较高的 CPU 利用率。
锁定特定实体并阻止 esxtop 收集详细信息,以限制所需的 CPU 运算能力。
-l”,它将不会显示在 esxtop 中,因为实体被锁定!
-u
此选项会阻止收集服务器的物理 CPU 统计信息,从而减少了需要存储的大量数据。
-n
Number-of-iterations
指定 esxtop 在结束之前应产生的最大迭代次数或帧数。
-b
Batch-mode
在批处理模式下启动 top,这可用于将 top 的输出发送到其他程序或文件。
-b”,它将不会显示在 esxtop 中,因为实体被锁定!此外,在此模式下,esxtop 将不接受输入并一直运行,除非使用“-n”开关选项设置迭代限制或者被终止。
Windows
在 Windows 环境中,CPU 和内存高使用率并不一定是必须要解决的问题。这因应用场景而异。
我们可以使用任务管理器来查看哪个应用程序/任务/服务导致资源使用率高。
由于 Windows 服务器可用于各种目的,运行多个服务。
请遵循此 Microsoft 知识库文章对各种服务的性能问题进行故障处理:Windows 服务器组件故障处理。
PowerShell
跨平台任务自动化和配置管理框架,由命令行 shell 和脚本语言组成
请参阅以下文章,更全面地了解如何使用 PowerShell 进行 CPU 故障处理:PowerShell CPU 故障处理。