ECS: Grafana Dashboard Percentile Representation Explained
Summary: Grafana dashboard percentile representation explained.
This article applies to
This article does not apply to
This article is not tied to any specific product.
Not all product versions are identified in this article.
Instructions
The purpose of this article is to provide a practical explanation of the p99 and p50 representation in latency dashboard.
Grafana dashboards are available on ECS since code level 3.4, which enables advanced monitoring for latency, errors, transactions, health, and other processes.
In the Data Access Performance - Overview tab, Latency statistics are seen, Value are presented for Read and Write latency as follows:
- Read time to first byte (p50)
- Read time to first byte (p99)
- Write time to the last byte (p50)
- Write time to the last byte (p99)
The above values are presented over a 5 minutes time sample like the below:
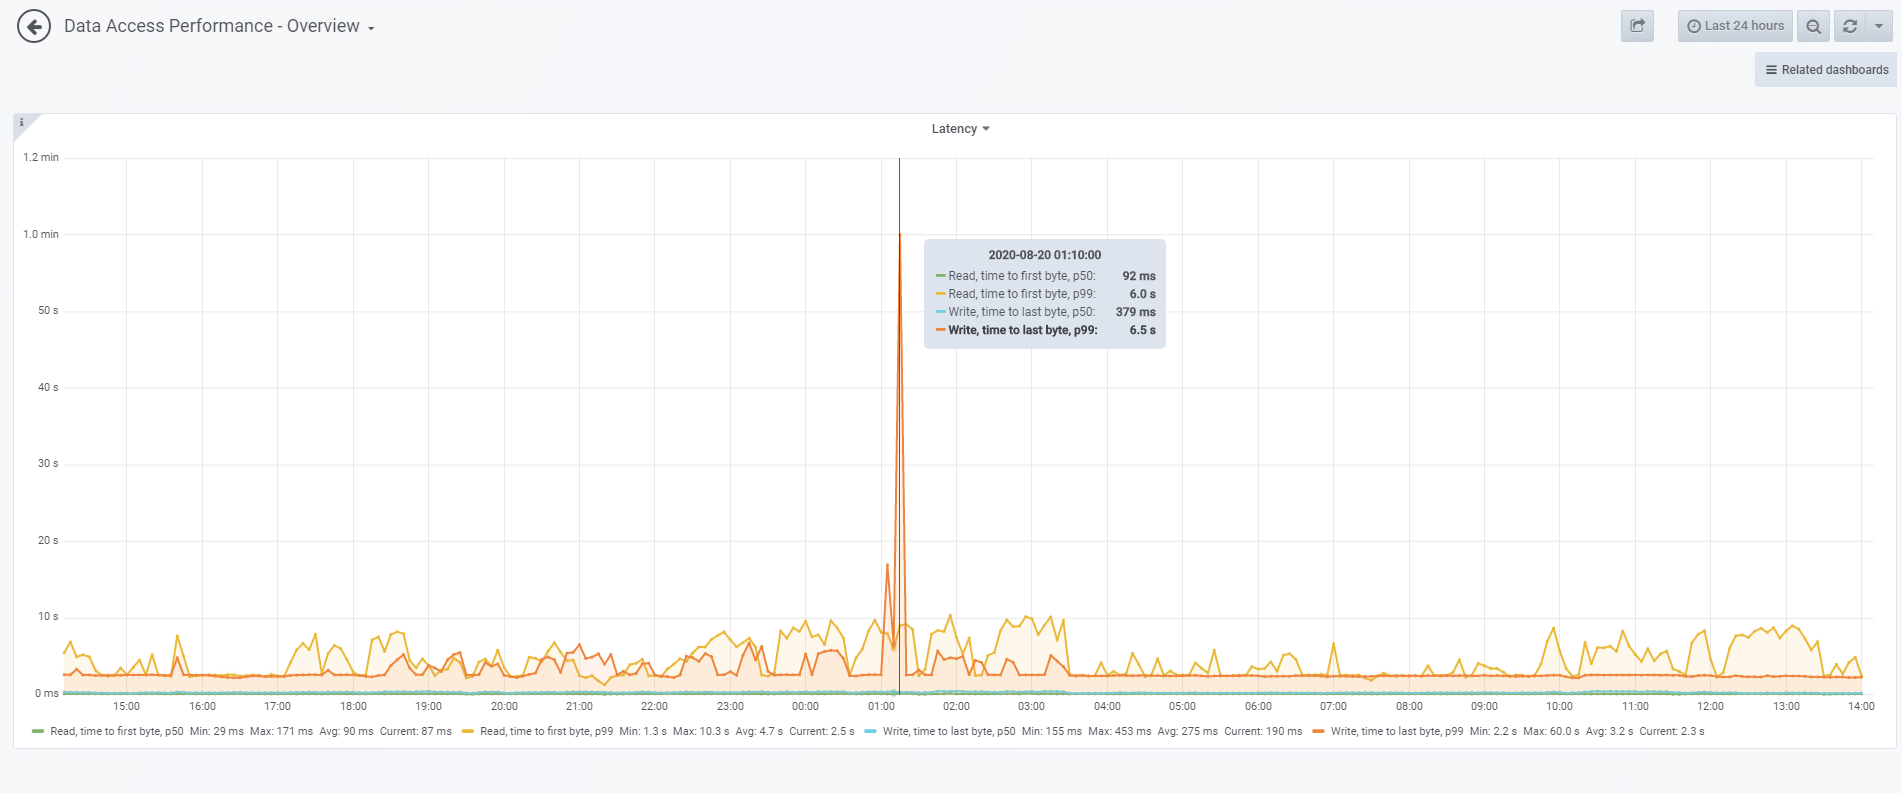
Taking the spike in the graph above as an example:
- Write time p99 was 6.5 s, this means that the 99th percentile of all values in this sample is 6.5 seconds. In other words, 99% of written requests were served in under 6.5 seconds within 5 minutes, while 1% took longer to complete.
- Similarly, p50, is the 50th percentile of the captured values. For write time p50, it means that 50% of all requests took 379 ms or less. And the other 50% was higher.
This representation differs from mean and averages.
Additional Information
See the ECS Monitoring guide for your code version.
Affected Products
ECS ApplianceProducts
ECS Appliance, Elastic Cloud StorageArticle Properties
Article Number: 000021869
Article Type: How To
Last Modified: 25 Jun 2025
Version: 6
Find answers to your questions from other Dell users
Support Services
Check if your device is covered by Support Services.