The Performance study with Cascade Lake for Genomics Applications
Summary: HPC High Performance Computing, HPC & AI Innovation Lab, Genomics, Variant Calling, De Novo Assembly, Next Generation Sequencing, BWA-GATK, SOAPdenovo2, SPAdes, Cascade Lake
Symptoms
Article written by Kihoon Yoon of HPC and AI Innovation Lab in May 2019
Cause
None
Resolution
Variant calling and De novo assembly
Overview
Second Generation Intel® Xeon® Scalable processors is a successor to Skylake and offers up to 56 cores with a single processor (Cascade Lake AP 9282). In addition to Intel offering more cores, there’s Optane support, faster DRAM (DDR4-2933 in 1 DPC configuration), and more DRAM configurations (1TB, 2TB, and 4TB). It is clear that consumers are generally expecting more performance, better efficiency, and lower power from a newer processor. However, some customers look for the improvements which are not so obvious such as support for new instructions, layered ecosystem optimizations, support for new technology, or a new product direction. Cascade Lake builds on a foundation of Skylake focusing on the secondary characteristics, and the improvements are not so obvious.
Typically, applications in Next Generation Sequencing (NGS) data analysis are open-source and will not be updated as fast as the new technology emerges. This means that the improvements coming with Cascade Lake are less likely to impact the performances of NGS applications.
This blog illustrates how Cascade Lake CPUs behave on two different genomics workloads, Variant Calling and De Novo assembly.
The detailed test configurations for variant calling and De Novo assembly are listed in Table 1.
Table 1 Test configuration for variant calling and De Novo assembly
|
|
Dell PowerEdge R640 |
Dell PowerEdge R940 |
|||||||
|
Skylake |
Cascade Lake |
Skylake |
Cascade Lake |
||||||
|
CPU |
2x 6154 |
2x 6148 |
2x 6152 |
2x 6138 |
2x 6248 |
2x 6252 |
2x 6230 |
4x 8168 |
4x 8280M |
|
Base Frequency (GHz) |
3.0 |
2.4 |
2.1 |
2.0 |
2.5 |
2.1 |
2.1 |
2.7 |
2.7 |
|
Number of Cores |
18 |
20 |
22 |
20 |
20 |
24 |
20 |
24 |
28 |
|
TDP (W) |
200 |
150 |
140 |
140 |
150 |
125 |
125 |
205 |
205 |
|
Memory |
24x 16GB DDR4-2666MHz, 2 DPC |
12x 32GB DDR4-2933MHz, 1 DPC |
48x 32GB DDR4-2666MHz, 2 DPC |
24x 64GB DDR4-2933MHz, 1 DPC |
|||||
|
Storage |
10x 1.2TB SAS 12 Gbps, 10K in RAID 0 |
18x 1.2TB SAS 12 Gbps, 10K in RAID 0 |
|||||||
|
System Bios |
2.1.3 |
||||||||
|
Kernel |
3.10.0-957.el7.x86_64 |
||||||||
|
OS |
Red Hat Enterprise Linux Server release 7.6 (Maipo) |
||||||||
|
Sequence Reads |
ERR194161, 50x Whole Human Genome for Variant Calling and ERR318658, 3.2 Billion Reads of Whole Human Genome for De Novo Assembly |
||||||||
Variant Calling
BWA-GATK Pipeline
As shown in Figure 1, each step behaves quite differently on each CPU that was tested, and the performance differences among different steps with the tested CPUs ranges from 0.61% to 46.34%. However, the differences in overall runtime are not quite notable (Table 2).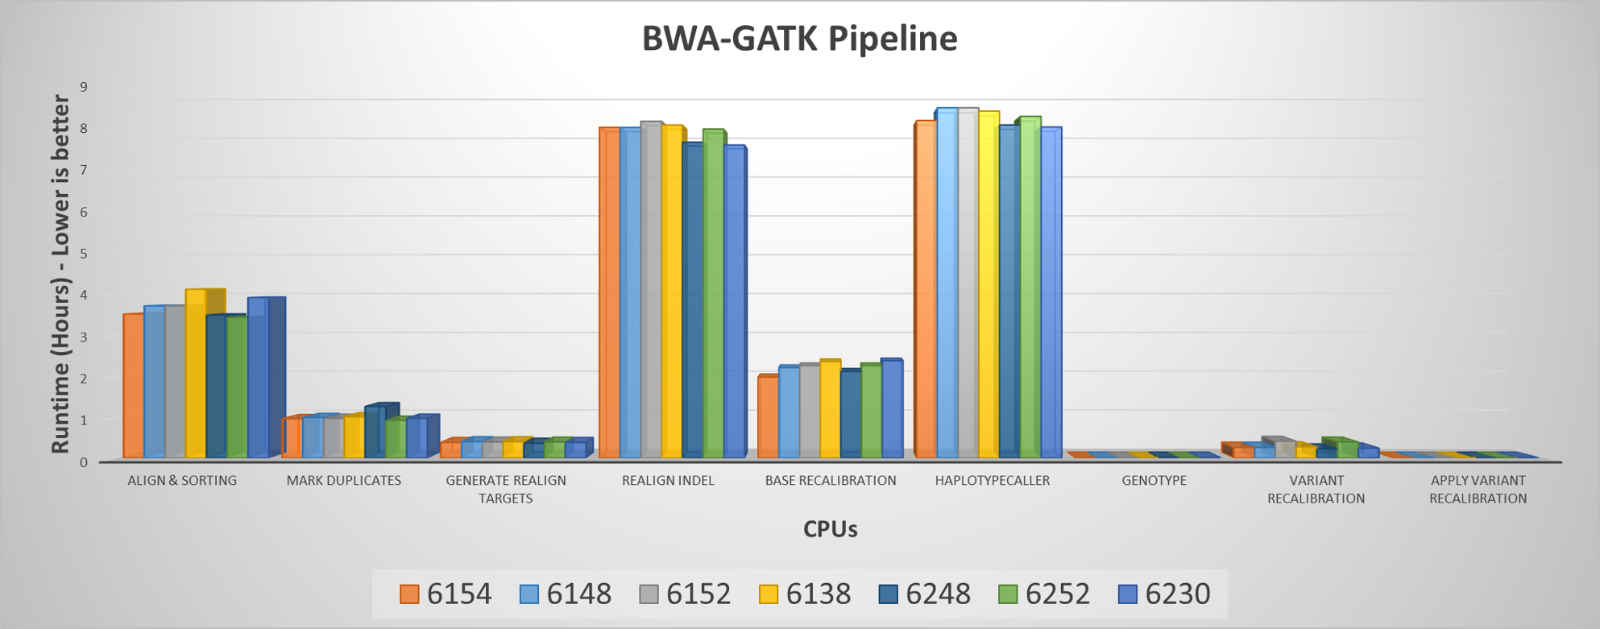
Figure 1 Runtimes of each step in Variant Calling pipeline
Cascade Lake 6248 outperformed in most steps and in the best overall runtime, but it performed poorly at the "Mark Duplicates" step, running 27% slower than Cascade Lake 6252. It is unclear that why 6248 performs poorly for this step although repeated tests show consistent results. With this inconsistent behavior over the different steps, considering overall performance makes better sense when selecting a proper CPU for the workflow.
Table 2 Total runtime comparisons among Skylake vs Cascade Lake CPUs
|
CPU |
Price |
Spec |
Total BWA-GATK Runtime (hours) |
|
|
Skylake |
6148 |
$3,072.00 - $3078.00 |
2.4 GHz, 20 cores, 150W |
24.26 |
|
6154 |
$3,543.00 |
3.0 GHz, 18 cores, 200W |
23.47 |
|
|
6152 |
$3,655.00 - $3661.00 |
2.1 GHz, 22 cores, 140W |
24.58 |
|
|
6138 |
$2,612.00 - $2618.00 |
2.0 GHz, 20 cores, 125W |
24.83 |
|
|
Cascade Lake |
6248 |
$3,072.00 - $3,078.00 |
2.5 GHz, 20 cores, 150W |
23.36 |
|
6252 |
$3,655.00 - $3,662.00 |
2.1 GHz, 24 cores, 150W |
23.82 |
|
|
6230 |
$1,894.00 - $1,900.00 |
2.1 GHz, 20 cores, 125W |
23.68 |
|
Although the best overall performance can be achieved with Cascade Lake 6248, Cascade Lake 6230 is not a bad choice for customers with limited power. Since the results shown here are based on a single sample test, it is hard to conclude if Cascade Lake 6230 and 6248 are better than Cascade Lake 6252 without the results of throughput tests. However, in consideration of throughput, Cascade Lake 6252 could outperform on throughput tests due to the higher core counts. It can accommodate more samples to process simultaneously. Nonetheless, Cascade Lake 6230 could be the most cost-effective choice among the tested CPUs.
De Novo Assembly
For De Novo Assembly, Skylake 8168 and Cascade Lake 8280M are compared with the same amount of system memory, 1.5TB in R940. The main reason Cascade Lake 8280M was chosen is for higher its core counts and because it supports more memory which is beneficial be the data size for De Novo assembly continues to grow larger over the time.
SOAPdenovo2
The maximum performance gain by upgrading from Skylake 8168 to Cascade Lake 8280M is roughly 1% as shown in 92 cores of Skylake 8168 versus 108 cores of Cascade Lake 8280M comparisons from Figure 2. For the test, one core per CPU was n left for OS and other housekeeping use. Although the results show that Cascade Lake 8280M is slower by 2% on average with various number of cores used, the comparisons between 92 cores of 8168 and 108 cores of 8280M confirmed that Cascade Lake 8280M performs slightly better than Skylake 8168.
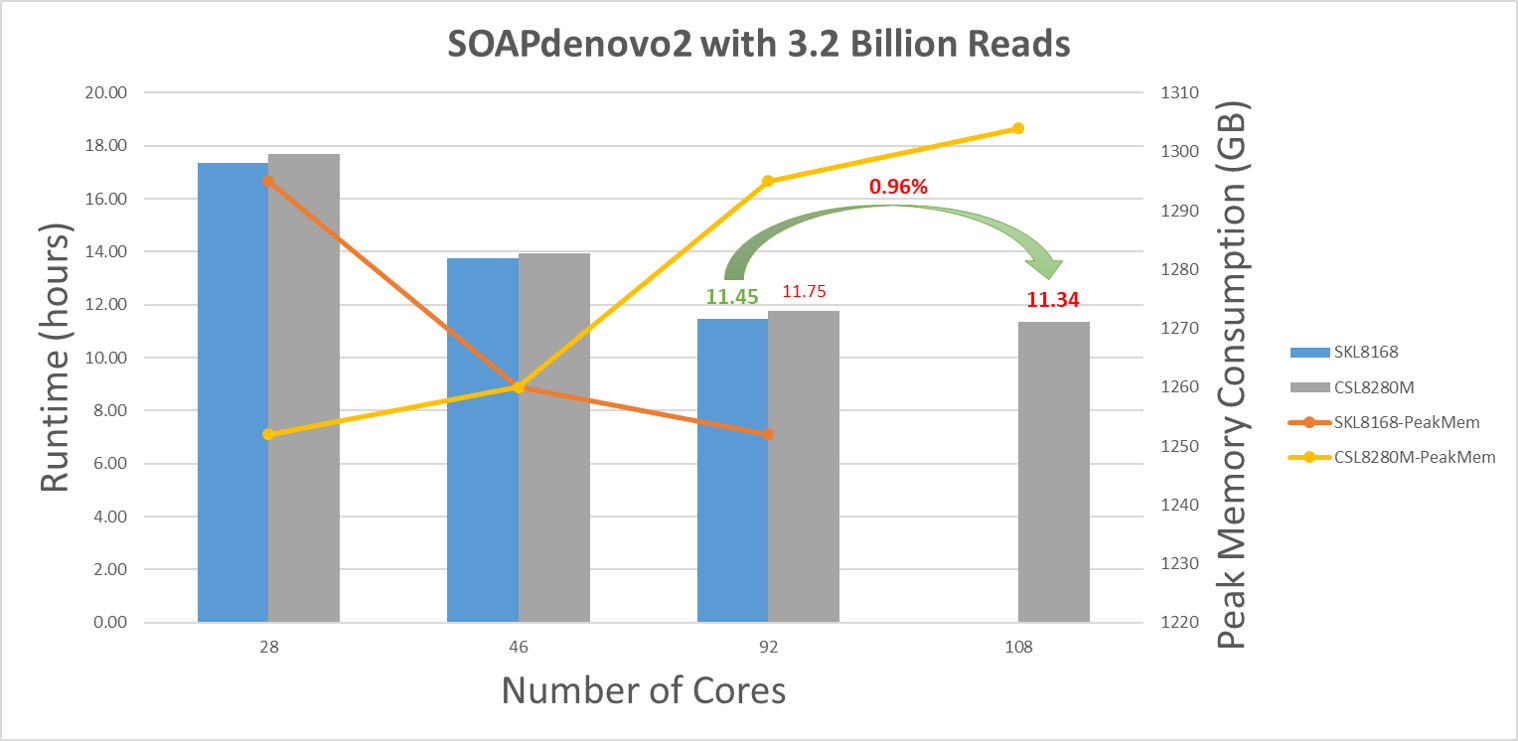
Figure 2 Runtimes and peak memory consumption plots for SOAPdenovo2 with various number of cores
SOAPdenovo2 seems to be memory bandwidth bounded. The peak memory consumption is constantly rising as more cores are used for a process with 1 DPC configuration on Cascade Lake CPU while the peak memory consumption is declining with 2 DPC configuration on Skylake CPU. As shown Figure 3 in our previously published blog, memory bandwidth can differ by 11% between 1 DPC and 2 DPC configuration with the same type of dual ranked DIMMs. To make a better conclusion, further tests are required with 2 DPC configuration (DDR4-2666) on Cascade Lake 8280M CPU.
SPAdes
Cascade 8280M performs better across the tests with various number of cores, and 5% better performance is achievable in CPU vs CPU comparison (comparison between 92-core 8168 and 108-core 8280M) as shown in Figure 3. The patterns of peak memory consumption are nearly similar between two CPUs; however, Cascade Lake 8280M with 1 DPC configuration shows higher memory consumptions than Skylake 8168 with 2 DPC configuration. Although memory bandwidth does not seem to be as critical as we can see from SOAPdenovo2 tests, 2 DPC configuration with DDR4-2666MHz can be a better configuration for De Novo Assembly.
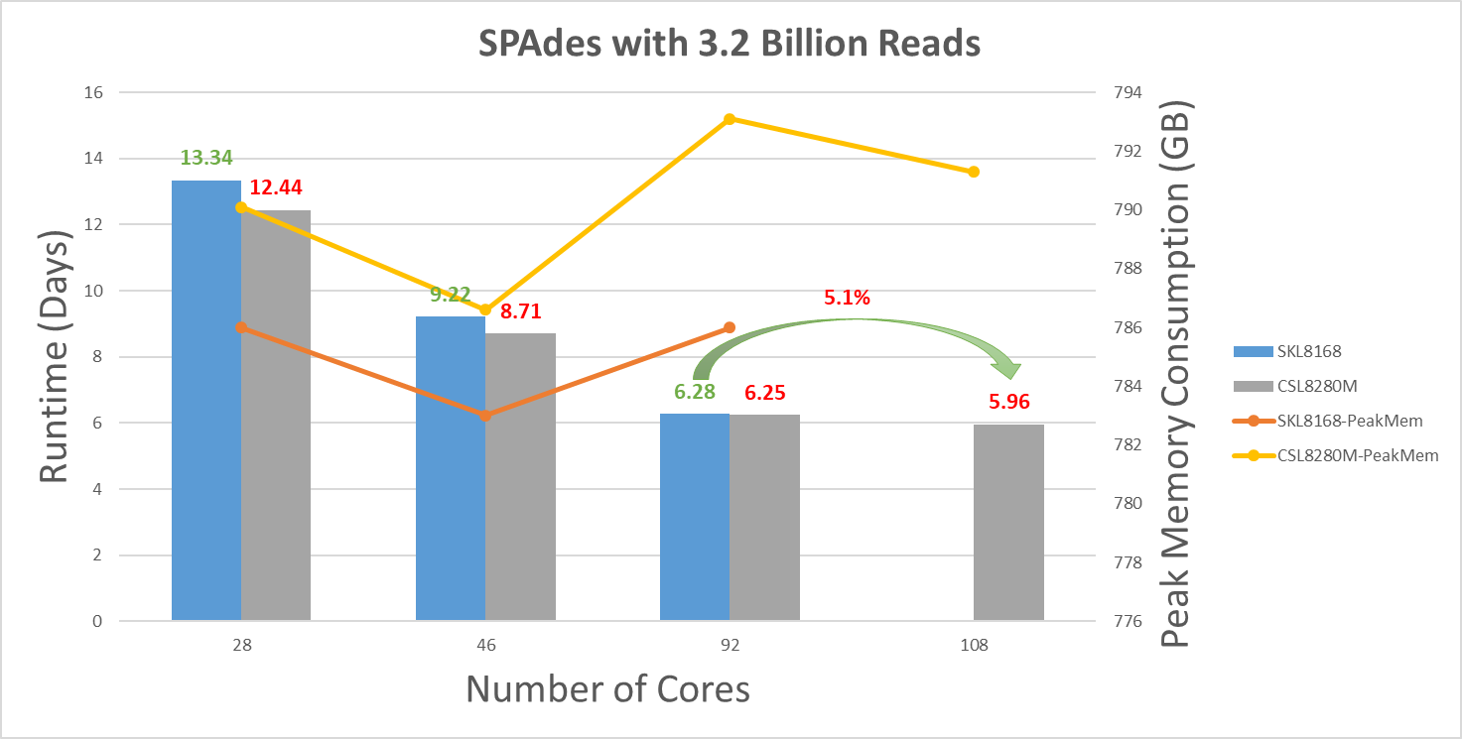
Figure 3 Runtimes and peak memory consumption plots for SPAdes with various number of cores
Conclusion
Overall, Cascade Lake CPUs tested here do not perform superior over Skylake CPUs for Genomics workloads such as Variant Calling and De Novo Assembly. Similar performance was somewhat expected since the Cascade Lake CPU is based on the Skylake CPU and aims to improve supportive functionality rather than improving pure performance. However, Cascade Lake provides more choices compared to Skylake in terms of lower TDP and higher core count for Variant Calling kinds of workloads. It is notable that 1 DPC configuration with DDR4 2933 MHz DIMMS does not improve performance for SOAPdenovo2. For De Novo Assembly applications, larger memory bandwidth seems to be better. There is no benefit from upgrading memory to DDR4 2933MHz in 1 DPC configuration for Cascade Lake CPUs. It is recommended to setup 2 DPC configuration with DDR4 2666MHz, especially for De Novo assembly applications.