How to Analyze Blue Screen Dump Files Using WinDbg
Summary: Learn how to use WinDbg to read Windows minidump files after a blue screen error (BSOD). Step-by-step instructions to analyze crash dumps, identify faulty drivers, and resolve blue screen errors on Dell computers running Windows. ...
Instructions
Overview
A blue screen error (also called a Blue Screen of Death or BSOD) happens when Windows runs into a critical problem and shuts down to protect your computer. When this occurs, Windows creates a small file called a minidump that records what was happening at the moment of the crash.
This article walks you through how to use Windows Debugger (WinDbg), a free tool from Microsoft, to open and read these minidump files. More importantly, it helps you understand what the results mean and what steps to take to fix the problem.
What you'll learn:
- How to set up your computer to save minidump files.
- How to install and use WinDbg to analyze a crash dump file.
- How to read the analysis results and identify the cause.
- How to use those results to troubleshoot and resolve the blue screen error.
- How to use Driver Verifier to find problem drivers.
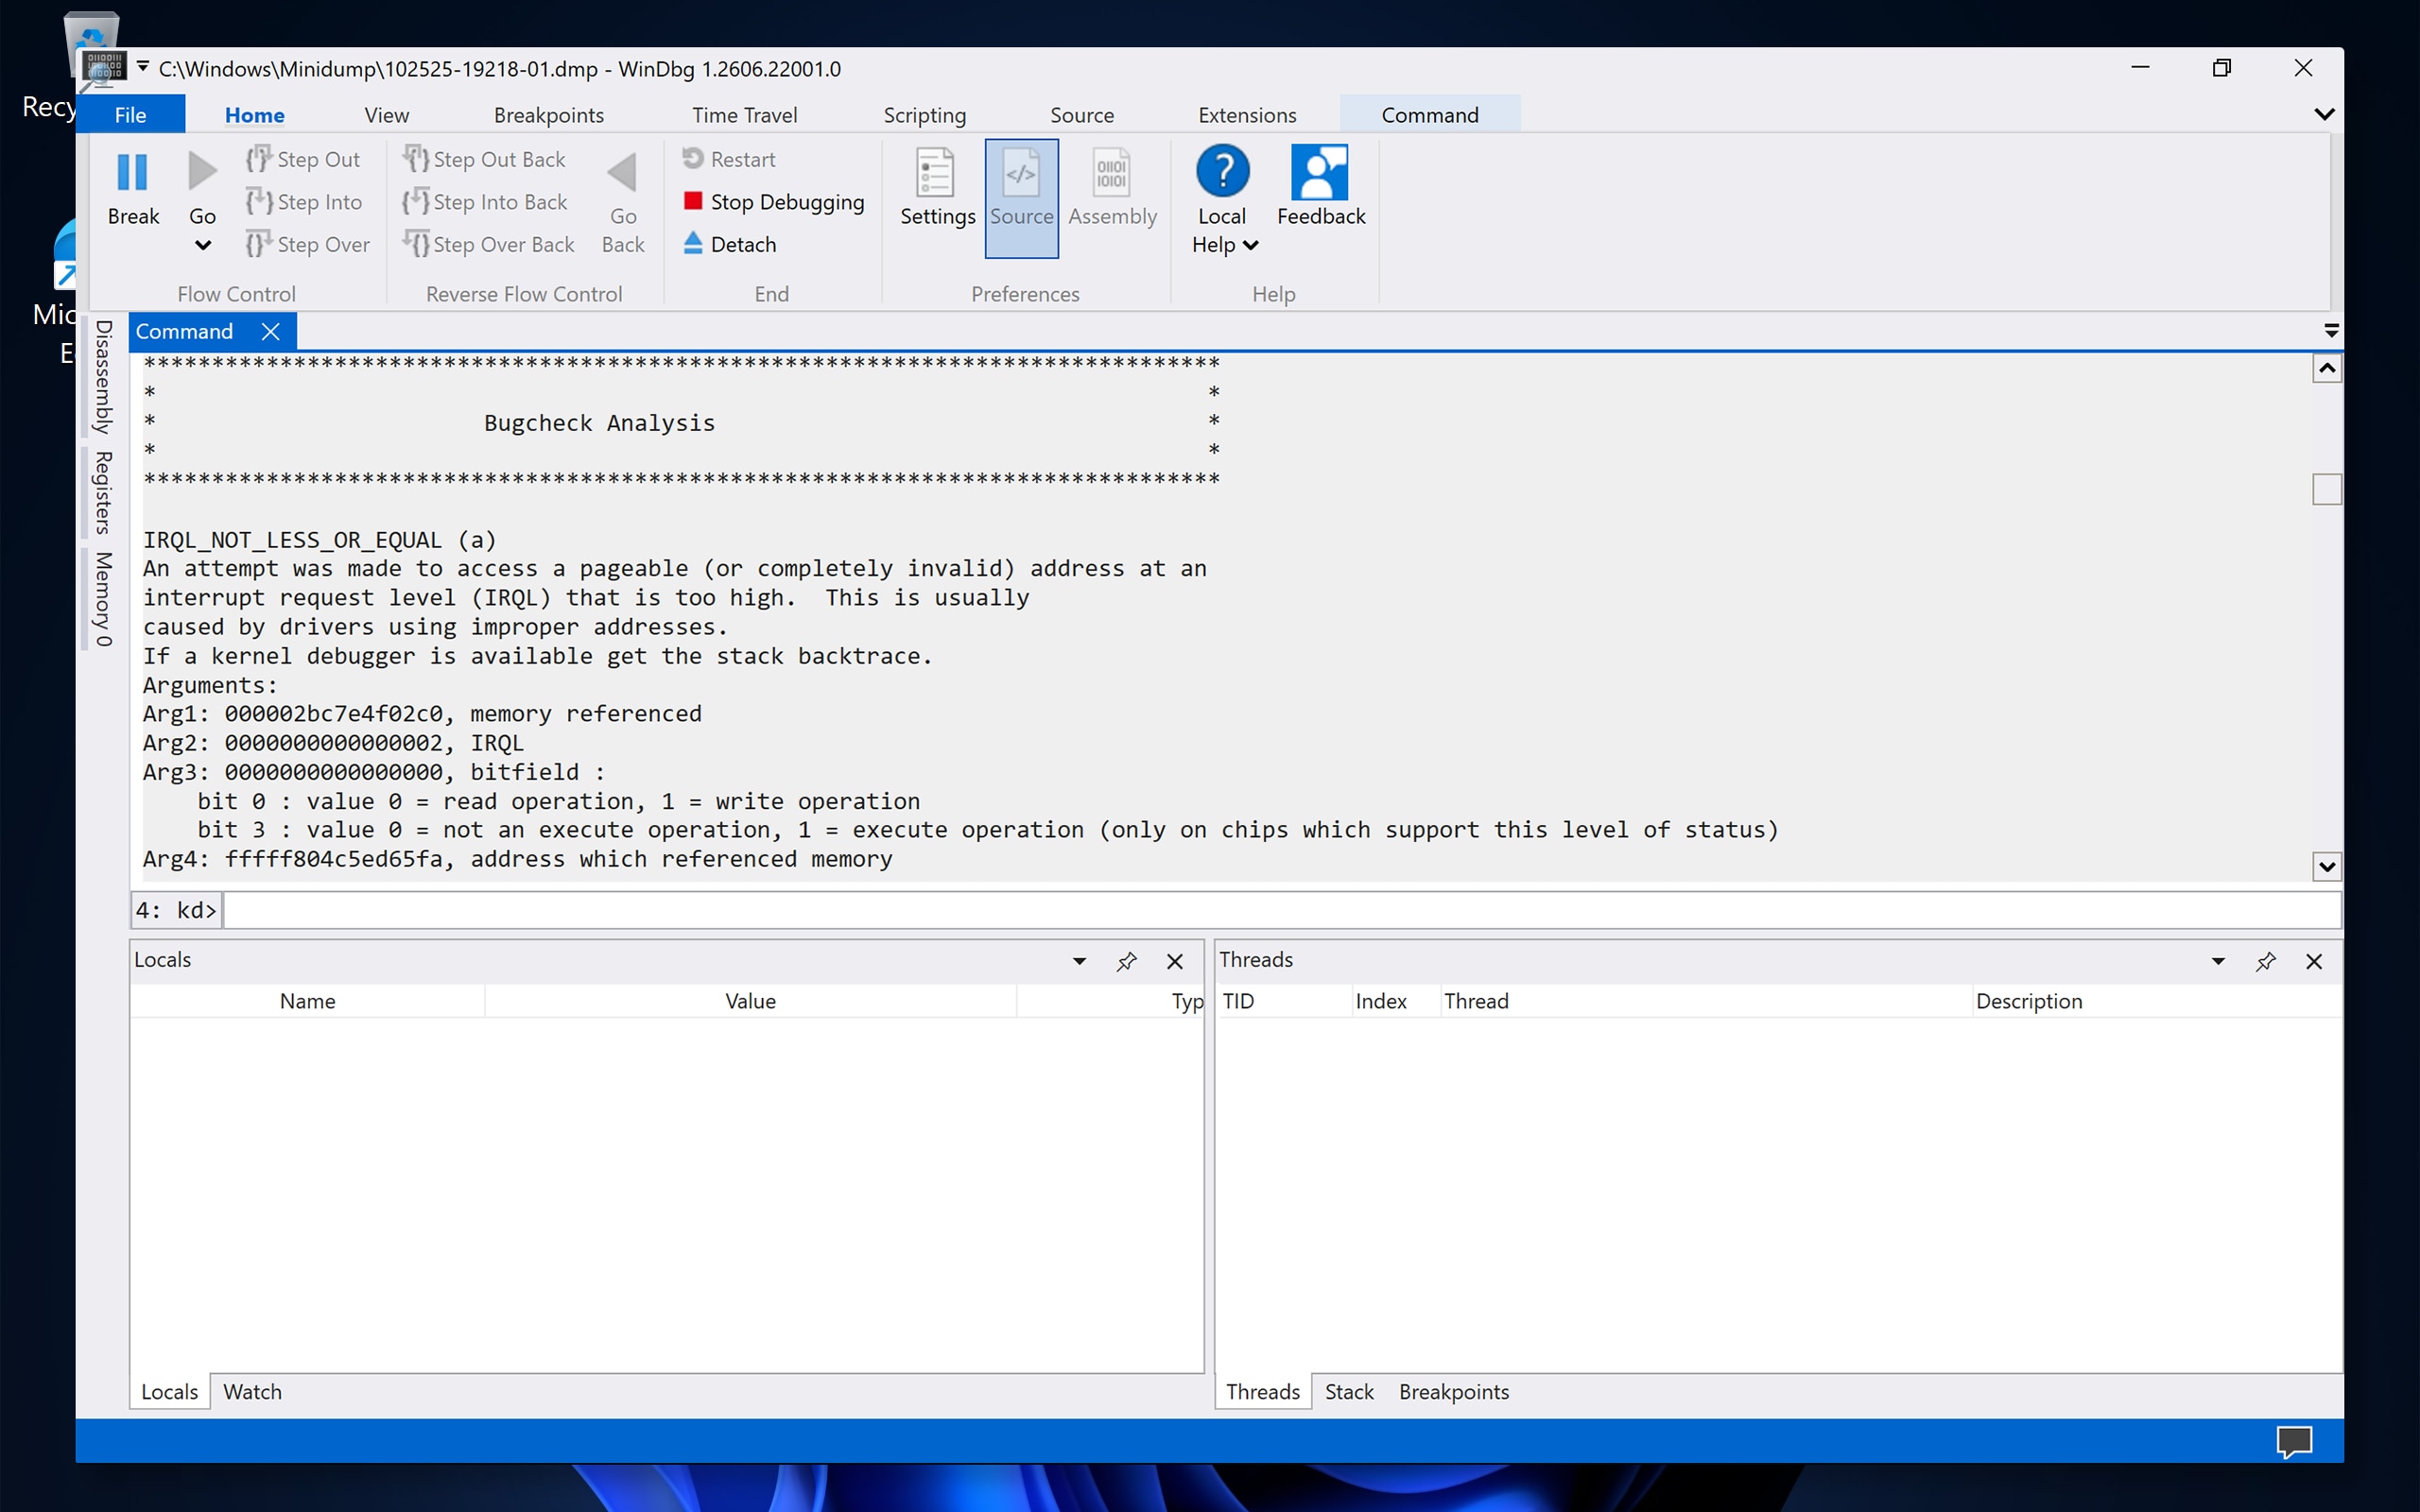
What Is a Minidump File?
When a blue screen error occurs, Windows saves a small memory dump file (also called a minidump) with the file extension .dmp. This file captures a snapshot of your computer's state at the time of the crash. Despite its small size (typically 256 KB), a minidump contains valuable information, including:
- Stop code — The specific error code that identifies the type of crash (for example, DRIVER_IRQL_NOT_LESS_OR_EQUAL).
- Parameters — Additional values associated with the stop code.
- Loaded drivers — A list of all drivers that were running when the crash happened.
- Faulting module — The specific file (driver, system file, or application) that caused or contributed to the crash.
- Kernel-mode call stack — A technical record showing the sequence of events that led to the crash.
- Processor and thread context — Details about the processor and process that were active at the time.
This information helps narrow down whether the crash was caused by a driver, a Windows system file, a hardware fault, or a software conflict.
What Causes Blue Screen Errors?
Blue screen errors can have many causes. The most common include:
|
Category |
Common causes |
|---|---|
|
Driver issues |
Outdated, corrupt, or incompatible drivers (approximately 70–80% of BSODs are driver-related). |
|
Software conflicts |
Incompatible programs, recent Windows updates, or corrupt system files. |
|
System file corruption |
Damaged Windows system files due to improper shutdowns, malware, or disk errors. |
|
Overclocking |
Unstable CPU, GPU, or RAM overclocking settings. |
|
Hardware problems |
Failing RAM, overheating, hard drive errors, or faulty hardware components. |
Before You Begin: Verify That Minidump Files Are Being Saved
Before you can analyze a crash dump, your computer must be set up to create and save minidump files. Follow these steps to verify this setting:
- Select Start, type SystemPropertiesAdvanced, and then press Enter.
- In the System Properties window, under the Startup and Recovery section, select Settings.
- Under Write debugging information, verify that Small memory dump (256 KB) or Automatic memory dump is selected.
- Verify that the Small dump directory is set to %SystemRoot%\Minidump.
- Select OK, and then select OK again to close System Properties.
Step 1: Install WinDbg
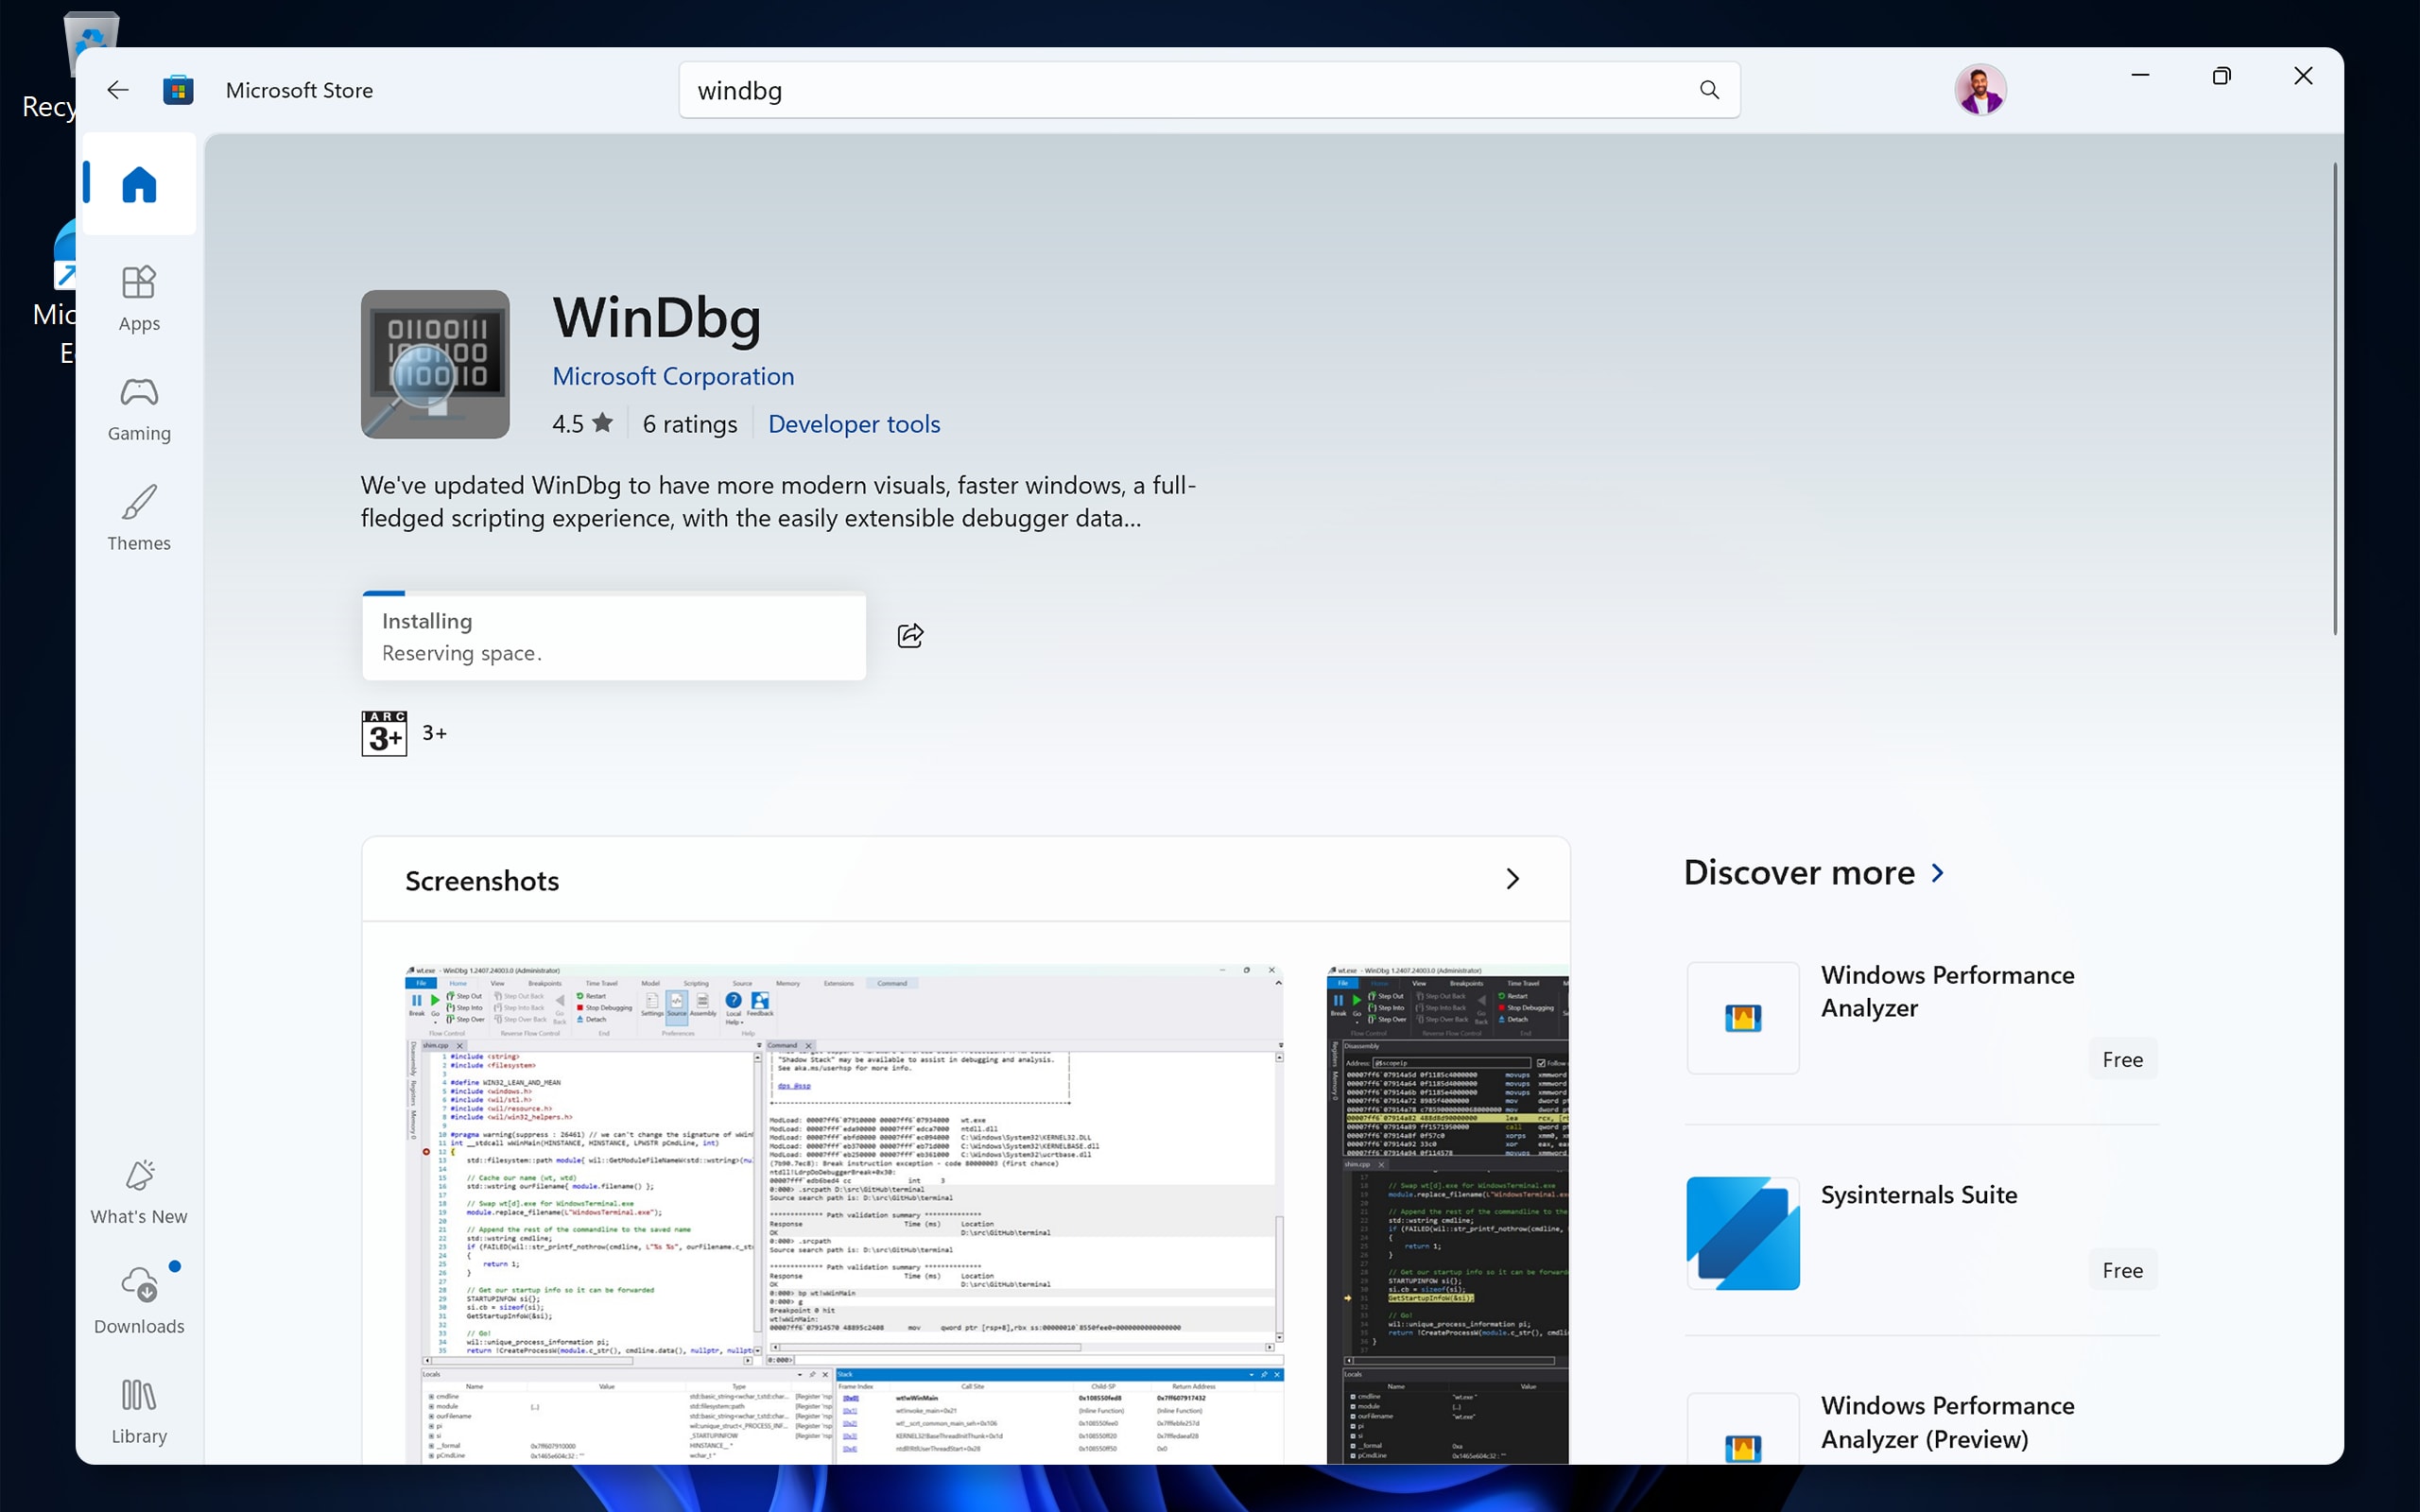
WinDbg (Windows Debugger) is a free tool from Microsoft that lets you open and analyze minidump files. Follow these steps to download and install it:
- Select Start and open the Microsoft Store.
- In the search bar, type WinDbg and then press Enter.
- Select WinDbg (formerly called WinDbg Preview) from the search results, and then select Get or Install.
- Wait for the installation to complete.
Step 2: Set Up the Symbol Path
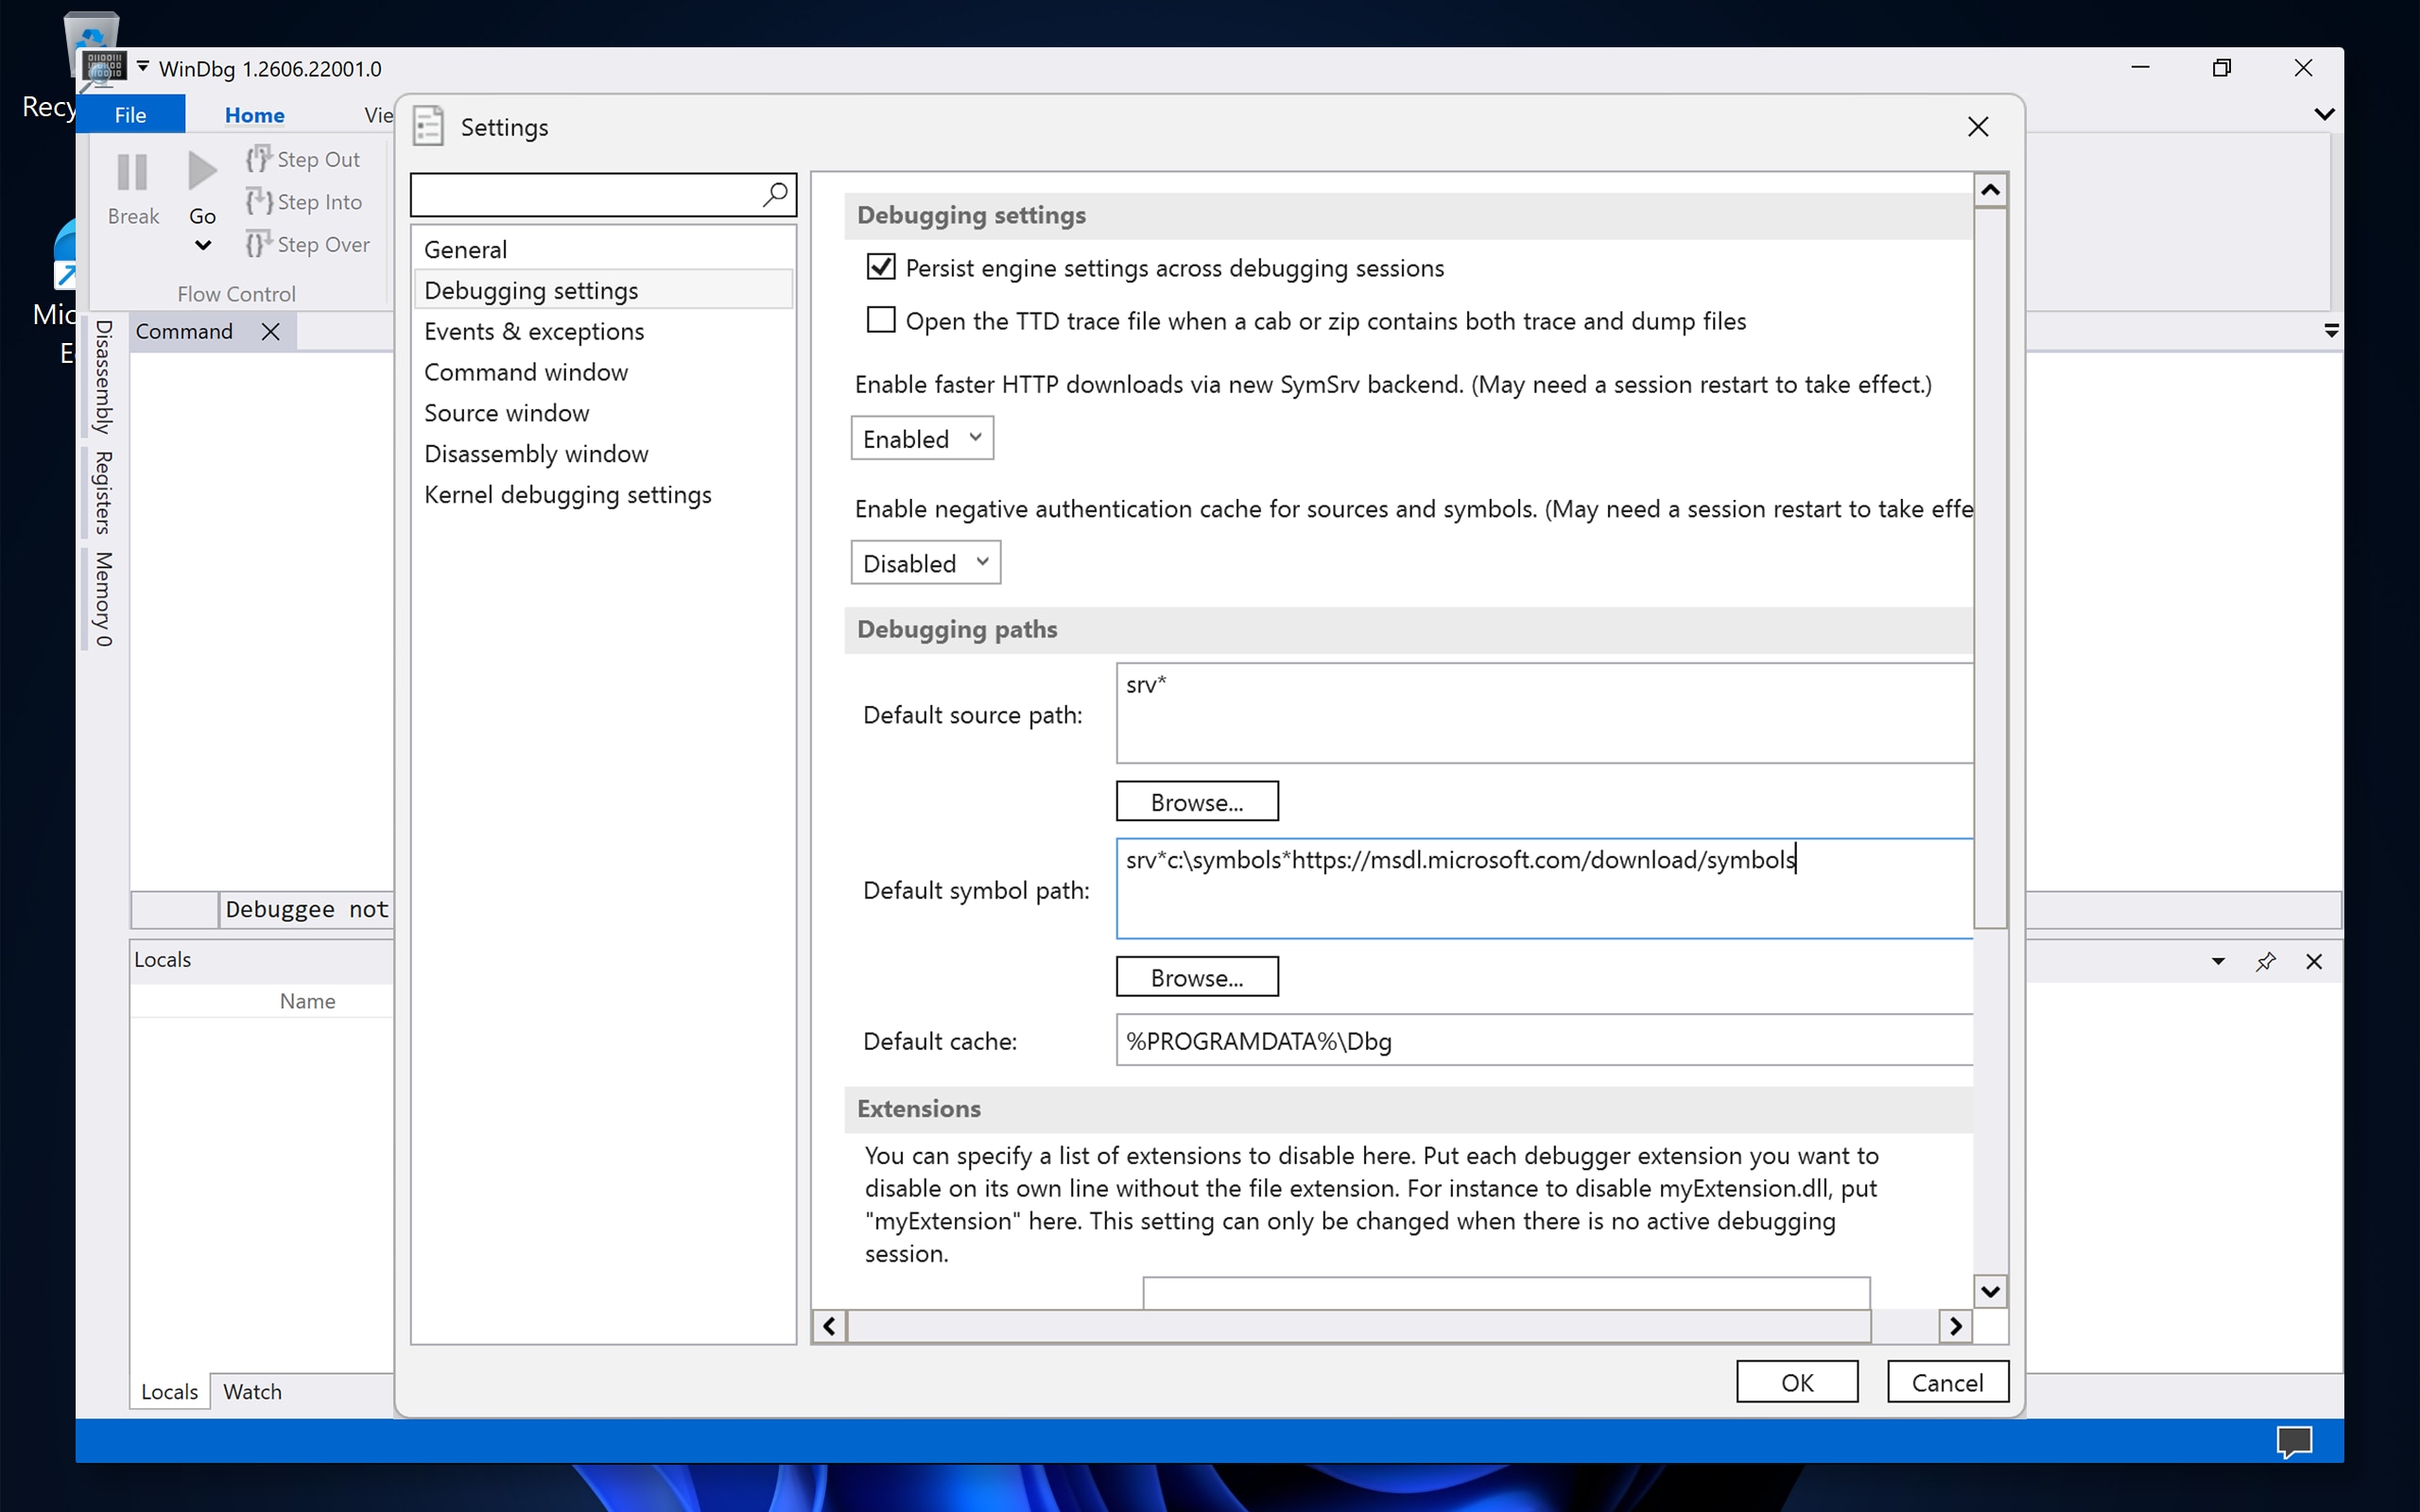
Symbols are files that help WinDbg translate raw crash data into readable information, like function names and driver names. Without symbols, the analysis results may be incomplete or hard to interpret. Follow these steps to configure the symbol path:
- Select Start, type WinDbg, and then select WinDbg to open the app.
- Select File, and then select Settings.
- Select Debugging settings.
- In the Default symbol path field, type the following path exactly as shown: srv*C:\Symbols*https://msdl.microsoft.com/download/symbols
- Select OK.
What does this path mean?
- srv* tells WinDbg to download symbols from a server.
- C:\Symbols is a local folder on your computer where downloaded symbols are saved (cached) for faster future use. WinDbg creates this folder automatically.
- The URL points to Microsoft's public symbol server.
Step 3: Open and Analyze a Dump File
With WinDbg installed and the symbol path configured, follow these steps to analyze a minidump file:
- In WinDbg, select File, and then select Open dump file.
- Browse to the folder where your minidump files are saved. The default locations are:
- Windows crash dumps: C:\Windows\Minidump\
- Application crash dumps: C:\Users\YourUsername\AppData\Local\CrashDumps\
- Select the .dmp file you want to analyze, and then select Open.
Tip: If you have multiple dump files, select the most recent one first. The file name typically includes the date of the crash (for example, 010125-12345-01.dmp).
- Wait for WinDbg to load the dump file. You'll see text scrolling in the command window.
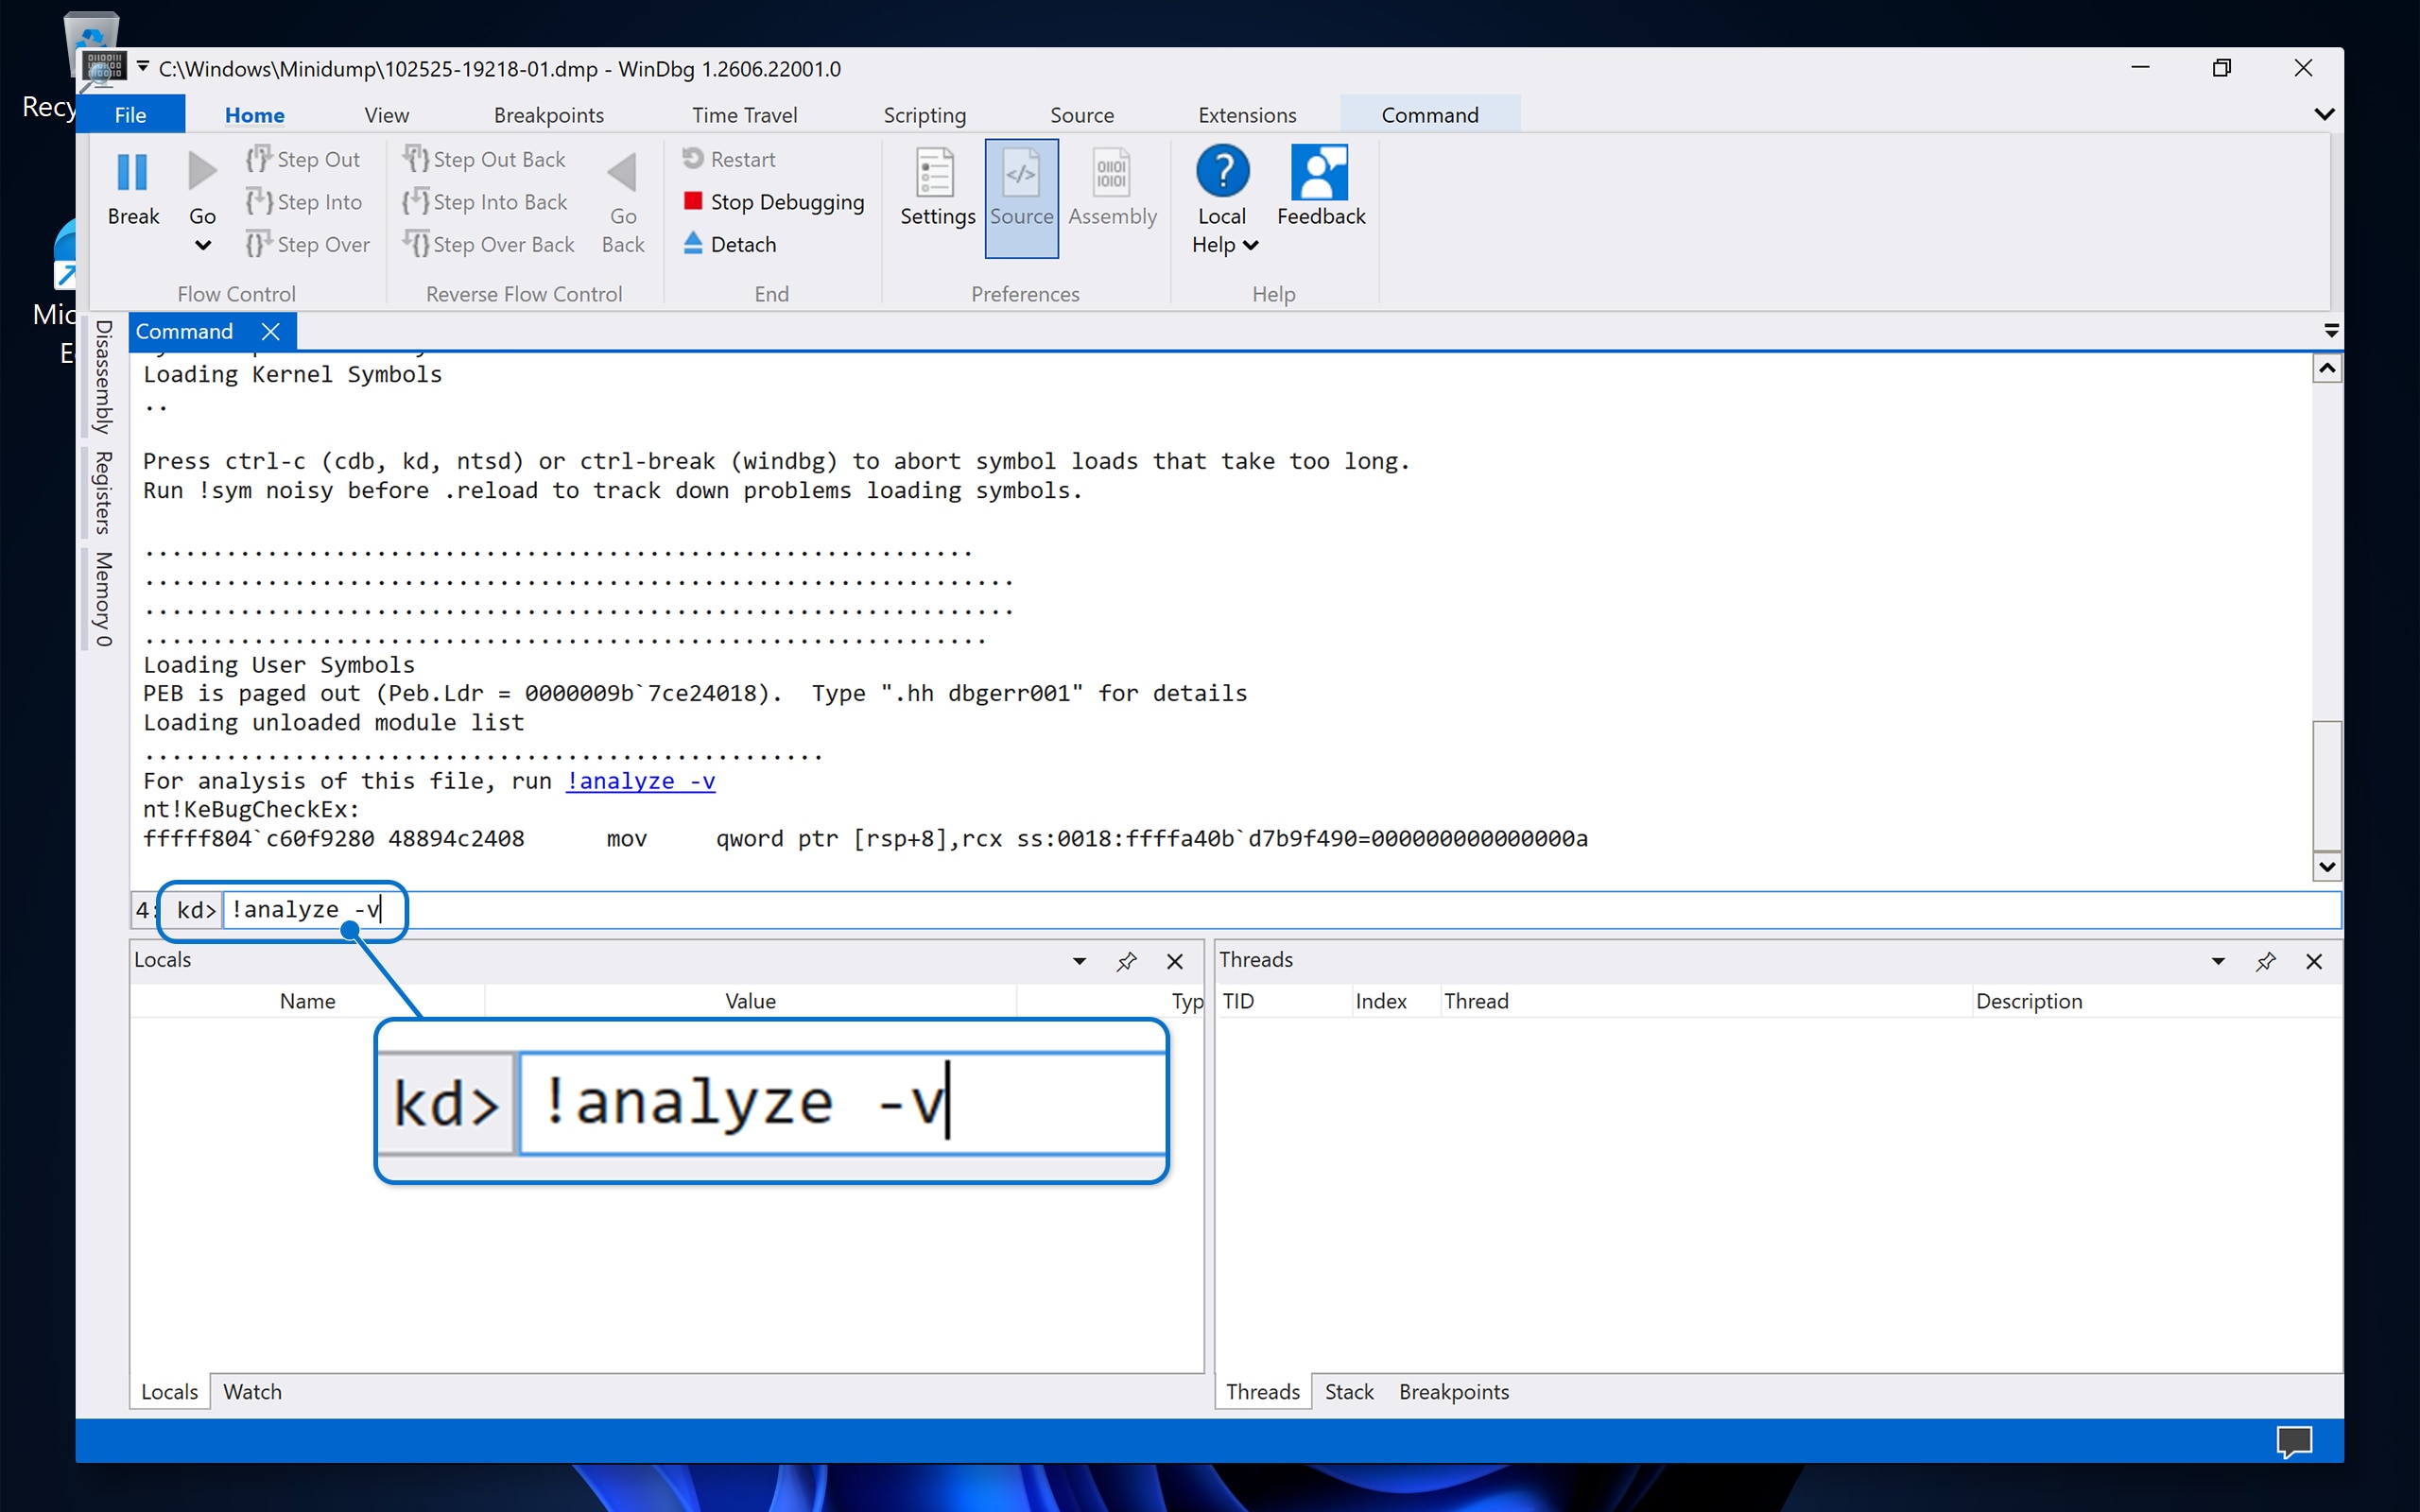
- In the command window at the bottom, type the following command and then press Enter:
!analyze -v - Wait for the analysis to complete. This may take a few minutes while WinDbg downloads the necessary symbols and processes the data.
Step 4: Read and Understand the Analysis Results
After the !analyze -v command finishes, WinDbg displays a detailed report. Here are the most important fields to look for and what they mean:
Key fields in the analysis report
|
Field |
What it tells you |
Example |
|---|---|---|
|
BugCheck (or STOP code) |
The specific error code for the crash. |
0x000000D1 (DRIVER_IRQL_NOT_LESS_OR_EQUAL) |
|
SYMBOL_NAME |
The specific function or routine that was running when the crash occurred. |
nvlddmkm+1a2b3c |
|
MODULE_NAME |
The name of the driver or system module that caused or was involved in the crash. |
nvlddmkm |
|
IMAGE_NAME |
The file name of the module. |
nvlddmkm.sys |
|
FAILURE_BUCKET_ID |
A unique identifier that groups similar crashes together. |
0xD1_nvlddmkm+1a2b3c |
|
PROCESS_NAME |
The process (program) that was active when the crash happened. |
chrome.exe |
|
DEFAULT_BUCKET_ID |
A general category for the type of crash. |
DRIVER_FAULT |
How to interpret the results
- If MODULE_NAME or IMAGE_NAME shows a .sys file — The crash was likely caused by a driver. The file name helps identify which hardware component or software is involved.
- If the module is ntoskrnl.exe — This is the Windows kernel. It does not necessarily mean Windows itself is the problem. It often indicates that another driver corrupted memory, and the kernel detected the issue. Look at the full call stack for additional clues.
- If the module is win32kfull.sys or win32kbase.sys — These are Windows graphics-related system files. The issue might be related to your display driver or a graphics application.
Common driver file names and their associated components
|
Driver file name |
Associated component |
|---|---|
|
nvlddmkm.sys |
NVIDIA graphics driver |
|
atikmdag.sys or atikmpag.sys |
AMD/ATI graphics driver |
|
igdkmd64.sys |
Intel graphics driver |
|
Netwtw10.sys or Netwtw08.sys |
Intel Wi-Fi driver |
|
USBXHCI.SYS |
USB 3.0 host controller driver |
|
storport.sys or stornvme.sys |
Storage driver |
|
tcpip.sys |
Network (TCP/IP) driver |
|
dxgkrnl.sys |
DirectX graphics kernel |
|
ntfs.sys |
NTFS file system driver |
|
fltMgr.sys |
File system filter manager |
|
Classpnp.sys |
SCSI class driver (often related to storage) |
Tip: If you are not sure what a driver file belongs to, search for the file name online to find more information.
Step 5: Troubleshoot and Resolve the Blue Screen Error
After identifying the faulting driver or module through your dump file analysis, follow the steps below to resolve the issue.
If the crash was caused by a driver (.sys file)
- Update the driver — Go to Dell Drivers & Downloads and download the latest driver for your specific Dell computer model. If the driver is for a third-party component (for example, printer, webcam, and so on), visit the manufacturer's website for the latest version.
- Roll back the driver — If the issue started after a recent driver update:
- Select Start, type Device Manager, and then press Enter.
- Expand the category for the device (for example, Display adapters).
- Right-click the device, and then select Properties.
- Select the Driver tab, and then select Roll Back Driver (if available).
- Reinstall the driver — Uninstall the driver in Device Manager, restart your computer, and then install a fresh copy.
If the crash points to ntoskrnl.exe or a Windows system file
- Run the System File Checker (SFC):
- Select Start, type CMD.
- Right-click Command Prompt, and then select Run as administrator.
- Type the following command and then press Enter:
sfc /scannow - Wait for the scan to finish and follow any instructions shown.
- Run the DISM tool (if SFC finds issues it cannot fix):
- In the same administrator Command Prompt, type the following command and then press Enter:
DISM /Online /Cleanup-Image /RestoreHealth - Wait for the process to complete, and then run
sfc /scannowagain.
- In the same administrator Command Prompt, type the following command and then press Enter:
- Check for Windows updates:
- Select Start > Settings > Windows Update.
- Select Check for updates and install any available updates.
If you suspect a hardware issue
Blue screen errors can also be caused by hardware problems such as failing memory (RAM), an overheating processor, or a faulty hard drive. Try these steps:
- Run Dell built-in diagnostics — Restart your computer and press F12 at the Dell logo. Select Diagnostics from the menu and run a full hardware test.
- Run Windows Memory Diagnostic:
- Select Start, type Windows Memory Diagnostic, and then press Enter.
- Select Restart now and check for problems.
- Your computer will restart and test your RAM. Results appear after Windows restarts.
- Check temperatures — Overheating can cause blue screen errors. Make sure vents and fans are clean and unblocked. Use Dell's built-in thermal management or a third-party tool to check temperatures.
- Check disk health:
- Open an administrator Command Prompt.
- Type the following command and then press Enter:
chkdsk C: /f /r - If prompted, type Y to schedule the scan for the next restart, and then restart your computer.
If the crash was caused by overclocking
If you have overclocked your CPU, GPU, or RAM, reset all overclocking settings to their default values in BIOS/UEFI. Overclocking may cause instability that leads to blue screen errors.
Common Blue Screen Stop Codes and What They Mean
Here are some of the most frequently encountered stop codes, along with their typical causes and recommended actions:
|
Stop code |
Name |
Common cause |
Recommended action |
|---|---|---|---|
|
0x0000000A |
IRQL_NOT_LESS_OR_EQUAL |
A driver tried to access an invalid memory address. |
Update or roll back the most recently changed driver. |
|
0x0000001E |
KMODE_EXCEPTION_NOT_HANDLED |
A driver or system process encountered an unhandled error. |
Identify the faulting module in the dump analysis and update or reinstall the associated driver. |
|
0x00000050 |
PAGE_FAULT_IN_NONPAGED_AREA |
A driver or service referenced invalid memory, or RAM may be faulty. |
Test RAM using Windows Memory Diagnostic. Update drivers. |
|
0x0000007E |
SYSTEM_THREAD_EXCEPTION_NOT_HANDLED |
A system thread generated an error that the error handler did not catch. |
Update the driver shown in the faulting module. Run SFC. |
|
0x0000009F |
DRIVER_POWER_STATE_FAILURE |
A driver is in an inconsistent or invalid power state. |
Update chipset, display, and network drivers. Check power settings. |
|
0x000000D1 |
DRIVER_IRQL_NOT_LESS_OR_EQUAL |
A driver accessed memory at an incorrect interrupt request level. |
Update or reinstall the driver identified in the analysis. |
|
0x000000EF |
CRITICAL_PROCESS_DIED |
A critical system process unexpectedly stopped. |
Run SFC and DISM. Check for malware. Consider a system restore. |
|
0x00000133 |
DPC_WATCHDOG_VIOLATION |
A long-running procedure caused a timeout, often related to storage or display drivers. |
Update storage (SSD/HDD) and display drivers. Update firmware. |
|
0x0000003B |
SYSTEM_SERVICE_EXCEPTION |
An exception occurred during a system service routine. |
Run SFC. Update recently installed drivers. Check for Windows updates. |
|
0xC000021A |
STATUS_SYSTEM_PROCESS_TERMINATED |
A critical Windows process (such as Winlogon or CSRSS) failed. |
Boot into Safe Mode. Run SFC and DISM. Consider system restore. |
For a full list of stop codes, see Microsoft's Bug Check Code Reference (in English).
Optional: Use Driver Verifier to Find Problem Drivers
If the minidump analysis does not clearly identify the problem driver, or if blue screen errors keep happening, you can use Driver Verifier. This built-in Windows tool monitors drivers in real time and forces a blue screen with detailed information when it detects a driver misbehaving.
Important: Driver Verifier can cause additional blue screen errors intentionally. This is by design, it stresses drivers to find problems. Only use it when you are actively troubleshooting, and always disable it when you are done.
How to enable Driver Verifier
- Select Start, type CMD.
- Right-click Command Prompt, and then select Run as administrator.
- Type the following command and then press Enter:
verifier - In the Driver Verifier Manager, select Create standard settings, and then select Next.
- Select Automatically select unsigned drivers or Select driver names from a list, and then select Next.
Tip: If you suspect a specific driver, select Select driver names from a list and choose only that driver. Verifying fewer drivers makes the process more efficient and reduces the chance of unrelated crashes.
- Select Finish and restart your computer.
- Use your computer as usual. If a faulty driver is detected, Windows generates a blue screen with a detailed dump file. Analyze this new dump file using WinDbg (see Steps 3 and 4 above).
How to disable Driver Verifier
After you finish troubleshooting, always turn off Driver Verifier:
- Open an administrator Command Prompt.
- Type the following command and then press Enter:
verifier /reset - Restart your computer.
What to do if Driver Verifier causes a boot loop
If your computer keeps restarting with blue screen errors after enabling Driver Verifier:
- Restart your computer, hold Shift while selecting Restart from the login screen to access Advanced Startup Options.
- Select Troubleshoot > Advanced options > Command Prompt.
- Type the following command and then press Enter:
verifier /bootmode resetonbootfail. - Immediately follow it by typing this command and press Enter:
verifier /reset - Type
exit, press Enter, and select Continue to reboot.
Frequently Asked Questions (FAQ)
Q: Where are minidump files stored in Windows?
A: By default, Windows saves minidump files to C:\Windows\Minidump\. Each file is named with the date it was created (for example, 010125-12345-01.dmp). Application crash dump files are stored in C:\Users\YourUsername\AppData\Local\CrashDumps\.
Q: What does !analyze -v do in WinDbg?
A: The !analyze -v command tells WinDbg to perform a detailed (verbose) analysis of the crash dump file. It automatically identifies the stop code, the faulting driver or module, and the call stack that led to the crash. This is the most important command to run when analyzing a blue screen dump file.
Q: Why does my analysis show ntoskrnl.exe as the cause?
A: ntoskrnl.exe is the Windows kernel, the core of the operating system. When it appears as the faulting module, it usually means another driver corrupted memory, and the kernel detected the problem. Look at the full call stack and other fields like FAILURE_BUCKET_ID for additional clues about the real cause.
Q: Can I analyze dump files without WinDbg?
A: Yes, there are alternative tools available. However, they may provide less detail than WinDbg.
Q: How do I fix blue screen errors caused by drivers?
A: Start by identifying the driver responsible using WinDbg or another analysis tool. Then update the driver to the latest version from the manufacturer's website or from Dell Drivers & Downloads. If the issue started after a driver update, try rolling back to the previous version using Device Manager.
Q: Why is there no minidump file after a blue screen?
A: If no minidump file was created, your system may not be configured to save them. Go to System Properties > Advanced > Startup and Recovery > Settings, and verify that Small memory dump or Automatic memory dump is selected. Also ensure there is enough disk space on the system drive.
Q: How many minidump files does Windows keep?
A: Windows does not automatically delete old minidump files, but the folder typically stores the most recent files. Over time, these files accumulate. You can safely delete old minidump files if you no longer need them for troubleshooting.
Need more help?
Dell Resources
- Blue Screen Troubleshooting Guide — Step-by-step guide to diagnose and resolve blue screen errors on Dell computers.
- Dell Drivers & Downloads — Download the latest drivers for your Dell computer.
Microsoft Resources
- Microsoft Bug Check Code Reference (in English) — Full list of blue screen stop codes and descriptions.
- Microsoft Advanced Troubleshooting for Stop Errors (in English) — Microsoft's guide to advanced blue screen troubleshooting.
- Analyze a Kernel-Mode Dump File with WinDbg (in English) — Microsoft's documentation on dump file analysis.
- Microsoft Driver Verifier (in English) — Detailed documentation on using Driver Verifier.
- Microsoft Process Explorer (in English) — A tool for identifying what a running process or file belongs to.