PowerProtect Data Manager: Report Browser shows no data
Summary: PowerProtect Data Manager Report Browser shows no data.
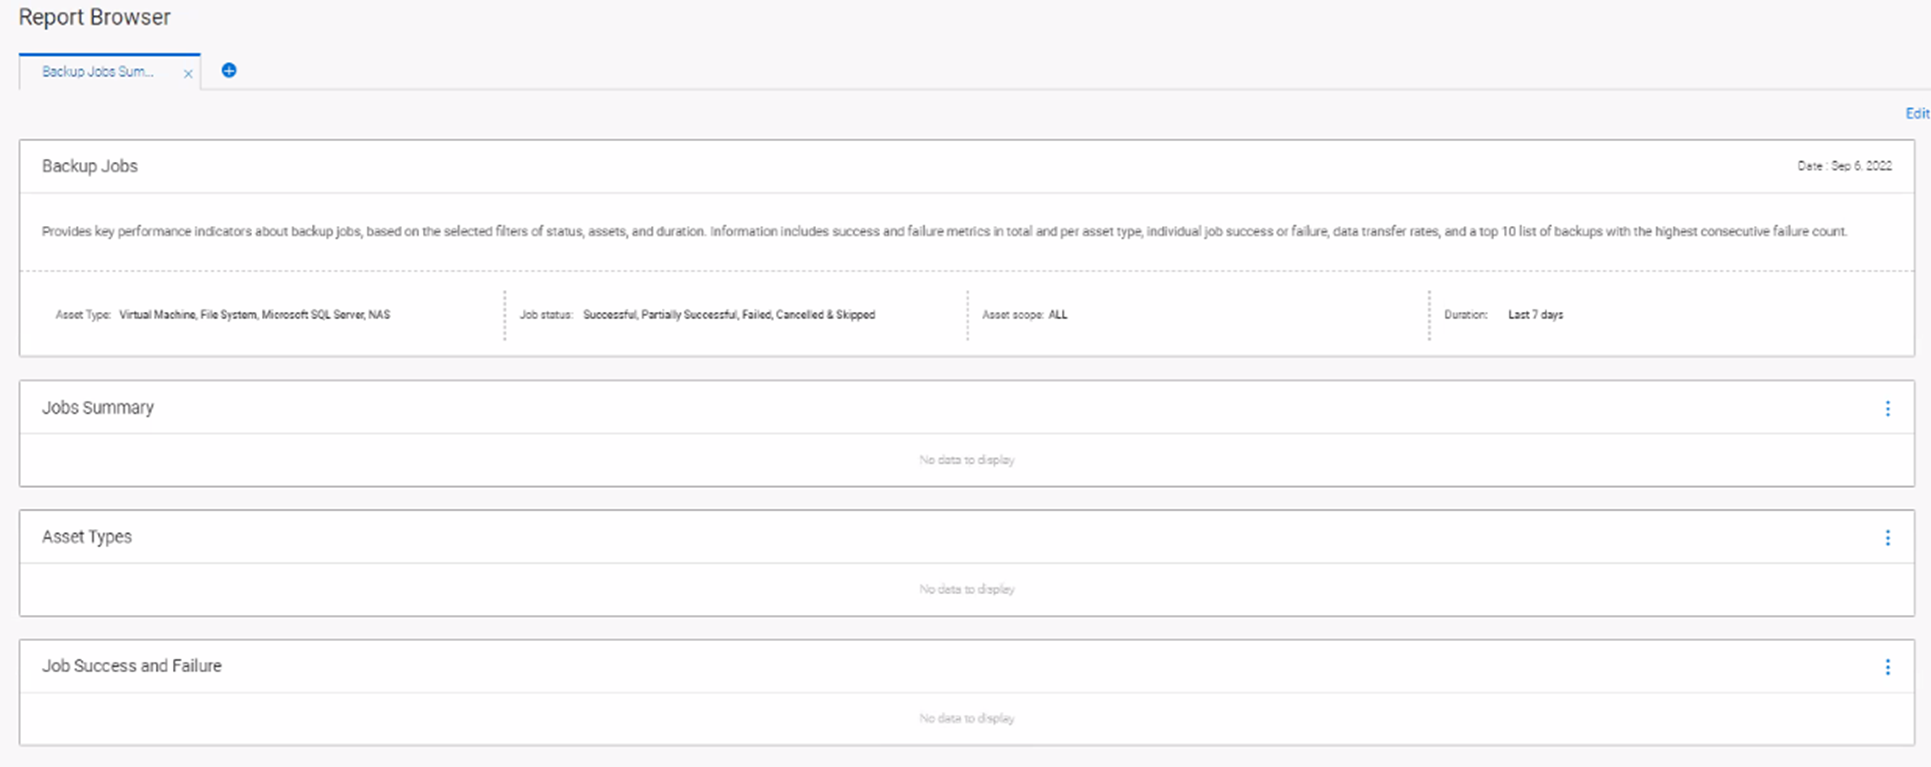
Symptoms
A couple days after reporting engine was deployed, the Report Browser shows no data for backup jobs.
Issue: No reports are visible on 19.12.0-19 for the fresh install scenario.
Observation:
- It is specific to RC19 build and working fine with RC17 build.
- There is no change in the Reporting codebase between RC17 and RC19.
/var/log/dellemc/agent/dpaagent.log from the reporting node has below error logged.
ERR     18508.18530    20221122:142030 com.emc.dpa.agent.mo - execute(): Function status caught ProcessingException
WARN    18508.18530    20221122:142030     com.agent.worker - runAgentWorkerRequest(): Received unexpected output from worker: javax.ws.rs.ProcessingException: Unable to invoke request
WARN    18508.18530    20221122:142030     com.agent.worker - runAgentWorkerRequest(): Received unexpected output from worker:     at org.jboss.resteasy.client.jaxrs.engines.ApacheHttpClient4Engine.invoke(ApacheHttpClient4Engine.java:287)

WARN    18508.18530    20221122:142030     com.agent.worker - runAgentWorkerRequest(): Received unexpected output from worker: Caused by: javax.net.ssl.SSLException: Fatal Alert received: Handshake Failure.

ERR     18508.18529    20221122:142030 com.emc.dpa.agent.mo - execute(): Function jobmonitor caught ProcessingException
WARN    18508.18529    20221122:142030     com.agent.worker - runAgentWorkerRequest(): Received unexpected output from worker: javax.ws.rs.ProcessingException: Unable to invoke request
WARN    18508.18529    20221122:142030     com.agent.worker - runAgentWorkerRequest(): Received unexpected output from worker:     at org.jboss.resteasy.client.jaxrs.engines.ApacheHttpClient4Engine.invoke(ApacheHttpClient4Engine.java:287)
Cause
Duplicate crontab entries (were seen intermittent) to generate certificate files.
Certificates file generation was going into race condition and part of certificates (csr and key) were regenerated.
Resolution
In some instances where this has been observed, the issue has been worked around by following the below steps.
Below steps are required to be performed on the report node.
How to get report node credential using PPDM CLI:
On the PPDM appliance, switch to the root user Run the following commands:## source /opt/emc/vmdirect/unit/vmdirect.env## /opt/emc/vmdirect/bin/infranodemgmt get --secret
Step 01: Make sure single entry in crontab is present to generate certificates.
crontab -l
crontab -e
Step 02: Take a backup and remove old certificates from /opt/emc/dpa/agent/data/ppdm/rs directory.
- Open SSH session to Reporting Node as admin then change to root (-) user.
- Run '
cd /opt/emc/dpa/agent/data/ppdm/rs' - Run '
ls' (root user sees certificate files) - Run '
mkdir old_data' - Run '
mv * old_data' - Run '
ls' (root user sees only old_data directory)
Step 03: DPA agent restart regenerate the certificates.
/opt/emc/dpa/services/bin/dpa.sh agent restart
Check the status of the agent by command 'dpa.sh agent status' it should be running.
Run 'ls' (root user sees newly generated certificate in /opt/emc/dpa/agent/data/ppdm/rs directory.
Step 04: Re-run the report in Report Browser after 1 to 2 hours.
Ideally, after dpa restart, data comes after the Configuration data collection job is triggered and the frequency for that Job is 1 hour.
This issue is permanently fixed in 19.13.