如何安装和配置 VMware Carbon Black Cloud 系统日志连接器
Summary: 了解如何在基于 CentOS 或 Red Hat Enterprise Linux 的服务器上安装和配置 VMware Carbon Black Cloud 系统日志连接器。
Instructions
本文介绍在基于 Red Hat Enterprise Linux 的操作系统上安装、配置和验证 VMware Carbon Black Cloud 系统日志连接器的过程。
受影响的产品:
- VMware Carbon Black Cloud
通过将数据从安全平台传输到集中式安全信息和事件管理 (SIEM) 解决方案,可以轻松管理多个安全产品。Carbon Black 允许通过 API 下载数据,转换为系统日志格式,然后转发到任意数量的 SIEM 解决方案。
VMware Carbon Black Standard 或更高版本允许配置 API,将此数据拉取到客户环境中,从而可以在自定义控制面板中使用高级规则集和数据。
VMware Carbon Black 的系统日志连接器支持基于 RPM 的 Linux 操作系统,如 Red Hat Enterprise Linux 或 CentOS。
要安装和配置系统日志连接器,管理员必须首先解决前提条件,安装连接器,然后配置连接器。之后,管理员可以验证和自动执行系统日志连接器。单击相应的过程以了解更多信息。
- 使用 SSH 登录到要安装系统日志连接器的 Linux 服务器。
提醒:有关通过 SSH 连接的信息,请参阅 保护网络
。
- 通过运行以下命令验证服务器是否为最新版本
sudo yum update的属性的形式向用户提供此功能。 - 必须添加存储库才能安装 PIP,因为 PIP 可能不在核心操作系统存储库中。键入
sudo yum install epel-release分析文件,然后按 Enter 键。
 提醒:如果
提醒:如果epel-release未找到存储库,请通过运行以下命令添加存储库:sudo dnf install https://dl.fedoraproject.org/pub/epel/epel-release-latest-[VERSION].noarch.rpmsudo rpm -ql epel-release
[VERSION]与您正在运行的 Red Hat Enterprise Linux 或 CentOS 版本匹配:- 如果运行的是 Red Hat Enterprise Linux 8 或 CentOS 8:
sudo dnf install https://dl.fedoraproject.org/pub/epel/epel-release-latest-8.noarch.rpm - 如果运行的是 Red Hat Enterprise Linux 7 或 CentOS 7:
sudo dnf install https://dl.fedoraproject.org/pub/epel/epel-release-latest-7.noarch.rpm
- 键入
Y分析文件,然后按 Enter 键。 - 通过键入以下命令安装 PIP:
sudo yum install python3,然后按 Enter 键。

- 通过键入以下命令安装 Python3 构建实用程序:
sudo yum install gcc python3-devel,然后按 Enter 键。

- 通过键入以下命令更新主机操作系统中的所有软件包
sudo yum update,然后按 Enter 键。

- 在安装连接器的服务器上以具有 sudo 访问权限的帐户身份登录。
- 打开终端。
- 键入
pip3 install cbc-syslog分析文件,然后按 Enter 键。
 提醒:
提醒:- 本示例使用 CentOS 8 上的 PIP3。命令可能会因 Python 的版本以及使用的 PIP 版本而略有不同。
- 如果不使用根权限安装,则默认安装位置为:
/usr/lib/python{version}/site-packages/cbc_syslog
- 如果使用根权限安装,则默认安装位置为:
/usr/local/lib/python{version}/site-packages/cbc_syslog
管理员必须同时配置 VMware Carbon Black Cloud 和系统日志连接器本身。单击相应的过程以了解更多信息。
VMware Carbon Black Cloud
VMware Carbon Black Cloud 必须配置为使用系统日志连接器。管理员必须首先生成 API 和 SIEM 密钥,然后生成 API 通知。单击相应的过程以了解更多信息。
生成 API 和 SIEM 密钥
- 在网页浏览器中,转至 [REGION].conferdeploy.net。
提醒:[REGION] = 租户的区域
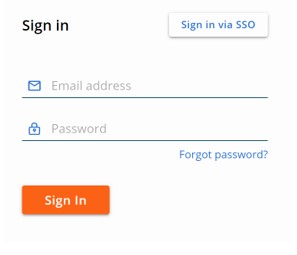
- 登录到 VMware Carbon Black Cloud。

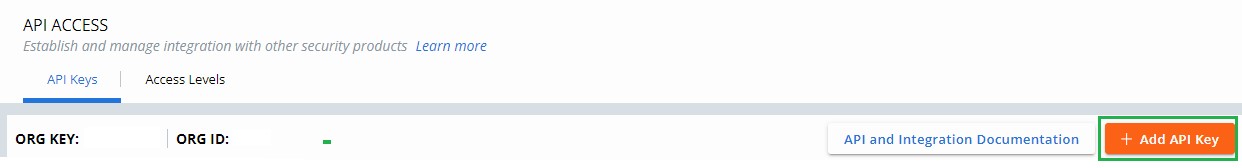
- 在左侧菜单窗格中,展开 Settings,然后单击 API Access。

- 选择 Add API Key。
- 从 “Add API Key ”菜单中:
- 填充名称。
- 填充描述。
- 选择一个访问级别类型。
- 填充应从 VMware Carbon Black Cloud 请求信息的外部授权 IP 地址。
- 单击 Save。

- 在 “API Credentials”中:
- 单击 API ID 右侧的剪贴板图标以将 ID 复制到剪贴板。
- 记录 API ID。
- 单击 API 密钥右侧的剪贴板图标以将密钥复制到剪贴板。
- 记录 API 密钥。
- 单击右上角的 X。

- 选择 Add API Key。

- 从 “Add API Key ”菜单中:
- 填充名称。
- 填充描述。
- 选择一个访问级别类型。
- 填充应从 VMware Carbon Black Cloud 请求信息的外部授权 IP 地址。
- 单击 Save。

- 在 “API Credentials”中:
- 单击 API ID 右侧的剪贴板图标以将 ID 复制到剪贴板。
- 记录 API ID。
- 单击 API 密钥右侧的剪贴板图标以将密钥复制到剪贴板。
- 记录 API 密钥。
- 单击右上角的 X。

生成 API 通知
通过在 VMware Carbon Black Cloud 控制台中设置的通知,将信息发送到之前配置的 API。
- 在网页浏览器中,转至 [REGION].conferdeploy.net。
提醒:[REGION] = 租户的区域
- 登录到 VMware Carbon Black Cloud。
- 在左侧菜单窗格中,展开 Settings,然后单击 Notifications。

- 单击 Add Notification。

- 从 “Add Notification ”菜单中:
- 填充名称。
- 确定您希望何时收到通知。
- 选择要通知的相应策略。
- 填充用于接收通知的电子邮件地址,并选择每天为每种威胁类型仅发送 1 封电子邮件。
- 使用之前生成的 API ID 填充 API 密钥。
- 单击 Add。
 提醒:使用 Carbon Black Enterprise EDR 的客户还可以指定通过 SIEM 发送的监视列表。这样可以实现更有针对性的信息收集方法。
系统日志连接器
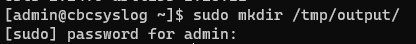
- 通过 SSH 连接到托管系统日志连接器的服务器。
- 通过键入以下命令生成系统日志输出的备份目录:
sudo mkdir /tmp/output/分析文件,然后按 Enter 键。
- 通过键入以下命令创建配置文件:
sudo touch /tmp/cbsyslog-config.txt分析文件,然后按 Enter 键。

- 通过键入以下命令创建日志文件:
sudo touch /tmp/cbsyslog-log.log分析文件,然后按 Enter 键。

- 通过键入以下命令,使用 nano 和 sudo 权限打开之前创建的配置文件
sudo nano /tmp/cbsyslog-config.txt分析文件,然后按 Enter 键。

- 复制 以下文本,然后将其 粘贴 到文本编辑器中。
[general] # Template for syslog output. # This is a jinja 2 template # NOTE: The source variable corresponds to the Carbon Black Cloud Server used to retrieve results template = {{source}} {{version}}|{{vendor}}|{{product}}|{{dev_version}}|{{signature}}|{{name}}|{{severity}}|{{extension}} #Location of the Backup Directory #This will be the location of back up files in the event that results fail to send to Syslog back_up_dir = /tmp/output/ # This sets the default severity level for POLICY_ACTION notifications. By default it is 4. # 0 - Emergency: System is unusable. # 1 - Alert: Action must be taken immediately. # 2 - Critical: Critical conditions. # 3 - Error: Error conditions. # 4 - Warning: Warning conditions. # 5 - Notice: Normal but significant condition. # 6 - Informational: Informational messages. # 7 - Debug: Debug-level messages. policy_action_severity = 4 # Output format of the data sent. Currently support json or cef formats # Warning: if using json output_format, we recommend NOT using UDP output_type output_format=cef # Configure the specific output. # Valid options are: 'udp', 'tcp', 'tcp+tls', 'http' # udp - Have the events sent over a UDP socket # tcp - Have the events sent over a TCP socket # tcp+tls - Have the events sent over a TLS+TCP socket # http - Have the events sent over a HTTP connection output_type=tcp # tcpout=IP:port - ie 1.2.3.5:514 tcp_out= # udpout=IP:port - ie 1.2.3.5:514 #udp_out= # httpout=http/https endpoint - ie https://server.company.com/endpoint # http_headers= {'key1': 'value1', 'key2': 'value2'} - ie {'content-type': 'application/json'} # https_ssl_verify = True or False #http_out= #http_headers= {'content-type': 'application/json'} #https_ssl_verify=True # Override ca file for self signed certificates when using https # This is typically a .pem file #requests_ca_cert=/usr/share/cb/integrations/cbc-syslog/cert.pem [tls] # Specify a file containing PEM-encoded CA certificates for verifying the peer server when using TLS+TCP syslog #ca_cert = /etc/cb/integrations/cbc-syslog/ca.pem # Optionally specify a file containing PEM-encoded client certificate for verifying this client when using TLS+TCP syslog # If cert is specified, key is a required parameter #cert = /etc/cb/integrations/cbc-syslog/cert.pem # Optionally specify a file containing PEM-encoded private key for verifying this client when using TLS+TCP syslog # If key is specified, cert is a required parameter #key = /etc/cb/integrations/cbc-syslog/cert.key # Optionally specify the password to decrypt the given private key when using TLS+TCP syslog #key_password = p@ssw0rd1 # Uncomment tls_verify and set to "false" in order to disable verification of the peer server certificate #tls_verify = true [CarbonBlackCloudServer1] # Carbon Black Cloud API Connector ID api_connector_id = EXAMP13 # Carbon Black Cloud API Key api_key = EXAMP13EXAMP13EXAMP13 # Carbon Black Cloud SIEM Connector ID siem_connector_id = EXAMP131234 # Carbon Black Cloud SIEM Key siem_api_key = EXAMP13EXAMP13EXAMP13 # Carbon Black Cloud Server URL # NOTE: this is not the url to the web ui, but to the API URL # For more than one Carbon Black Cloud Server, add another server using the following template including the stanza #[CarbonBlackCloudServer2] #api_connector_id = KJARWBZ111 #api_key = CQF35EIH2WDF69PTWKGC4111 #server_url = https://defense-prod05.conferdeploy.net - 要使用 TCP 发送输出,请使用以下命令填充 主机 和 端口 :
output_type设置为TCP的属性的形式向用户提供此功能。
 提醒:示例图像已编辑设置。
 - 更新
api_connector_id和api_key根据 API 类型的 API ID 和 API 类型的 API 密钥。
 提醒:有关 API 和 SIEM 密钥创建位置的信息,请参阅上面的 “生成 API 和 SIEM 密钥 ”部分。
 - 更新
siem_connector_id和siem_api_key根据 SIEM 类型的 API ID 和 SIEM 类型的 API 密钥。
 提醒:有关 API 和 SIEM 密钥创建位置的信息,请参阅上面的 “生成 API 和 SIEM 密钥 ”部分。
 - 按住 CTRL 键,然后按 X 键保存文件。按 Ctrl 键确认保存文件
Y的属性的形式向用户提供此功能。

- 通过按 Enter 键确认文件名。

管理员必须 测试然后 验证 来自系统日志连接器的输出。单击相应的过程以了解更多信息。
测试
- 从 Linux 服务器打开终端。
- 键入
sudo python[VER] [INSTALLDIRECTORY]/cbc_syslog.py -l [LOGFILELOCATION] -c [CONFIGFILELOCATION]分析文件,然后按 Enter 键。提醒:[VER]= Python 的版本[INSTALLDIRECTORY]= 安装系统日志连接器的目录[LOGFILELOCATION]= 日志文件的位置[CONFIGFILELOCATION]= 配置文件的位置
示例:
sudo python3 /usr/local/lib/python3.6/site-packages/cbc_syslog/cbc_syslog.py -l /tmp/cbsyslog-log.log -c /tmp/cbsyslog-config.txt

此命令基于定义的配置文件对系统日志连接器执行一次性运行,并输出到定义的日志文件。
执行测试运行后,根据测试选项中生成的日志文件检查输出。检查日志文件以确认连接成功或失败。
验证
- 从 Linux 服务器打开终端。
- 键入
cat [LOGFILELOCATION]分析文件,然后按 Enter 键。提醒:[LOGFILELOCATION]= 日志文件的位置
示例:
cat /tmp/cbsyslog-log.log
成功运行会返回类似于以下内容的响应:
Carbon Black Cloud Syslog 2.0
Carbon Black Cloud Syslog 2.0
Found 1 Carbon Black Cloud Servers in config file
Handling notifications for https://defense-prod05.conferdeploy.net
Sending Notifications
Done Sending Notifications
Sending Audit Logs
Done Sending Audit Logs

接收 SIEM 或系统日志实例会在在 VMware Carbon Black Cloud 控制台中输出自通知创建以来发生的所有事件。
在已配置的 SIEM 或系统日志服务器中验证是否正确捕获了信息。这因每个应用程序而异。
可以使用 cron 自动运行系统日志连接器以定期拉取信息。
- 通过键入以下命令生成用于自动化的脚本
sudo nano /tmp/cbsyslogrun.sh分析文件,然后按 Enter 键。
 提醒:该示例生成一个 shell 脚本
/tmp/cbsyslogrun.sh的属性的形式向用户提供此功能。 - 复制验证部分中使用的验证脚本,然后将该脚本粘贴到文本编辑器中。

- 按 CTRL+X 以退出。
- 在提示保存时按 Y 继续,以保存更改。

- 通过键入以下内容更新脚本以允许其作为脚本运行
sudo chmod a+x /tmp/cbsyslogrun.sh分析文件,然后按 Enter 键。

- 打开 crontab 文件,通过键入以下命令将脚本添加为自动化任务:
sudo crontab -e分析文件,然后按 Enter 键。 - Crontab 利用基于 VI 的语法来编辑文本。按 Insert 键以添加字符。
- 键入
*/[MINUTES] * * * * /tmp/cbsyslogrun.sh,然后按 ESC 取消文本插入阶段。
 提醒:
提醒:[MINUTES]= 再次运行命令之前要等待的分钟数- 在示例图片中,该示例每 15 分钟运行一次。
- 按冒号 (:) 键以输入命令。
- 键入
wq,然后按 Enter 键写入并退出 crontab 编辑器。 - 通过键入以下命令确认更改:
sudo crontab -l分析文件,然后按 Enter 键。 - 验证列表中是否显示计划的任务(步骤 7)。如果显示任务,则已配置自动化。如果未显示任务,请转至步骤 13。

- 键入
sudo systemctl start crond.service分析文件,然后按 Enter 键。 - 键入
sudo systemctl enable crond.service分析文件,然后按 Enter 键。 - 键入
sudo crontab -l分析文件,然后按 Enter 键。

- 验证计划的任务出现在列表中。
要联系支持部门,请参阅 Dell Data Security 国际支持电话号码。
转至 TechDirect,在线生成技术支持请求。
要获得更多见解和资源,请加入戴尔安全社区论坛。