ECS : Comment configurer des interruptions SNMP ECS (en anglais)
Summary: Les traps SNMP sont générés par l’un des nœuds de cycle de vie sur ECS. L’article suivant de la base de connaissances explique comment identifier le nœud de cycle de vie actif et générer une alerte de test pour produire un événement d’interruption. ...
This article applies to
This article does not apply to
This article is not tied to any specific product.
Not all product versions are identified in this article.
Instructions
Les traps SNMP sont générés par l’un des nœuds de cycle de vie sur ECS. L’article suivant de la base de connaissances explique comment identifier le nœud de cycle de vie actif et générer une alerte de test pour produire un événement d’interruption.
Pour configurer et recréer les envois de traps SNMP :
Notez que tous les nœuds du serveur Lifecycle peuvent déclencher un trap, car ils sont synchronisés en tant qu’ensemble et que tous les nœuds disposent d’agents de fabric à mettre à jour sur l’état du nœud et des ressources.
Guide d’administration d’ECS 3.1 Informations supplémentaires sur les interruptions :
ECS 3.7 Administration Guide (dell.com) (Page 149-155)
MIB nécessaires pour la traduction OID dans la plupart des solutions de surveillance :
https://dl.dell.com/downloads/DL79351_ECS-MIB.mib
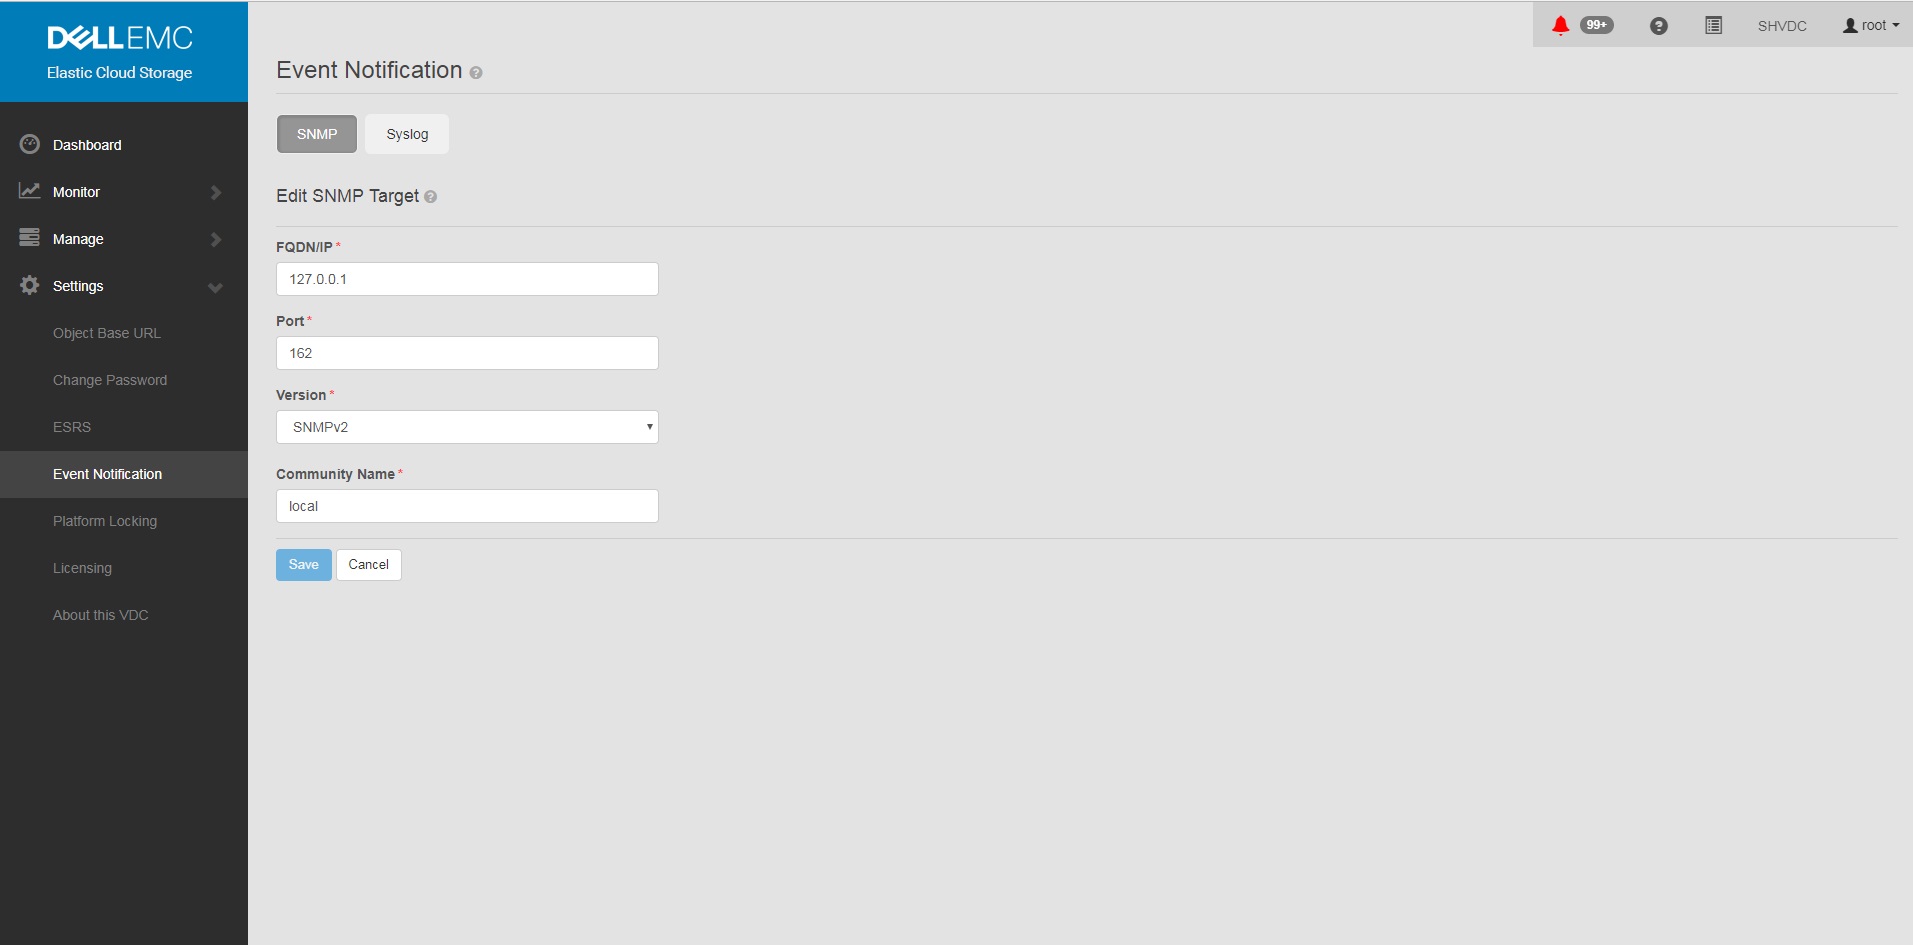
Pour configurer et recréer les envois de traps SNMP :
- Définir SNMP sur l’adresse> du récepteur d’interruption <dans l’interface utilisateur graphique
un. Paramètres de l’interface graphique
b. Notification
d’événements c. Sélectionnez SNMP
d. New Target
FQDN/IP = <trap receiver address>
Port= 162
Version= SNMPv2
Community Name= <community string>
Save
b. Notification
d’événements c. Sélectionnez SNMP
d. New Target
FQDN/IP = <trap receiver address>
Port= 162
Version= SNMPv2
Community Name= <community string>
Save
Exemple :
- Vérifiez que la configuration est définie sur ECS après avoir ajouté une configuration d’interruption dans l’interface utilisateur.
Commande :
Exemple :
# sudo /opt/emc/caspian/fabric/cli/bin/fcli-internal lifecycle alert.snmpconfiguration
Exemple :
Node 1:~ # sudo /opt/emc/caspian/fabric/cli/bin/fcli-internal lifecycle alert.snmpconfiguration
{
  "status": "OK",
  "etag": 73523,
  "snmp_configuration": {
    "engine_id": "80001370010A20A9799527B54B",
    "snmp_targets": [{
      "version": "v2",
      "port": 162,
      "hostname": "127.0.0.1",
      "community": "local",
      "username": "",
      "target_id": "816bd926-147e-4309-bf69-492eea94fc7a",
      "authentication_protocol": "",
      "privacy_protocol": ""
    }]
  }
}
- Exécutez la commande test alert pour générer une alerte et une interruption SNMP.
Commande (notez que vous devrez remplacer le nom d’utilisateur et le mot de passe appropriés) :
Exemple :
# TOKEN=$(curl -iks https://localhost:4443/login -u '<User:Password>' | grep X-SDS-AUTH-TOKEN);echo $TOKEN;curl -ks -H "$TOKEN" -H "Content-Type: application/json" -d '{"user_str": "ECS Test Alert", "contact": "ecsadmin@company.com"}' https://localhost:4443/vdc/callhome/alert | xmllint --format -;curl -vk -H "$TOKEN" "https://localhost:4443/logout"
Exemple :
admin@provo:~> TOKEN=$(curl -iks https://localhost:4443/login -u 'root:ChangeMe' | grep X-SDS-AUTH-TOKEN);echo $TOKEN;curl -ks -H "$TOKEN" -H "Content-Type: application/json" -d '{"user_str": "ECS Test Alert", "contact": "ecsadmin@company.com"}' https://localhost:4443/vdc/callhome/alert | xmllint --format -;curl -vk -H "$TOKEN" "https://localhost:4443/logout"
X-SDS-AUTH-TOKEN: BAAcSWx4M3IvY0p6VFBCTUtTaE9zdmFVSVFZNFdNPQMAjAQASHVybjpzdG9yYWdlb3M6VmlydHVhbERhdGFDZW50ZXJEYXRhOmZkYzJhMDg2LTQzMGEtNGU3ZC04ZmNiLTU2MDA3ZDFmOWU4NgIADTE1NTM1NDgzNjk5ODEDAC51cm46VG9rZW46YzQ3ZmUwYzYtZjg3Ni00OTE5LWJkMWYtZDgyMjYwN2I2MmIwAgAC0A8=
<?xml version="1.0" encoding="UTF-8" standalone="yes"?>
<alert>
  <acknowledged>false</acknowledged>
  <type>Notify</type>
  <description>ECS Test Alert: ecsadmin@company.com</description>
  <id>urn:storageos:Alert:bbb02b69-0169-1355-a40a-c1f3512e51cd</id>
  <namespace/>
  <severity>INFO</severity>
  <symptomCode>999</symptomCode>
  <timestamp>2019-03-26T20:27:58</timestamp>
</alert>
* SSL connection using TLSv1.2 / ECDHE-RSA-AES256-GCM-SHA384
* Server certificate:
*        subject: CN=localhost
*        start date: 2018-02-28 10:53:28 GMT
*        expire date: 2028-02-26 10:53:28 GMT
*        issuer: CN=localhost
*        SSL certificate verify result: self signed certificate (18), continuing anyway.
* SSLv2, Unknown (23):
> GET /logout HTTP/1.1
> User-Agent: curl/7.37.0
> Host: localhost:4443
> Accept: */*
> X-SDS-AUTH-TOKEN: BAAcSWx4M3IvY0p6VFBCTUtTaE9zdmFVSVFZNFdNPQMAjAQASHVybjpzdG9yYWdlb3M6VmlydHVhbERhdGFDZW50ZXJEYXRhOmZkYzJhMDg2LTQzMGEtNGU3ZC04ZmNiLTU2MDA3ZDFmOWU4NgIADTE1NTM1NDgzNjk5ODEDAC51cm46VG9rZW46YzQ3ZmUwYzYtZjg3Ni00OTE5LWJkMWYtZDgyMjYwN2I2MmIwAgAC0A8=
>
* SSLv2, Unknown (23):
< HTTP/1.1 200 OK
< Date: Tue, 26 Mar 2019 20:27:58 GMT
< Content-Type: application/xml
< Content-Length: 95
< Connection: keep-alive
<
* Connection #0 to host localhost left intact
<?xml version="1.0" encoding="UTF-8" standalone="yes"?><LoggedOut><user>root</user></LoggedOut>
- Exécutez la commande suivante pour voir si l’interruption est sortie d’un autre nœud de cycle de vie du cluster, car l’entrée de journal doit afficher la date la plus récente.
Commande :
Exemple (notez que le nœud 3 a consigné l’envoi de traps) :
# domulti 'grep -i snmp /opt/emc/caspian/fabric/agent/services/fabric/lifecycle/log/lifecycle.log'
Exemple (notez que le nœud 3 a consigné l’envoi de traps) :
admin@provo:~> domulti 'grep -i snmp /opt/emc/caspian/fabric/agent/services/fabric/lifecycle/log/lifecycle.log | grep 2017-12-11'
192.168.219.1
========================================

192.168.219.2
========================================

192.168.219.3
========================================
2017-12-11 18:10:48,849 1419726792 [qtp1183213894-166677] DEBUG com.emc.caspian.fabric.lifecycle.alert.snmp.TrapSenderV2::<init> (line: 51)  - 36827218-dcc3-4d44-b843-1fdcedc3899c Created trap sender SnmpV2CTarget[hostname=127.0.0.1, port=162, version=v2]
2017-12-11 18:10:48,856 1419726799 [qtp1183213894-166677] DEBUG com.emc.caspian.fabric.lifecycle.alert.snmp.TrapSenderV2::sendTrap (line: 85)  - 36827218-dcc3-4d44-b843-1fdcedc3899c Sent trap: pdu TRAP[requestID=143015719, errorStatus=Success(0), errorIndex=0, VBS[1.3.6.1.2.1.1.3.0 = 113 days, 3:54:55.25; 1.3.6.1.6.3.1.1.4.1.0 = 1.3.6.1.4.1.1139.102.1.1; 1.3.6.1.4.1.1139.102.0.1.1 = Mon Dec 11 18:10:48 UTC 2017; 1.3.6.1.4.1.1139.102.0.1.2 = Info; 1.3.6.1.4.1.1139.102.0.1.3 = 999; 1.3.6.1.4.1.1139.102.0.1.4 = ECS Test Alert: ecsadmin@company.com]], target: CommunityTarget[address=127.0.0.1/162,version=1,timeout=5000,retries=2,securityLevel=1,securityModel=1,securityName=local,preferredTransports=null], snmp: org.snmp4j.Snmp@6e6f15f3, transport: org.snmp4j.transport.DefaultUdpTransportMapping@122299ef
2017-12-11 18:10:48,857 1419726800 [qtp1183213894-166677] INFO com.emc.caspian.fabric.lifecycle.alert.snmp.SnmpAgent::sendAlert (line: 400)  - 36827218-dcc3-4d44-b843-1fdcedc3899c Sent alert Event[symptomCode=999, category=CONFIGURATION, severity=INFO, status=UNKNOWN, component=Object, componentId=, subComponent=Notify, subComponentId=, callHome=true, firstTime=1513015848814, lastTime=1513015848814, count=0, eventData=, description=ECS Test Alert: ecsadmin@company.com, channel=ALL] to SNMP target: SnmpV2CTarget[hostname=127.0.0.1, port=162, version=v2]

192.168.219.4
========================================
grep: /opt/emc/caspian/fabric/agent/services/fabric/lifecycle/log/lifecycle.log: No such file or directory
- Dans une deuxième fenêtre Putty, ouvrez une session ssh dans le nœud qui s’est produit dans les logs les plus récents et exécutez la commande suivante.
Commande :
# tcpdump udp -i any port 162
- Dans votre fenêtre principale exécutez la commande suivante pour générer un trap de test :
Commande (notez que vous devrez remplacer le nom d’utilisateur et le mot de passe appropriés) :
Exemple :
# TOKEN=$(curl -iks https://localhost:4443/login -u '<User:Password>' | grep X-SDS-AUTH-TOKEN);echo $TOKEN;curl -ks -H "$TOKEN" -H "Content-Type: application/json" -d '{"user_str": "ECS Test Alert", "contact": "ecsadmin@company.com"}' https://localhost:4443/vdc/callhome/alert | xmllint --format -;curl -vk -H "$TOKEN" "https://localhost:4443/logout"
Exemple :
admin@provo:~> TOKEN=$(curl -iks https://localhost:4443/login -u 'root:ChangeMe' | grep X-SDS-AUTH-TOKEN);echo $TOKEN;curl -ks -H "$TOKEN" -H "Content-Type: application/json" -d '{"user_str": "ECS Test Alert", "contact": "ecsadmin@company.com"}' https://localhost:4443/vdc/callhome/alert | xmllint --format -;curl -vk -H "$TOKEN" "https://localhost:4443/logout"
X-SDS-AUTH-TOKEN: BAAcUWtmaTU0OEo0M21EYW1oSHVLa2dacFUyVTFjPQMAjAQASHVybjpzdG9yYWdlb3M6VmlydHVhbERhdGFDZW50ZXJEYXRhOjI1ZTU1NDY3LWNiMTMtNGM5NC05NGZjLWMzNjBjYjRhNjExYgIADTE1MTI4OTA0NjExODQDAC51cm46VG9rZW46MTYzNzA2ZTgtNTI1Zi00NjgwLWJkYmItZjYyYWM0MjQ1YzViAgAC0A8=
<?xml version="1.0" encoding="UTF-8" standalone="yes"?>
<alert>
  <acknowledged>false</acknowledged>
  <type>Notify</type>
  <description>ECS Test Alert: ecsadmin@company.com</description>
  <id>urn:storageos:Alert:46c9fdf1-0160-13fc-b8df-7c7be33092f3</id>
  <namespace/>
  <severity>INFO</severity>
  <symptomCode>999</symptomCode>
  <timestamp>2017-12-11T18:15:31</timestamp>
</alert>
- Dans la deuxième fenêtre, vous devriez voir le piège se déclencher hors du nœud de cycle de vie. Si le trap ne s’affiche pas, vérifiez à nouveau les journaux à l’étape 4, car le nœud zookeeper qui répond a peut-être changé.
Exemple (notez que dans ce cas, nous avons identifié le nœud 3 comme étant le nœud émetteur des traps au moment de la génération de l’interruption) :
admin@murray:~> tcpdump udp -i any port 162
tcpdump: verbose output suppressed, use -v or -vv for full protocol decode
listening on any, link-type LINUX_SLL (Linux cooked), capture size 262144 bytes
18:15:37.050102 IP localhost.33530 > localhost.snmptrap:  C="local" V2Trap(198)  system.sysUpTime.0=977758344 S:1.1.4.1.0=E:1139.102.1.1 E:1139.102.0.1.1="Mon Dec 11 18:15:37 UTC 2017" E:1139.102.0.1.2="Info" E:1139.102.0.1.3="999" E:1139.102.0.1.4="ECS Test Alert: ecsadmin@company.com"
Notez que tous les nœuds du serveur Lifecycle peuvent déclencher un trap, car ils sont synchronisés en tant qu’ensemble et que tous les nœuds disposent d’agents de fabric à mettre à jour sur l’état du nœud et des ressources.
Guide d’administration d’ECS 3.1 Informations supplémentaires sur les interruptions :
ECS 3.7 Administration Guide (dell.com) (Page 149-155)
MIB nécessaires pour la traduction OID dans la plupart des solutions de surveillance :
https://dl.dell.com/downloads/DL79351_ECS-MIB.mib
Affected Products
ECS ApplianceProducts
ECS Appliance Hardware Gen1 U-Series, ECS Appliance Software with Encryption, ECS Appliance Software without EncryptionArticle Properties
Article Number: 000019915
Article Type: How To
Last Modified: 18 Jan 2023
Version: 3
Find answers to your questions from other Dell users
Support Services
Check if your device is covered by Support Services.