PowerScale, Isilon OneFS: HBase Performance Testing on Isilon
Resumen: This article illustrates the performance benchmarking tests on an Isilon X410 cluster using the Yahoo Cloud Serving Benchmarking (YCSB) suite and Cloudera Data Hub (CDH) 5.10.
Este artículo se aplica a
Este artículo no se aplica a
Este artículo no está vinculado a ningún producto específico.
No se identifican todas las versiones del producto en este artículo.
Síntomas
Not required
Causa
Not required
Resolución
NOTE: This topic is part of the Using Hadoop with OneFS Info Hub.
Introduction
A series of performance benchmarking tests was performed on an Isilon X410 cluster using the YCSB benchmarking suite and CDH 5.10.
The lab test environment was configured with five Isilon x410 nodes running OneFS v8.0.0.4 and later v8.0.1.1. Network File System (NFS) Large Block streaming benchmarks were run. The expected theoretical aggregate maximum for the tests were ~700 MB/s (3.5 GB/s) writes and ~1 GB/s reads (5 GB/s) per node.
The (9) Compute nodes are Dell PowerEdge FC630 servers running CentOS v7.3.1611 each configured with 2x18C/36T-Intel Xeon® CPU E5-2697 v4 @ 2.30GHz with 512GB of RAM. Local storage is 2xSSD in RAID 1 formatted as XFS for both operating system and scratch space or spill files.
There were also three additional Edge servers which were used to drive the YCSB load.
The backend network between compute nodes and Isilon is 10 Gbps with Jumbo Frames set (MTU=9162) for the NICs and the switch ports.
The components of the Hadoop Test Configuration (Figure 1)
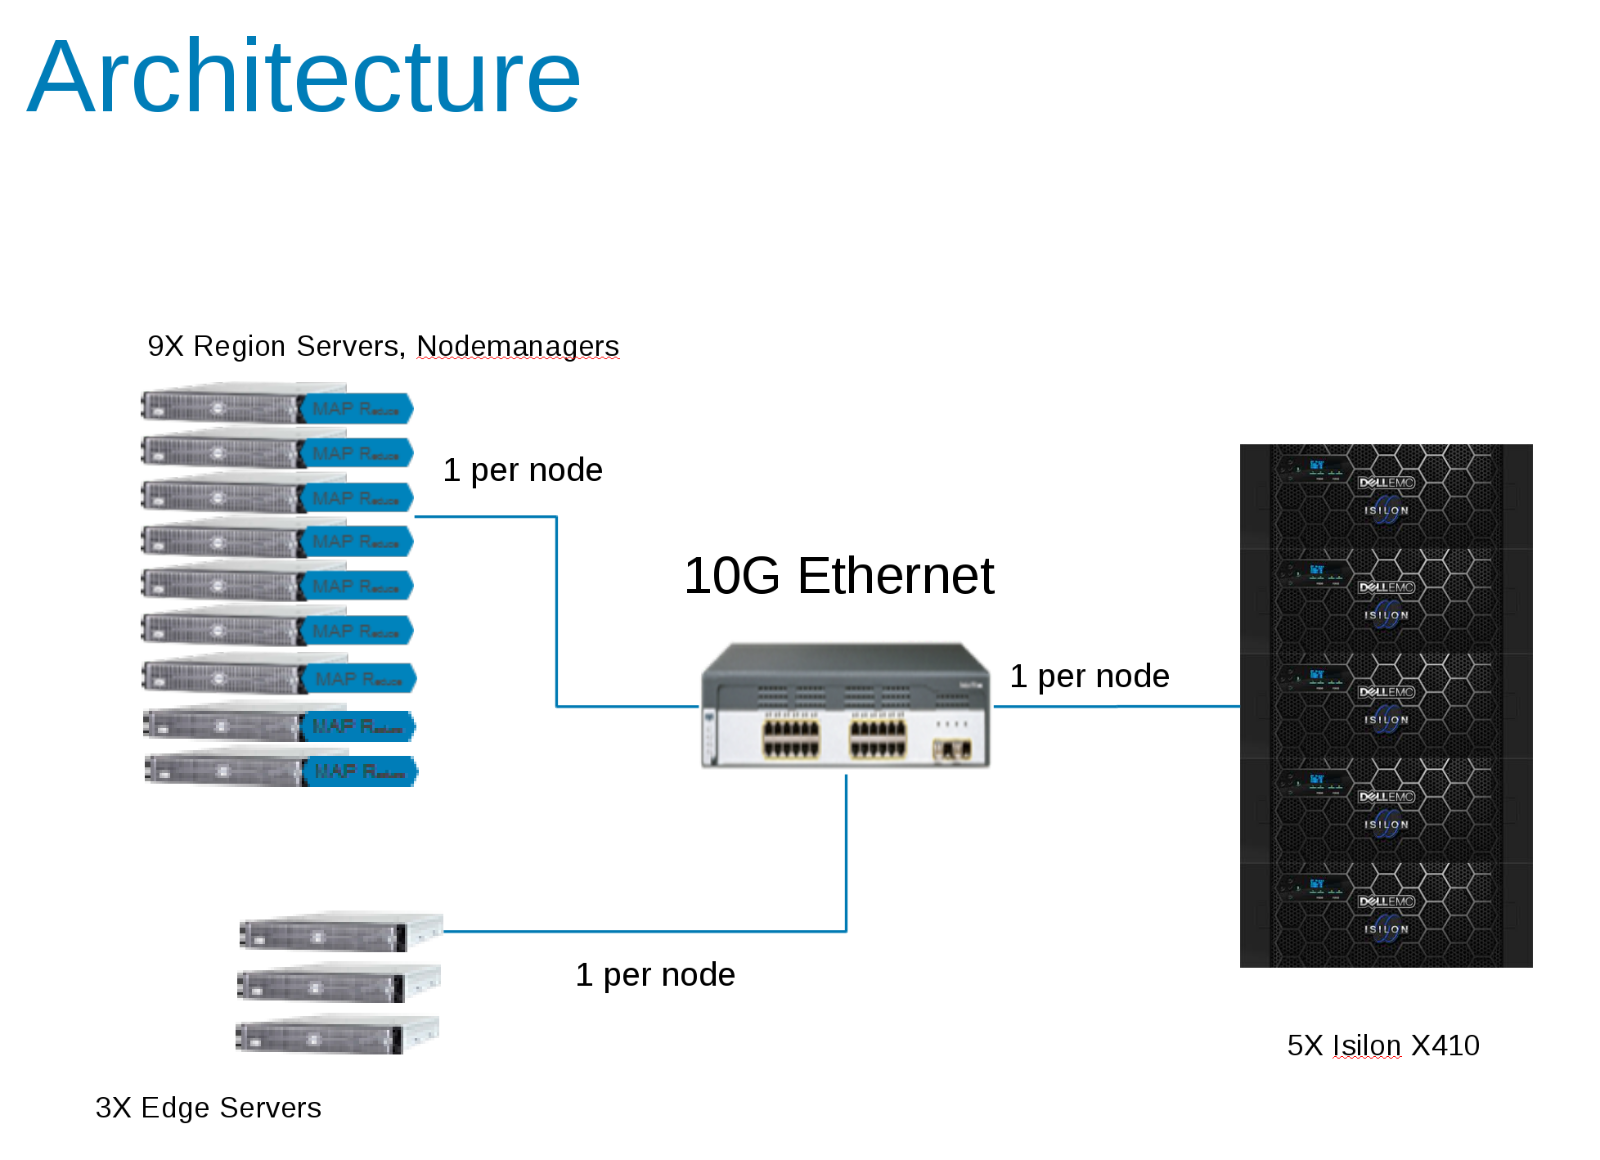
CDH 5.10 was configured to run in an Access Zone on the Isilon Cluster. Service accounts were created in the Isilon Local provider and locally in the client /etc/passwd files. All tests were run using a basic test client with no special privileges.
Isilon statistics were monitored with both IIQ and Grafana/Data Insights package. CDH statistics were monitored with Cloudera Manager and also with Grafana.
Initial Testing
The first series of tests were to determine the relevant parameters on the HBASE side that affected the overall output. The YCSB tool was used to generate the load for HBASE. This initial test was run using a single client (edge server) using the 'load' phase of YCSB and 40 Million rows. This table was deleted prior to each run.
ycsb load hbase10 -P workloads/workloada1 -p table='ycsb_40Mtable_nr' -p columnfamily=family -threads 256 -p recordcount=40000000
- hbase.regionserver.maxlogs - Maximum number of Write-Ahead Log (WAL) files - This value multiplied by HDFS Block Size (dfs.blocksize) is the size of the WAL that must be replayed when a server crashes. This value is inversely proportional to the frequency of flushes to the disk.
- hbase.wal.regiongrouping.numgroups - When using Multiple HDFS WAL as the WALProvider this sets how many write-ahead-logs each RegionServer should run. The results show the number of HDFS pipelines. Writes for a given Region only go to a single pipeline, spreading the total RegionServer load.
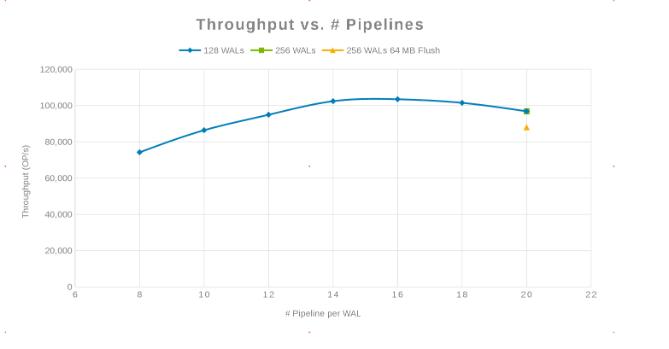
Throughput compared with the number of Pipelines (Figure 2)
Latency compared with the Number of Pipelines (Figure 3)
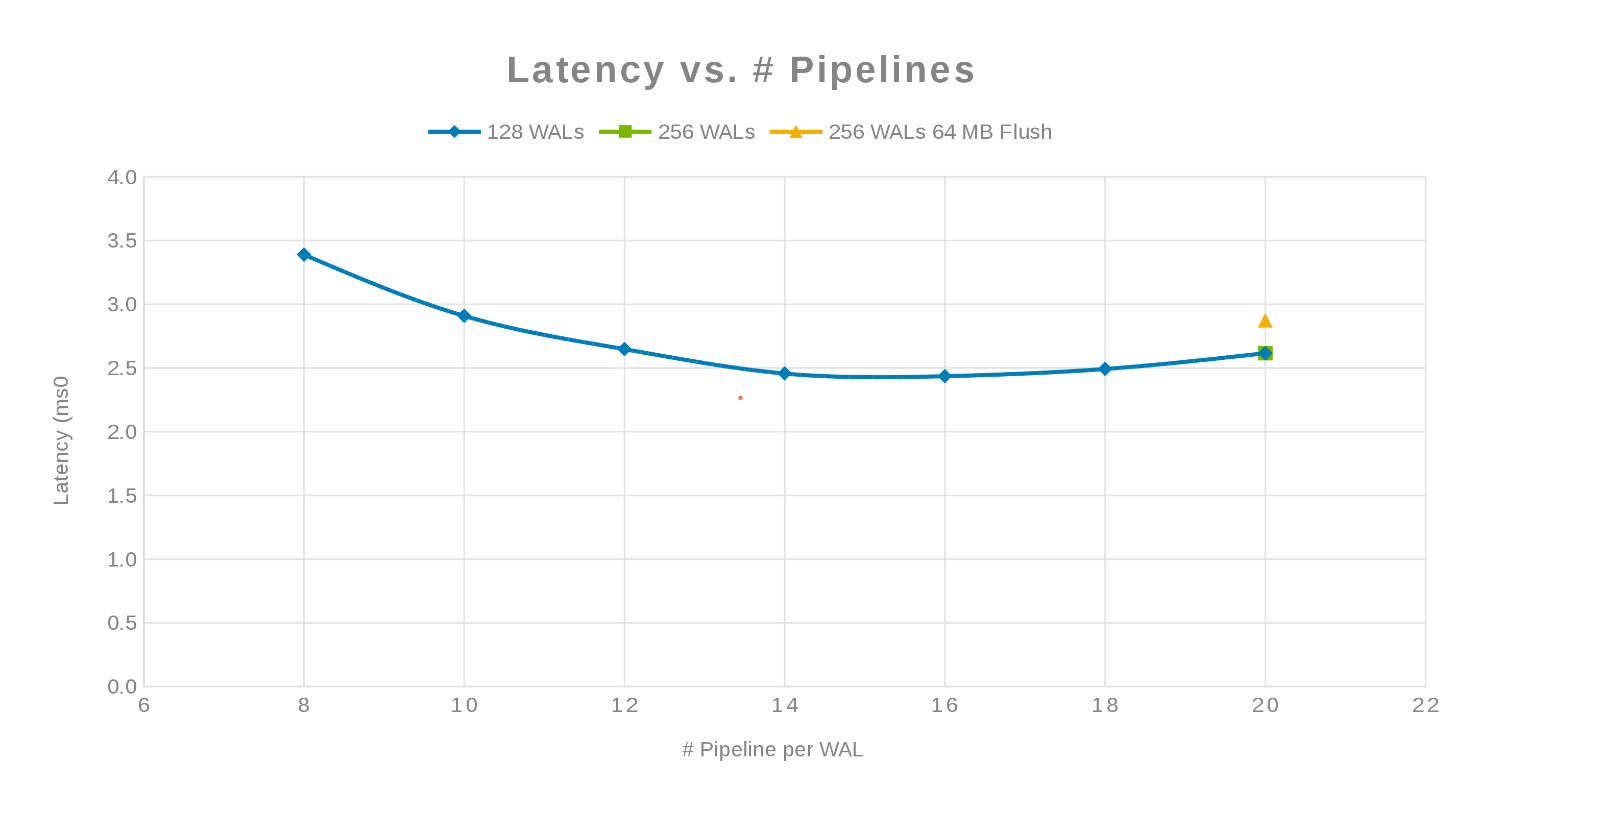
The philosophy here was to parallelize as many writes as possible. Increasing the number of WALs and then the number of threads (pipeline) per WAL accomplishes this. The previous two charts show that for a given number for 'maxlogs', 128 or 256, no real change is shown. This indicates that the test is not really impacting the results from the client side. The number of 'pipelines' per file were varied which showed a trend indicating the parameter that is sensitive to parallelization. The next question is, where does and Isilon cluster "get in the way" either with Disk I/O, Network, CPU, or OneFS. To answer this question look at the Isilon statistics report.
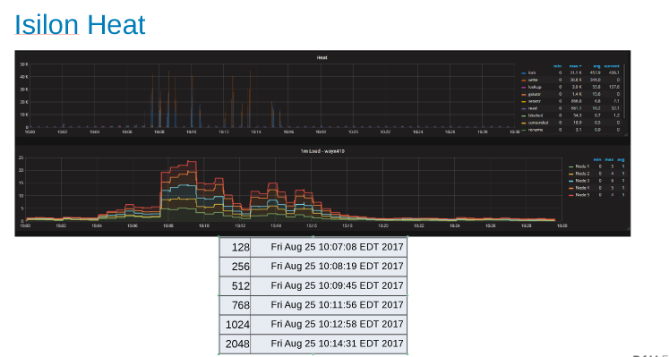
The Isilon Network Utilization and load during the test (Figure 4)
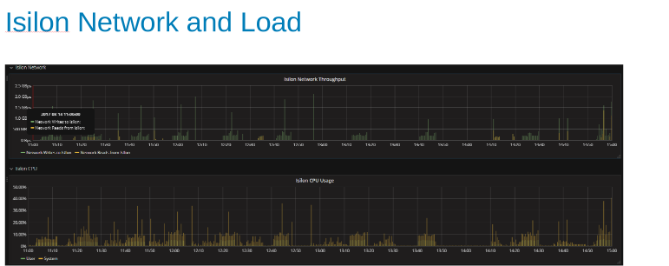
The network and CPU graphs tell us that the Isilon cluster is underutilized and has room for more work. CPU would be > 80%, and network bandwidth would be more than 3 GB/s.
Plots of the HDFS protocol statistic and CPU utilization while under HDFS Protocol load (Figure 5)
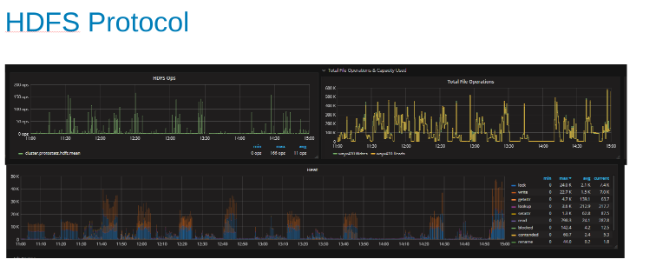
These plots show the HDFS protocol statistics and how OneFS translates the output. The HDFS ops are multiples of dfs.blocksize which is 256MB here. The interesting thing here is that the 'Heat' graph shows the OneFS file operations and the correlation of writes and locks is shown. In this case, HBase is doing appends to the WAL's so OneFS locks the WAL file for each write that is appended. Which is what is expected for stable writes on a clustered file system. These would appear to be contributing to the limiting factor in this set of tests.
HBase Updates
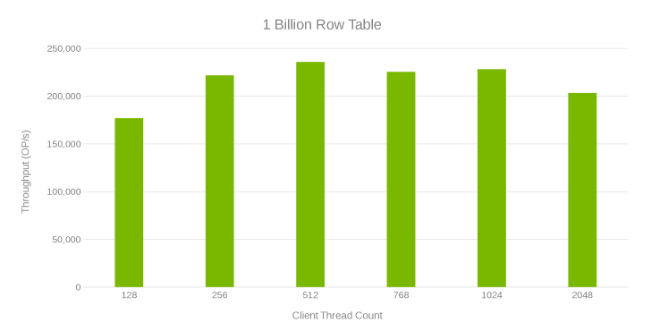
This next test was to do more experimenting to find what happens at scale. A 1-Billion-row table is created which took an hour to generate. A YCSB test is run that updated 10 million of the rows using the 'workloada' settings (50/50 read/write). This test was run on a single client. The test ran as a function of the number of YCSB threads so that the most throughput can be generated. Also, some tuning was applied and OneFS was upgraded to v8.0.1.1 which has performance tweaks for the Data node service. The following chart shows the bump up in performance compared to the previous set of runs. For these runs, the hbase.regionserver.maxlogs is set to 256 and the hbase.wal.regiongrouping.numgroups to 20.
Throughput and Thread Count while updating 1-Billion row table (Figure 6)
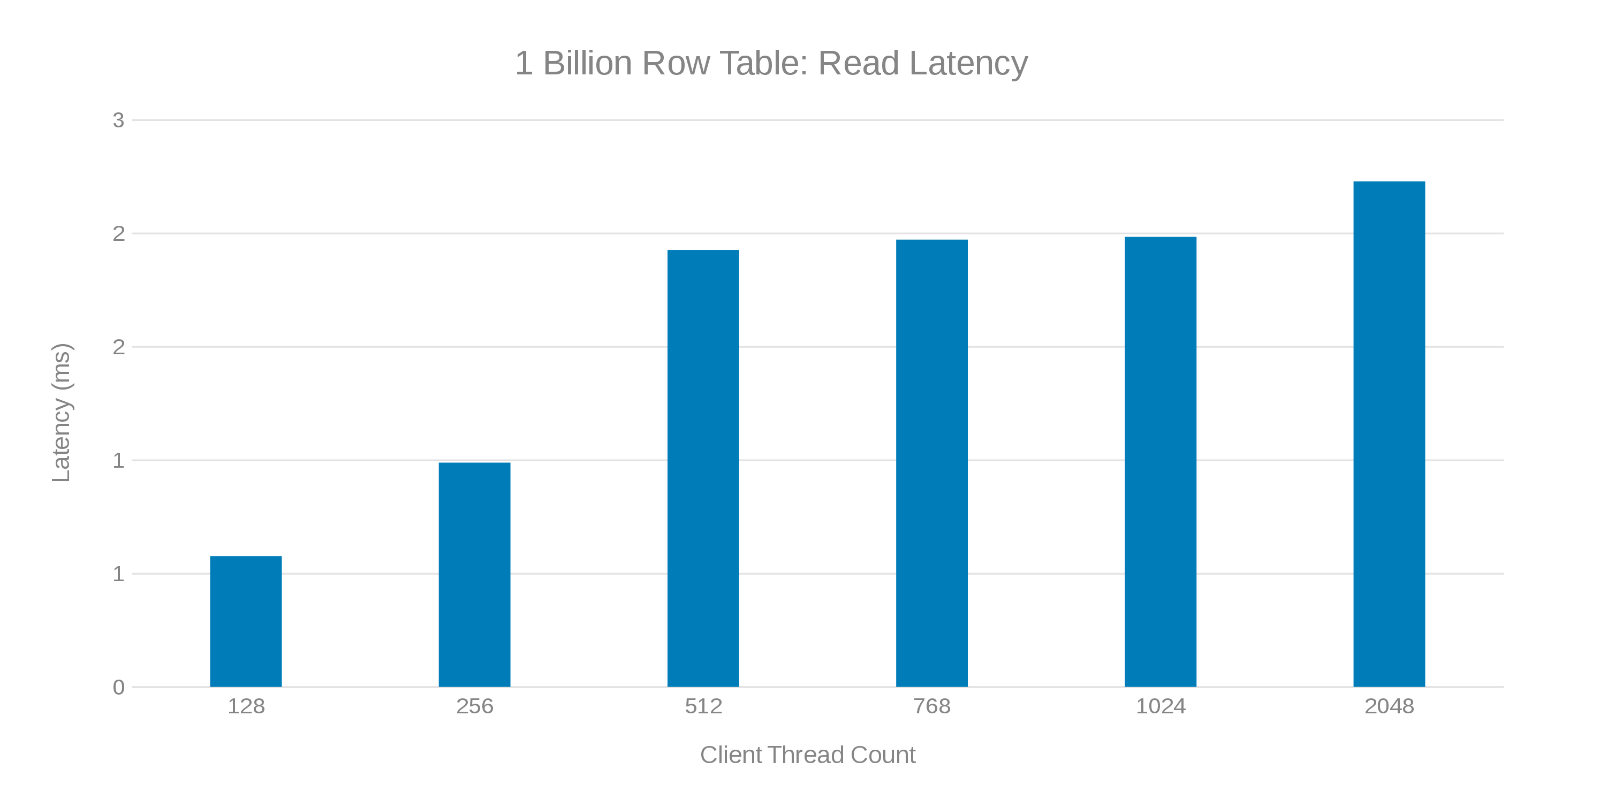
Read Latency while updating 1-Billion row table (Figure 7)
Update Latency while updating 1-Billion row table (Figure 8)
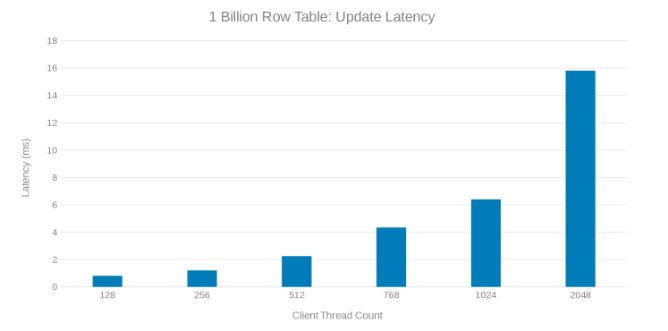
Review of these test runs show an apparent fall off at high thread count which can be either an Isilon or client-side issue. Testing shows and impressing 200 Thousand Operations per second at an update latency of < 3 ms. Each of the update test runs was fast and could be run consecutively. The graph below shows an even balance across the Isilon nodes for each test run.
Heat graph indicating workload across each node in the Isilon Cluster (Figure 9)
The Heat graph shows that the file operations are writes and locks corresponding to the append nature of the WAL processes.
Region Server Scaling
The next test was to determine how the Isilon nodes (five nodes) would fare against a different number of region servers. The same update script ran in the previous test was run involving a One-Billion-row table, and a 10 million-row update using 'workloada'. The test used a single client with YCSB threads set to 51. The same setting for the maxlogs and pipelines are applied (256 and 20 respectively).
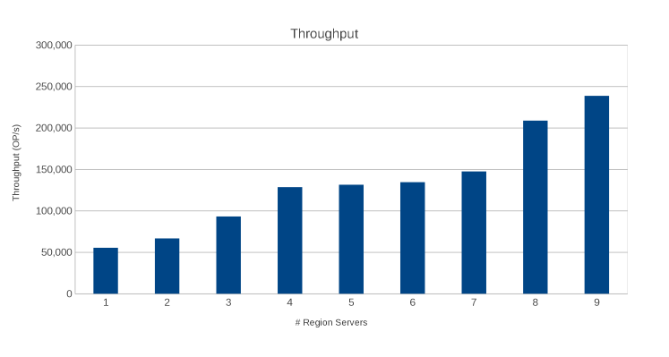
Throughput across Region Servers (Figure 10)
Latency across Region Servers (Figure 11)
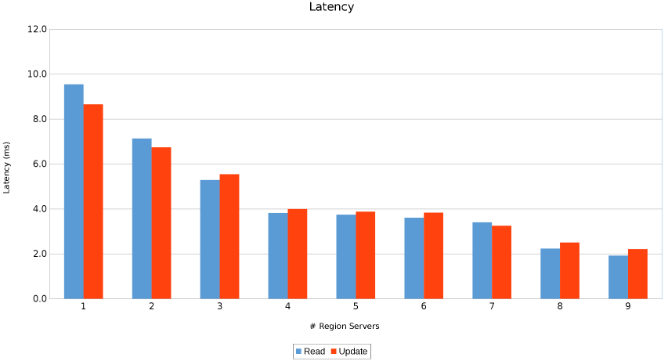
The results are informative, albeit not surprising. The scale-out nature of HBase combined with the scale-out nature of Isilon indicated that more is better. This test is recommended for clients to run in their environments as part of their own sizing exercise. Here there are nine servers pushing five Isilon nodes and it looks like there is still room for more before reaching the point of diminishing returns.
More Clients
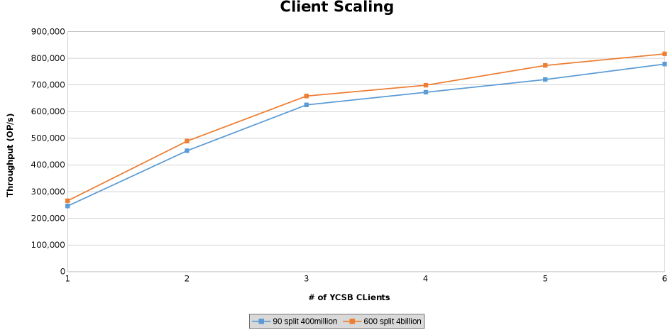
The last series of tests served to test the limits of the hardware configuration. This was done to determine the upper limit on the parameters being tested. In this series of tests, two additional servers are used to run clients from. In addition, two YCSB clients are run from each server which allowed up to six clients each. Each client drove 512 threads resulting in 4096 threads overall. Two different tables were created. One table with 4 Billion rows split into 600 regions and another with 400 million rows split into 90 regions.
This graphs the operations throughput while testing Client Scaling (Figure 12).
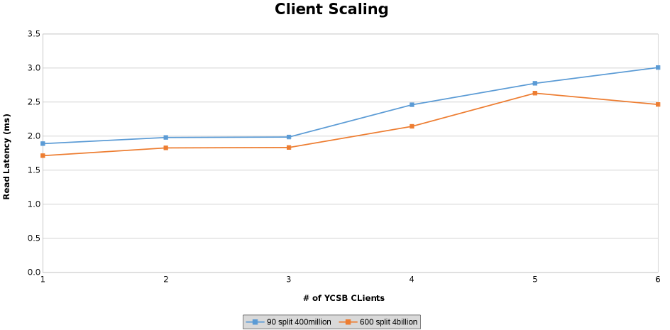
Measurement of Read latency while testing Client Scaling (Figure 13)
Measurement of Update Latency while testing Client Scaling (Figure 14)
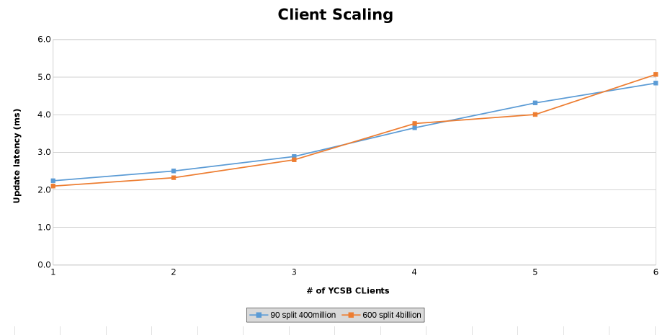
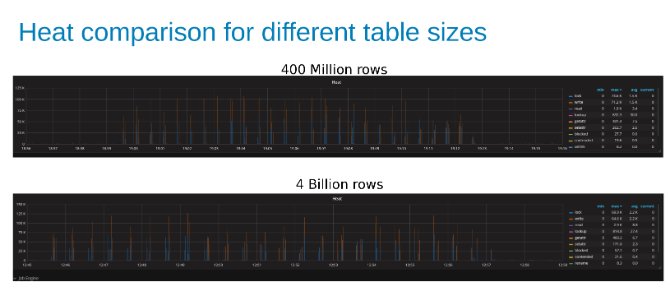
The graphs below show that the size of the table matters little in this test. The Isilon Heat charts again show that there is a few percentage difference in the number of file operations. Most differences were inline with the differences of a four-Billion-row table to a 400-Million-row table.
Comparison of Isilon workload Heat while updating a 400-Million-Row table compared to a 4-Billion-Row table (Figure 15).
Conclusion
HBase is a good candidate for running on Isilon, mainly because of the scale-out to scale-out architectures. HBase does a lot of its own caching and by splitting the table across a good number of regions, HBase can scale-out with the data. In other words, it does a good job of taking care of its own needs, and the file system is there for application resilience. Testing was unable to push the load to the point of breaking things. If the HBase is designed for 800,000 operations with less than 3 ms of latency, this architecture supports it. HBase supports a myriad of performance adjustments and tweaks for both the client side and HBase itself. Testing of all those adjustments and tweaks was beyond the scope of this test.Productos afectados
Isilon, PowerScale OneFSPropiedades del artículo
Número del artículo: 000128942
Tipo de artículo: Solution
Última modificación: 11 mar 2026
Versión: 7
Encuentre respuestas a sus preguntas de otros usuarios de Dell
Servicios de soporte
Compruebe si el dispositivo está cubierto por los servicios de soporte.