Dell Unity: Gathering Necessary Unity Performance Analysis Information
Сводка: This article shows how to gather logs and data to diagnose Unity array performance issues.
Инструкции
ISSUE
-
Poor Read or Write (or both) performance or high response times for connected hosts.
-
Response times for host applications have increased or are unacceptably high.
-
Performance problems on a Dell Unity array, which requires performance analysis.
Performance issues can have several causes. These include:
- Network configuration
- Congestion
- Host configuration
- Hardware faults
- Disk contention (several busy LUNs sharing the same drives)
- The storage array is at its maximum utilization
Unity Technical Support cannot fully investigate and troubleshoot performance issues until the following information is been provided:
- Service Data File (Data Collect)
- UPA files (Unity Performance Archives)
- A detailed description of the symptoms experienced in the production environment.
Failure to promptly provide the information in this Dell Knowledgebase Article (KB) can result in longer resolution times.
Detailed issue information (For example: symptoms and timestamps) helps engineers focus quickly; without it, time is spent locating the issue instead of analyzing its cause.
SCOPE
Customer Support Services investigate performance cases to identify issues impacting production environments. Performance tuning and system reconfiguration are the responsibility of a Storage Administrator or Solutions Architect and are not done in break-fix service requests.
Service requests without a defined issue—such as requests for workload reports—are outside the scope of break-fix support. For self-help or those needing help with determining the level of workload on an array can use the LiveOptics service. See the following article for detailed information about this option:
DATA and INFORMATION REQUIREMENTS FOR A DETAILED PERFORMANCE ANALYSIS
For each event, Technical Support needs the following logs and information which cover the incident period:
- Service Data Files (also known as Data Collects), generated shortly after the issue occurred.
- If Replication is in use, then Data Collects and UPA files from both arrays is needed.
- Unity UPA files (Unity Performance Archives), which cover the whole period when the problem was occurring.
- Host Grabs and Switch logs may also be required if the problem appears to be outside of the array.
- Unity Network Traces may also be required.
BLOCK ISSUES
- Problem Description and Impact
- Problem Statement: Provide a clear and detailed description of the problem.
- Current Impact: How is performance being measured? What is the specific impact? (For example: Host-side delays or errors, end-users reporting slowness, so on.)
- Business Impact: Quantify the impact (For example: Specific affected applications, number of affected servers, number of affected users).
- Data Availability: Is there currently, or was there at any time, that data was unavailable event?
- Timing and Frequency
- Timestamp: When exactly did (does) the problem happen? (Provide Date, Time, and Time Zone.)
- Frequency: How often does the problem happen? (Constantly/Regularly or One-Time/Randomly)
- Concurrent Tasks: Is anything else running at the specified time? (For example: Backups, batch jobs, virus scans, Host Disk Optimization (
TRIM/UNMAP), so on.)
- Scope and Affected Entities
- Affected LUNs: Which specific LUNs are affected? (Note: This is important to narrow down the search.)
- Affected Hosts: What are the names of the affected hosts/servers?
- Environment and Configuration
- Topology: What protocol or topology is used? (Fibre Channel, iSCSI, or Ethernet?)
- iSCSI Note: If using iSCSI, verify that it is not being routed over the internal LAN and that Enterprise-class switches are used. Also, all hosts must have
TCP Delayed ACKdisabled. - Reference: Dell KB Dell Unity: Facts, limitations, and recommended settings when using iSCSI (User Correctable)
- Network Connectivity: If the issue appears to be related to connectivity, provide a network topology diagram.
- Data Reduction: Is Data Reduction enabled on the affected LUNs? Is it enabled for other LUNs on the array?
- Reference: [Docu69891] Dell Unity: Best Practices Guide, page 11
- Replication: Is Replication currently in use?
- What is the target Recovery Point Objective (RPO) for Replication?
- Does the performance issue improve if Replication is temporarily paused?
- iSCSI Note: If using iSCSI, verify that it is not being routed over the internal LAN and that Enterprise-class switches are used. Also, all hosts must have
- Topology: What protocol or topology is used? (Fibre Channel, iSCSI, or Ethernet?)
- History and Recent Changes
- Historical Baseline: If something is not working as it should, did it ever work correctly in the past?
- New Implementations: Is this part of a new implementation or setup?
- Environment Changes: Were any new applications or hosts added recently? Have there been any recent changes in the SAN environment (hosts, switches, array)?
- Network Status: Is there a known network problem occurring simultaneously, or has the network been upgraded recently?
FILE ISSUES
- Problem Description and Impact
- Problem Statement: Provide a clear and detailed description of the problem.
-
Resource Scope: Is the issue related to a specific export/share, file system, or NAS Server?
- Protocol and Access Details
- Protocols in Use: What protocols are involved? (For example: NFS (version), CIFS/SMB (version), NDMP, iSCSI, FTP, so on.)
- Protocols in Use: What protocols are involved? (For example: NFS (version), CIFS/SMB (version), NDMP, iSCSI, FTP, so on.)
- Timing and Workload Context
- Timestamp: When exactly did (does) the problem happen? (Provide Date, Time, and Time Zone.)
- Frequency: How often does the problem happen? (Constantly/Regularly or One-Time/Randomly)
- Concurrent Tasks: What activity is occurring at the time? (For example: Logins, logouts, backups, batch jobs, virus scans, so on.)
- Scope and Affected Entities
- Affected Hosts: Which systems are involved? (For example: Backup servers, VMs, workstations, application servers, so on.)
- Application Details: What applications are involved? Provide relevant details.
- Environment and Configuration
- Network Layout: Describe the network configuration.
- Interface Details: Provide specific interface/NIC details.
- Traffic Segmentation: Are network functions isolated across NICs? (For example: Replication traffic on a dedicated NIC.)
COLLECTING SERVICE DATA FILE (DATA COLLECT)
To gather Service Data File (Data Collect), see Dell Unity: How to Gather Service Data Collects (Logs) From A Unity Array (User Correctable). The output files from running Service datafile on the array are necessary to show the detailed array configuration and any events which occurred on the array. Support recommends that customers gather the Service Data File (Data Collect) as soon as possible after the event occurs.
Keep in mind that the Service datafile contains the last complete UPA file (one hour) and any available -tmp.archive UPA file. Often, this is not enough information for a proper performance review and additional UPAs are required.
To find the UPA file within the Service Data File (Data Collect), go to spx\cmd_outputs\metrics\
-
spx= Primary SP -
Example: If SPA is the active SP, the UPA is under
spa\cmd_outputs\metrics
COLLECTING UPA FILES
- Support may ask for additional UPA files.
- Unlike the Service Data File (Data Collect), the array stores at up to 48 hours of UPA files.
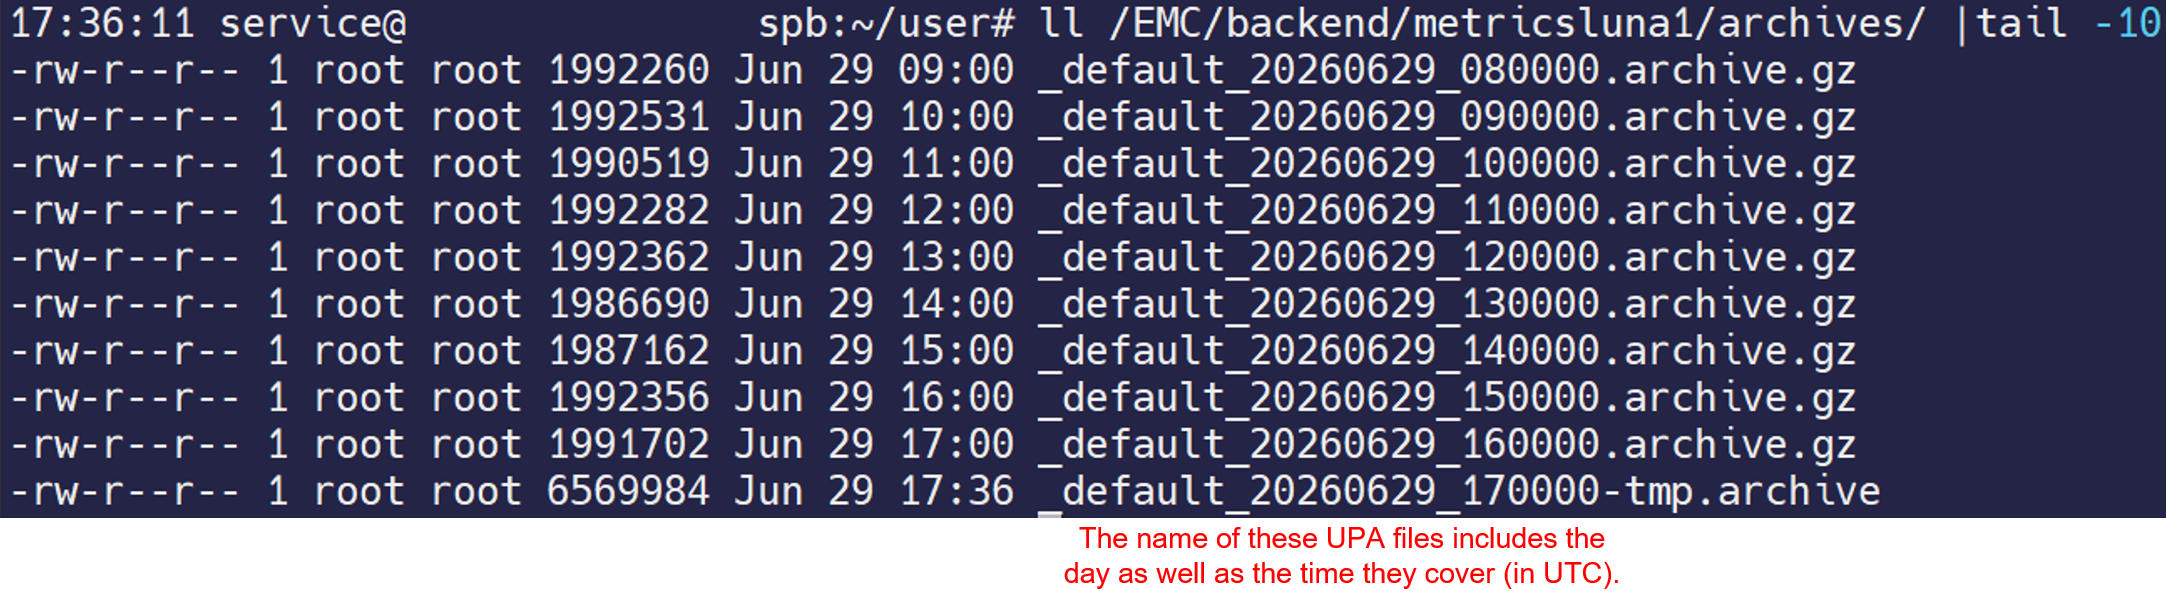
- The UPA files look like the below example. Each file name contains the date and time of the first data point in the file. The interval is 10 seconds and covers one hour minus 10 seconds. The date and times in the filenames are UTC/GMT.
- The last UPA file in the example below is the most current archive (
-tmp.archive). This contains the current performance data and can be copied from the array (using SSH/CLI only) to look at the most current data. Support can use this file to see performance events without waiting until the next hour.
- The last UPA file in the example below is the most current archive (
Example of UPA files stored on the Dell Unity array:
01/05/2017  10:59 AM        11,017,216 _default_20170105_150000.archive
01/05/2017  11:59 AM        11,017,216 _default_20170105_160000.archive
01/05/2017  01:00 PM        11,017,216 _default_20170105_170000.archive
01/05/2017  01:59 PM        10,983,424 _default_20170105_180000.archive
01/05/2017  02:45 PM         8,308,736 _default_20170105_190000-tmp.archive
Option 1: Unisphere List
This option is only available for Unity OE 4.2 and later versions. All available UPAs may not be listed here. There is a limitation to the UI (Unisphere) and only some available files can be listed. If the required UPA file is not listed, move to Option 2 or use SSH/CLI.
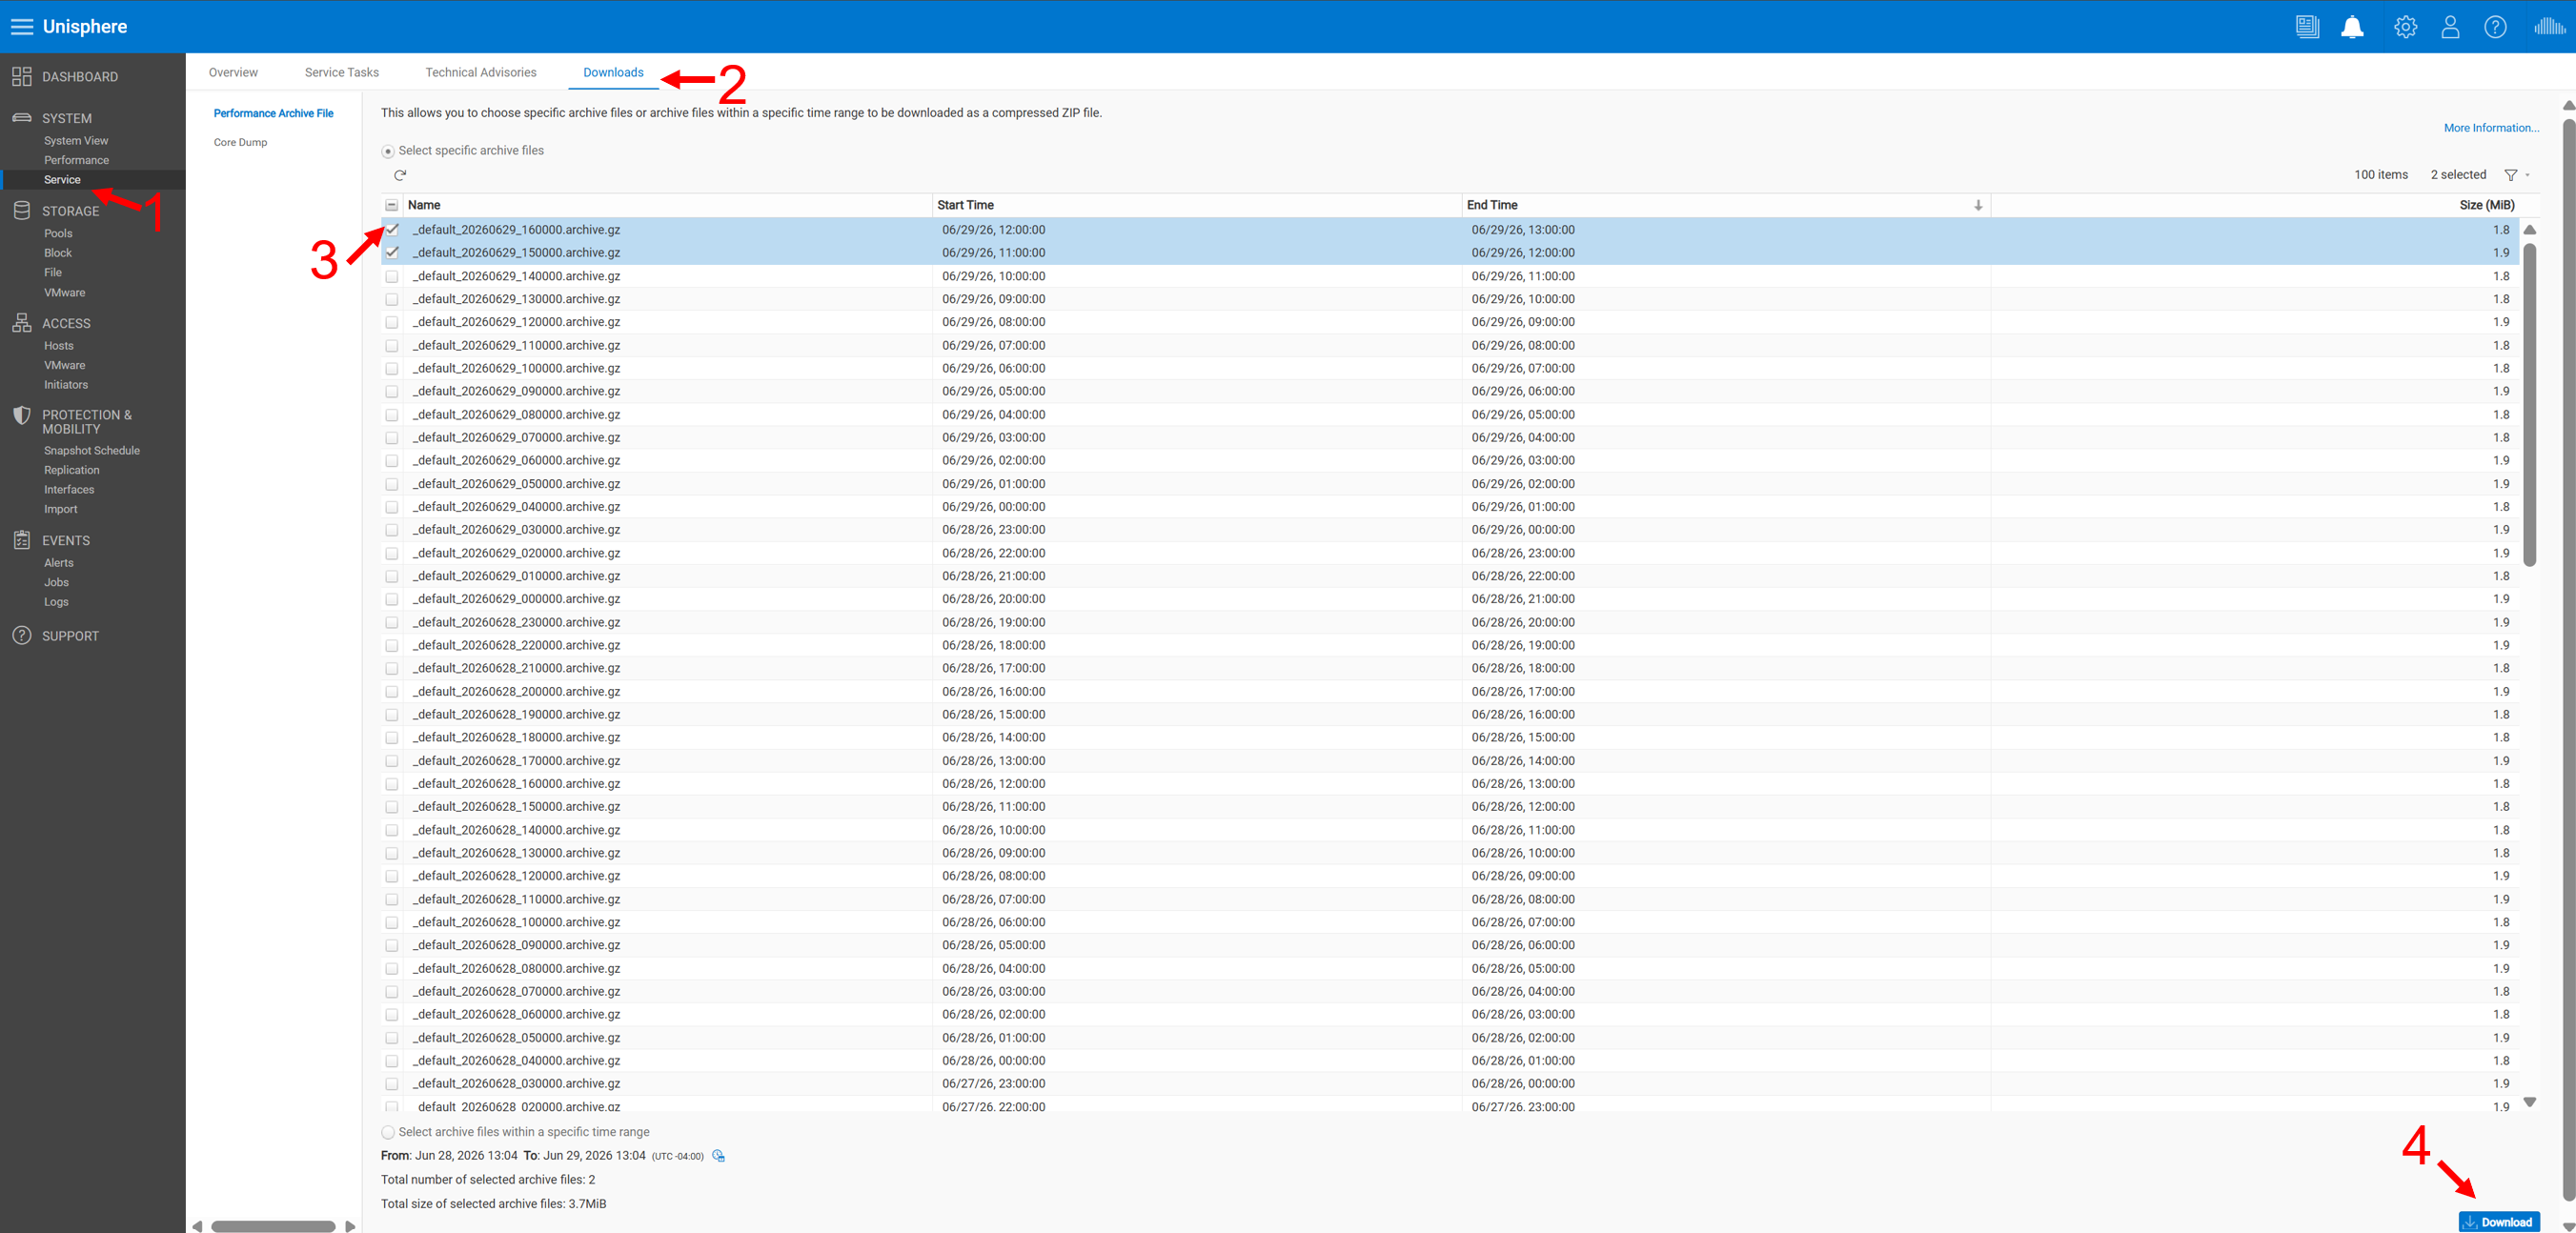
Figure 1. Unisphere UI
Option 2: Unisphere Time Range
- You can select a time range for the system to pull available UPAs. Confirm the issue time prior to gathering logs so that only the necessary logs are downloaded.
- Keep in mind, the Customer Time range is in the local browser time and is often the same as the current workstation time.
- This option is only available for Unity OS 4.2 and later versions.
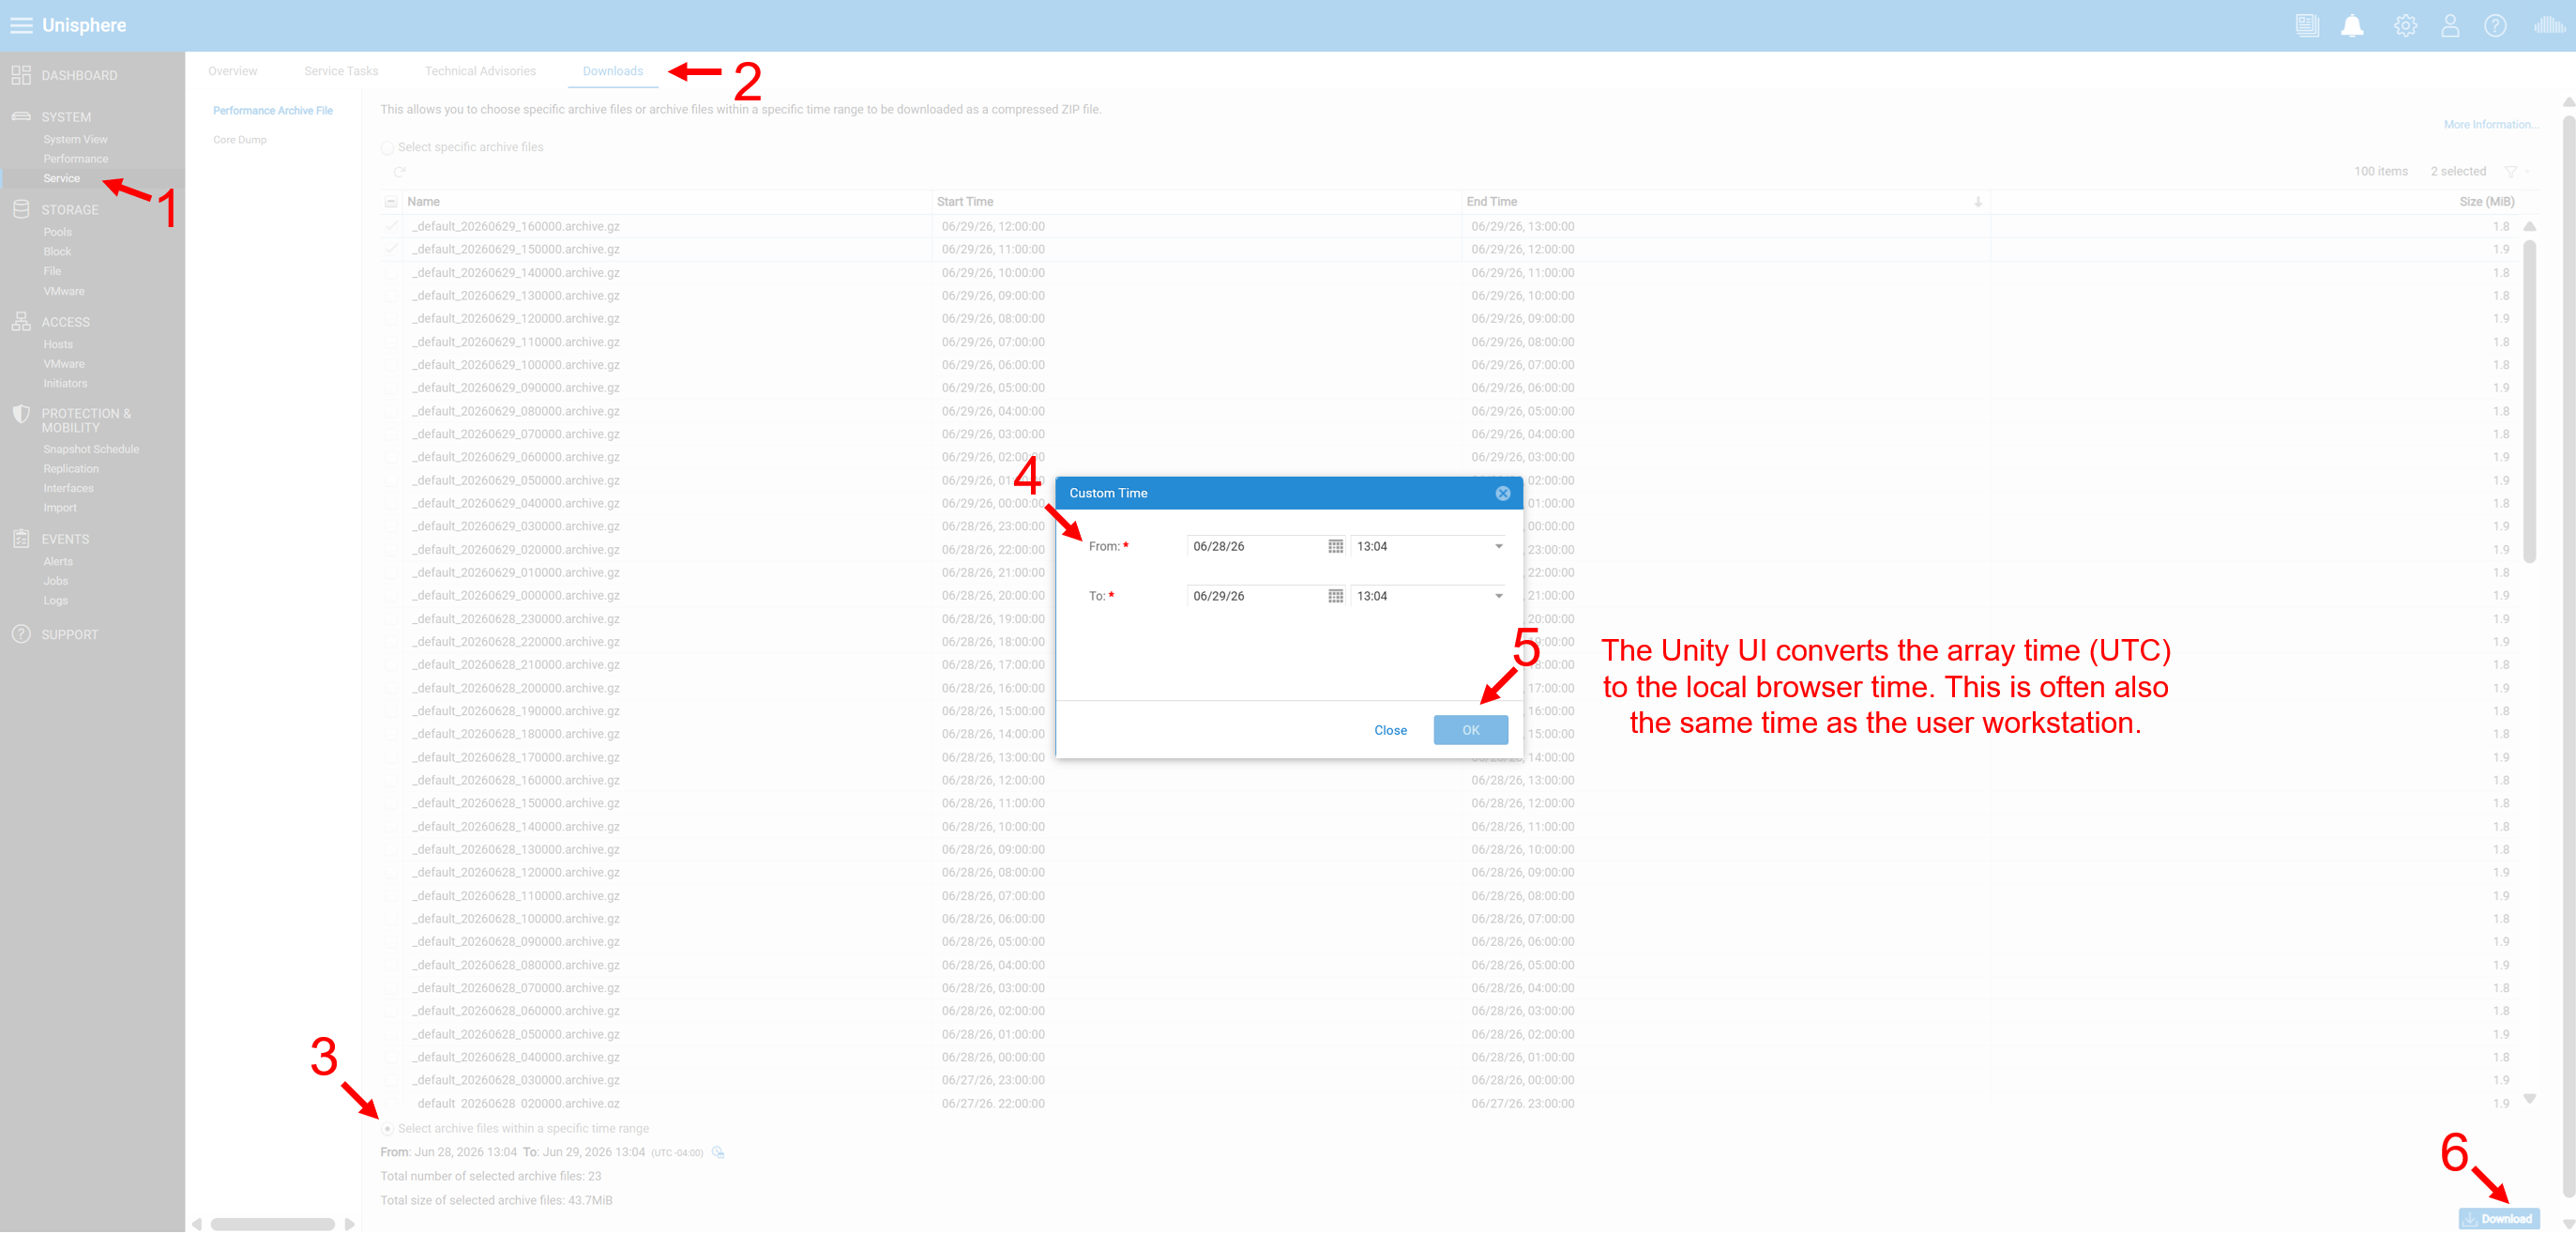 Figure 2. Customize Time
Using SSH/CLI
The CLI can also access additional UPAs on Unity arrays that are not visible in Unisphere (Option 1).
-
Log in with the service user and the service password
-
Copy the wanted logs to
/cores/service/userfrom/EMC/backend/metricsluna1/archives -
Download these logs using
WinSCPor a similar tool-
If the array is on Unity OS 4.5.X or later, change the file protocol to
SCP. -
Log in with the service user and the service password.
-
ll /EMC/backend/metricsluna1/archives/
cp /EMC/backend/metricsluna1/archives/_default_20230221_180000.archive.gz /cores/service/user
|tail-10 as there are dozens of UPA files available on the backend; however, you can list them all.
HOST DATA COLLECTION
Host Grab (or EMC Report) output files may be needed, especially if the issue is unique to specific hosts.
-
Go to https://www.dell.com/support/home/ (Dell Support Site) and search for the Grab Utility for the correct host OS (For example: ESXi host grab)
-
Download the utility and the README file.
-
Follow the README file to run the utility for the host operating system chosen.
SWITCH LOGS
If the performance issue only exists on certain paths, switch logs may be required. See the following KB articles for instructions (based on the model being used):
Brocade/Connectrix
- Connectrix Switches: How to collect Switch Logs (Primary)
- Connectrix: How to Collect a Switch Log File Using PuTTY
NETWORK TRACE CAPTURES (TCP DUMP)
Some File Performances issues may be related to network issues. In order to fully determine the cause of a problem, support may request network traces.
Dell Unity: How to capture a TCP/IP network trace from the array. (User Correctable)