PowerEdge: Dell Ready Solutions for HPC BeeGFS High-Performance Storage
Summary: Dell Ready Solutions for HPC BeeGFS High-Performance Storage
This article applies to
This article does not apply to
This article is not tied to any specific product.
Not all product versions are identified in this article.
Instructions
Article written by Nirmala Sundararajan of the Dell HPC and AI Innovation Lab in November 2019
Table of Contents
- Introduction
- Solution Reference Architecture
- Hardware and Software configuration
- Solution Configuration Details
- R740xd, 24x NVMe Drives, Details on CPU Mapping
- Performance Characterization
- Conclusion and Future Work
Introduction
Dell HPC team proudly announces the release of the "Dell EMC Ready Solutions for HPC BeeGFS Storage" which is the latest addition to the HPC storage portfolio. This solution uses R740xd servers, each with 24x Intel P4600 1.6TB NVMe, Mixed-Use Express Flash drives and two Mellanox ConnectX-5 InfiniBand EDR adapters. In this 24 NVMe drive configuration, 12x NVMe SSDs connect to a PCIe switch and each switch is connected to one CPU using a x16 PCIe extender card. Moreover, each IB interface is connected to one CPU. Such a balanced configuration with each CPU connected to one InfiniBand adapter and handling 12 NVMe SSDs provides maximum performance by ensuring that the processors are equally occupied in handling I/O requests to and from the NVMe drives.
The focus of the solution is high performance I/O, and it has been designed as a high-speed scratch solution. At the core of the solution is the use of high speed NVMe SSDs that offer high bandwidth and low latency by removing the scheduler and queueing bottlenecks from the block layer. The BeeGFS file system also supports high aggregate I/O throughput.
Solution Reference Architecture
Figure 1 shows the reference architecture of the solution. The management server is only connected using Ethernet to the metadata and storage servers. Each metadata and storage server have two InfiniBand links and is connected to the private network over Ethernet. The clients have one InfiniBand link and are connected to the private interface over Ethernet.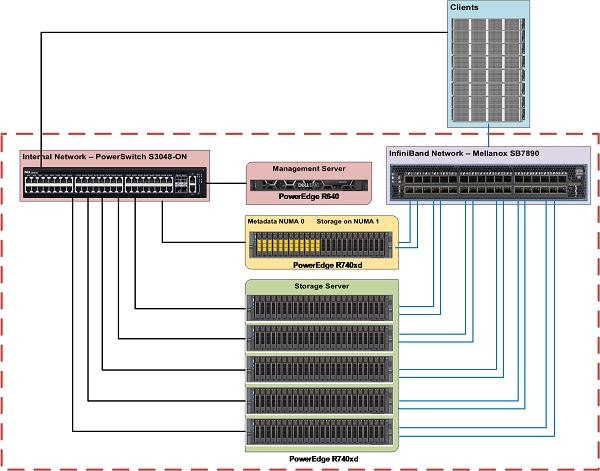
Figure 1: Dell Ready Solutions for HPC BeeGFS Storage - Reference Architecture
Hardware and Software configuration
Tables 1 and 2 describe the hardware specifications of management server and metadata/storage server respectively. Table 3 describes the software versions used for the solution.
| Table 1 PowerEdge R640 Configuration (Management Server) | |
|---|---|
| Server | Dell PowerEdge R640 |
| Processor | 2x Intel Xeon Gold 5218 2.3 GHz, 16 cores |
| Memory | 12 x 8GB DDR4 2666MT/s DIMMs - 96GB |
| Local Disks | 6 x 300GB 15K RPM SAS 2.5in HDDs |
| RAID Controller | PERC H740P Integrated RAID Controller |
| Out of Band Management | iDRAC9 Enterprise with Lifecycle Controller |
| Power Supplies | Dual 1100W Power Supply Units |
| BIOS Version | 2.2.11 |
| Operating System | CentOS™ 7.6 |
| Kernel Version | 3.10.0-957.27.2.el7.x86_64 |
| Table 2 PowerEdge R740xd Configuration (Metadata and Storage Servers) | |
|---|---|
| Server | Dell EMC PowerEdge R740xd |
| Processor | 2x Intel Xeon Platinum 8268 CPU @ 2.90GHz, 24 cores |
| Memory | 12 x 32GB DDR4 2933MT/s DIMMs - 384GB |
| BOSS Card | 2x 240GB M.2 SATA SSDs in RAID 1 for OS |
| Local Drives | 24x Dell Express Flash NVMe P4600 1.6TB 2.5" U.2 |
| Mellanox EDR card | 2x Mellanox ConnectX-5 EDR card (Slots 1 & 8) |
| Out of Band Management | iDRAC9 Enterprise with Lifecycle Controller |
| Power Supplies | Dual 2000W Power Supply Units |
| Table 3 Software Configuration (Metadata and Storage Servers) | |
|---|---|
| BIOS | 2.2.11 |
| CPLD | 1.1.3 |
| Operating System | CentOS™ 7.6 |
| Kernel Version | 3.10.0-957.el7.x86_64 |
| iDRAC | 3.34.34.34 |
| Systems Management Tool | OpenManage Server Administrator 9.3.0-3407_A00 |
| Mellanox OFED | 4.5-1.0.1.0 |
| NVMe SSDs | QDV1DP13 |
| *Intel ® Data Center Tool | 3.0.19 |
| BeeGFS | 7.1.3 |
| Grafana | 6.3.2 |
| InfluxDB | 1.7.7 |
| IOzone Benchmark | 3.487 |
Solution Configuration Details
The BeeGFS architecture consists of four main services:
- Management service
- Metadata Service
- Storage Service
- Client Service
Except for the client service which is a kernel module, the management, metadata, and storage services are user space processes. Figure 2 illustrates how the reference architecture of the Dell EMC Ready Solutions for HPC BeeGFS Storage maps to the general architecture of the BeeGFS file system.
Figure 2: BeeGFS File system on PowerEdge R740xd with NVMe SSDs
Management Service
Each BeeGFS file system or namespace has only one management service. The management service is the first service which must be set up because when we configure all other services, they must register with the management service. A PowerEdge R640 is used as the management server. In addition to hosting the management service (beegfs-mgmtd.service), it also hosts the monitoring service (beegfs-mon.service) which collects statistics from the system and provides them to the user, using the time series database InfluxDB. For visualization of data, beegfs-mon provides predefined Grafana panes that can be used out of the box. The management server has 6x 300GB HDDs configured in RAID 10 for the Operating System and InfluxDB.
Metadata Service
The metadata service is a scale-out service, which means that there can be many metadata services in a BeeGFS file system. However, each metadata service has exactly one metadata target to store metadata. On the metadata target, BeeGFS creates one metadata file per user-created file. BeeGFS metadata is distributed on a per-directory basis. The metadata service provides the data striping information to the clients and is not involved in the data access between file open/close.
A PowerEdge R740xd with 24x Intel P4600 1.6TB NVMe, drives are used for metadata storage. As the storage capacity requirements for BeeGFS metadata are very small, instead of using a dedicated metadata server, only the 12 drives on NUMA zone 0 were used to host the Meta-Data Targets (MDTs), while the remaining 12 drives on NUMA zone host Storage Targets (STs).
Figure 3 shows the metadata server. The 12 drives enclosed in the yellow rectangle are the MDTs in the NUMA zone 0 whereas the 12 drives enclosed in the green rectangle are the STs in the NUMA zone 1. This configuration not only avoids NUMA issues but also provides enough metadata storage to facilitate scaling the capacity and performance as needed.
Figure 3: Metadata Server
Figure 4 shows the raid configuration of the metadata server. It highlights how in the metadata server, the drives in the NUMA zone 0 host the MDTs and those in NUMA zone 1 host the storage data, while the storage servers host the STs in both the NUMA zones.

Figure 4: Configuration of drives in the Metadata Server
The 12 drives used for metadata are configured as 6x RAID 1 disk group of two drives, each serving as an MDT. There are six metadata services running each of which handles one MDT. The remaining 12 storage drives are configured in 3x RAID 0 disk groups of four drives each. There are three storage services running on the NUMA 1 zone, one service for each ST. So, the server which co-hosts the metadata and Storage Targets has 6 MDTs and 3 STs. It also runs six metadata services and three storage services. Each MDT is an ext4 file system based on a RAID 1 configuration. The STs are based on an XFS file system configured in RAID 0.
Storage Service
Like the metadata service, the storage service is also a scale-out service. There can be many instances of the storage service in a BeeGFS file system. However, unlike the metadata service, there can be several storage targets per storage service. The storage service stores the striped user file contents, also known as data chunk files.
Figure 5 shows the 5x PowerEdge R740xd servers used as storage servers.
Figure 5: Dedicated Storage Servers
Each storage server is configured with 6x RAID 0 groups, each of four drives, thus hosting 6 STs per server (3 per NUMA zone), as shown in Figure 6 given below:
Figure 6: Configuration of drives in the Storage Servers
In total, the base reference architecture configuration hosts 6 MDTs and 33 STs. Having five dedicated storage servers provides a raw capacity of 211 TB and a usable capacity of 190TiB. The estimated usable capacity in TiB = Number of drives x capacity per drive in TB x 0.99 (file system overhead) x (10^12/2^40). This would be ideal as a mid-range scratch solution with enough metadata storage to facilitate adding more storage servers as capacity requirements increase.
In view of the following factors, a RAID 0 configuration was chosen for storage targets over RAID 10 configuration.
- Write performance was measured using dd command by creating a 10GB file of 1MB block size and direct I/O for data, for RAID 0 devices the average was about 5.1 GB/s to each device whereas for RAID 10 devices the average was 3.4GB/s to each device.
- StorageBench benchmark tests showed that maximum throughput was 5.5 GB/s for the RAID 0 configuration whereas it is 3.4 GB/s for a RAID 10 configuration. These results are like what was obtained using dd commands.
- RAID 10 provides 50% utilization of the disk capacity and a similar 50% reduction in write performance. Using RAID 10 is an expensive way to obtain storage redundancy.
- NVMe drives are expensive and offer speedups which are best used in a RAID 0 configuration
Client Service
The BeeGFS client module must be loaded on to all the hosts that must access the BeeGFSs file system. When the beegfs-client is loaded, it mounts the file systems defined in the /etc/beegfs/beegfs-mounts.conf file instead of the usual approach based on /etc/fstab. Adopting this approach starts the beegfs-client like any other Linux service through the service startup script. It also enables the automatic recompilation of the BeeGFS client module after system updates.
When the client module is loaded, it mounts the file systems defined in the beegfs-mounts.conf. It is possible to mount multiple beegfs instances on the same client as shown below:
$ cat /etc/beegfs/beegfs-mounts.conf
/mnt/beegfs-medium /etc/beegfs/beegfs-client-medium.conf
/mnt/beegfs-small /etc/beegfs/beegfs-client-small.conf
The above example shows two different file systems mounted on the same client. For the purpose of this testing, 32x C6420 nodes were used as clients.
R740xd, 24x NVMe Drives, Details on CPU Mapping
In the 24xNVMe configuration of the PowerEdge R740xd server, there are two x16 NVMe bridge cards feeding PCIe switch on the backplane that fans out and feeds the drives (drives are x4) in the front as shown in Figure 7 below:
Figure 7: R740xd, 24x NVMe Details on CPU Mapping
In Non-Uniform Memory Access (NUMA), system memory is divided into zones called nodes, which are allocated to CPUs or sockets. Access to memory that is local to a CPU is faster than memory connected to remote CPUs on the system. A threaded application typically performs best when the threads are accessing memory on the same NUMA node. The performance impact of NUMA misses is significant, generally starting at a 10% performance hit or higher. To improve performance, the services are configured to use specific NUMA zones to avoid unnecessary use of UPI cross-socket links thereby reducing latency. Each NUMA zone handles 12 drives and uses one of the two InfiniBand EDR interfaces on the servers. This NUMA separation is achieved by manually configuring NUMA balancing by creating custom systemd unit files and by configuring multihoming. Hence the automatic NUMA balancing is disabled, as shown below:
# cat /proc/sys/kernel/numa_balancing
0
Figure 8 shows the testbed where the InfiniBand connections to the NUMA zone are highlighted. Each server has two IP links, and the traffic through NUMA 0 zone is handed by interface IB0 while the traffic through NUMA 1 zone is handled by interface IB1.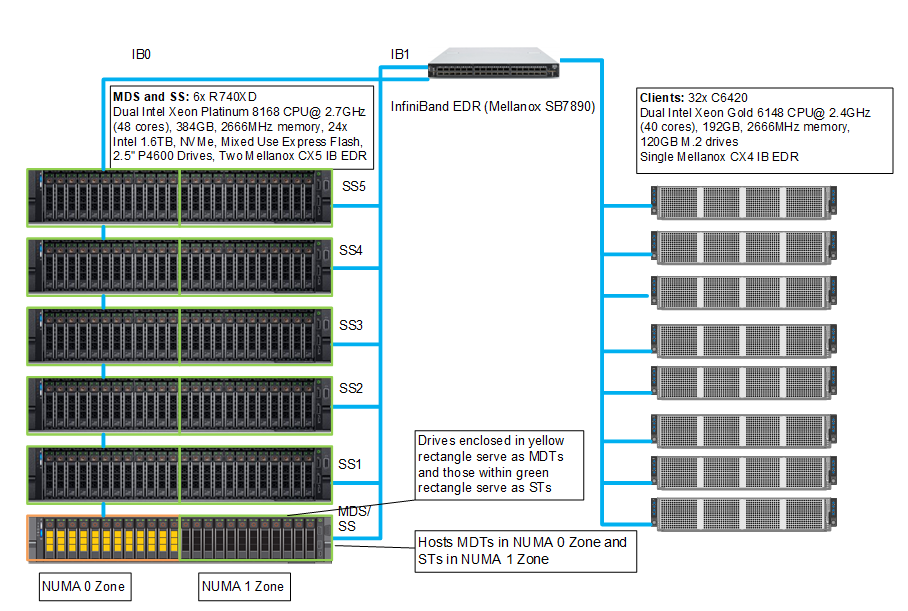
Figure 8: Testbed Configuration
Performance Characterization
This section presents the performance evaluation that helps characterize Dell EMC Ready Solution for HPC BeeGFS High-performance Storage Solution. For further details and updates, please look for a white paper that will be published later. The system performance was evaluated using the IOzone benchmark. The solution is tested for sequential read and write throughput, and random read and write IOPS. Table 4 describes the configuration of the C6420 servers that were used as BeeGFS clients for the performance studies in this blog.
| Table 4 Client Configuration | |
|---|---|
| Clients | 32x Dell PowerEdge C6420 Compute Nodes |
| BIOS | 2.2.9 |
| Processor | 2x Intel Xeon Gold 6148 CPU @ 2.40GHz with 20 cores per processor |
| Memory | 12 x 16GB DDR4 2666 MT/s DIMMs - 192GB |
| BOSS Card | 2x 120GB M.2 boot drives in RAID 1 for OS |
| Operating System | Red Hat Enterprise Linux Server release 7.6 |
| Kernel Version | 3.10.0-957.el7.x86_64 |
| Interconnect | 1x Mellanox ConnectX-4 EDR card |
| OFED Version | 4.5-1.0.1.0 |
Sequential Writes and Reads N-N
To evaluate sequential reads and writes, the IOzone benchmark was used in the sequential read and write mode. These tests were conducted on multiple thread counts starting at one thread and increasing in powers of 2, up to 1024 threads. At each thread count, an equal number of files were generated since this test works on one file per thread or the N clients to N file (N-N) case. The processes were distributed across 32 physical client nodes in a round robin or cyclical fashion so that the requests are equally distributed and there is load balancing. An aggregate file size of 8TB was selected which was equally divided among the number of threads within any given test. The aggregate file size was chosen large enough to minimize the effects of caching from the servers and from BeeGFS clients. IOzone was run in a combined mode of write then read (-i 0, -i 1) to allow it to coordinate the boundaries between the operations. For this testing and results, we used a 1MB record size for every run. The commands used for Sequential N-N tests are given below:
Sequential Writes and Reads:
iozone -i 0 -i 1 -c -e -w -r 1m -I -s $Size -t $Thread -+n -+m /path/to/threadlist
OS caches were also dropped or cleaned on the client nodes between iterations and between write and read tests by running the command:
# sync && echo 3 > /proc/sys/vm/drop_caches
The default stripe count for Beegfs is 4. However, the chunk size and the number of targets per file can be configured on a per-directory basis. For all these tests, BeeGFS stripe size was chosen to be 2MB and the stripe count was chosen to be 3 since we have three targets per NUMA zone as shown below:
$ beegfs-ctl --getentryinfo --mount=/mnt/beegfs /mnt/beegfs/benchmark --verbose
EntryID: 0-5D9BA1BC-1
ParentID: root
Metadata node: node001-numa0-4 [ID: 4]
Stripe pattern details:
+ Type: RAID0
+ Chunksize: 2M
+ Number of storage targets: desired: 3
+ Storage Pool: 1 (Default)
Inode hash path: 7/5E/0-5D9BA1BC-1
The transparent huge pages were disabled, and the following tuning options are in place on the metadata and storage servers:
vm.dirty_background_ratio = 5
vm.dirty_ratio = 20
vm.min_free_kbytes = 262144
vm.vfs_cache_pressure = 50
vm.zone_reclaim_mode = 2
kernel.numa_balancing = 0
In addition to the above, the following BeeGFS tuning options were used:
tuneTargetChooserparameter was set to "roundrobin" in the metadata configuration filetuneNumWorkersparameter was set to 24 for metadata and 32 for storageconnMaxInternodeNumparameter was set to 32 for metadata and 12 for storage and 24 for clients

Figure 9: Sequential IOzone 8TB aggregate file size.
In Figure 9, we see that peak read performance is 132 GB/s at 1024 threads and peak write is 121 GB/s at 256 threads. Each drive can provide 3.2 GB/s peak read performance and 1.3 GB/s peak write performance, which allows a theoretical peak of 422 GB/s for reads and 172 GB/s for writes. However, here the network is the limiting factor. We have a total of 11 InfiniBand EDR links for the storage servers in the setup. Each link can provide a theoretical peak performance of 12.4 GB/s which allows a theoretical peak performance of 136.4 GB/s. The achieved peak read and write performance are 97% and 89% respectively of the theoretical peak performance.
The single thread write performance is observed to be ~3 GB/s and read at ~3 GB/s. We observe that the write performance scales linearly, peaks at 256 threads and then starts decreasing. At lower thread counts read and write performance are the same. Because until eight threads, we have eight clients writing eight files across 24 targets which mean, not all storage targets are being fully used. We have 33 storage targets in the system and hence at least 11 threads are needed to fully use all the servers. The read performance registers a steady linear increase with the increase in the number of concurrent threads, and we observe almost similar performance at 512 and 1024 threads.
We also observe that the read performance is lower than writes for thread counts from 16 to 128 and then the read performance starts scaling. This is because while a PCIe read operation is a Non-Posted Operation, requiring both a request and a completion, a PCIe write operation is a fire and forget operation. Once the Transaction Layer Packet is handed over to the Data Link Layer, the operation completes. A write operation is a "Posted" operation that consists of a request only.
Read throughput is typically lower than the write throughput because reads require two transactions instead of a single write for the same amount of data. The PCI Express uses a split transaction model for reads. The read transaction includes the following steps:
- The requester sends a Memory Read Request (MRR).
- The completer sends out the acknowledgment to MRR.
- The completer returns a Completion with Data.
The read throughput depends on the delay between the time that the read request is issued and the time the completer takes to return the data. However, when the application issues enough number of read requests to cover this delay, then throughput is maximized. That is the reason why while the read performance is less than that of the writes from 16 threads to 128 threads, we measure an increased throughput when the number of requests increases. A lower throughput is measured when the requester waits for completion before issuing subsequent requests. A higher throughput is registered when multiple requests are issued to amortize the delay after the first data returns.
Random Writes and Reads N-N
To evaluate random IO performance, IOzone was used in the random mode. Tests were conducted on thread counts starting from 4 threads to up to 1024 threads. Direct IO option (-I) was used to run IOzone so that all operations bypass the buffer cache and go directly to the disk. BeeGFS stripe count of 3 and chunk size of 2MB was used. A 4KiB request size is used on IOzone. Performance is measured in I/O operations per second (IOPS). The OS caches were dropped between the runs on the BeeGFS servers and BeeGFS clients. The command used for performing the random writes and reads is given below:
Random reads and writes:
iozone -i 2 -w -c -O -I -r 4K -s $Size -t $Thread -+n -+m /path/to/threadlist

Figure 10: Random Read and Write Performance using IOzone wth 8TB aggregate file size.
The random writes peak at ~3.6 Million IOPS at 512 threads and the random reads peak at ~3.5 Million IOPS at 1024 threads as shown in Figure 10. Both the write and read performance show a higher performance when there are a higher number of IO requests. This is because NVMe standard supports up to 64K I/O queue and up to 64K commands per queue. This large pool of NVMe queues provides higher levels of I/O parallelism and hence we observe IOPS exceeding 3 Million.
Conclusion and Future Work
This blog announces the release of the Dell EMC High Performance BeeGFS Storage Solution and highlights its performance characteristics. The solution has a peak sequential read and write performance of ~132 GB/s and ~121 GB/s respectively and the random writes peak at ~3.6 Million IOPS and random reads at ~3.5 Million IOPS.
This blog is part one of "BeeGFS Storage Solution" which has been designed with a focus on scratch space with high performance. Stay tuned for Part 2 of the blog series that will describe how the solution can be scaled by incrementing the number of servers to increase performance and capacity. Part 3 of the blog series will discuss additional features of BeeGFS and will highlight the use of "StorageBench," the built-in storage targets benchmark of BeeGFS.
As a part of the next steps, we will be publishing a white paper later with the metadata performance and the N threads to one file IOR performance and with additional details about design considerations, tuning, and configuration.
References
[1] BeeGFS Documentation: https://www.beegfs.io/wiki/
[2] How to connect two interfaces on the same subnet: https://access.redhat.com/solutions/30564
Affected Products
PowerSwitch S3048-ON, Mellanox SB7800 Series, PowerEdge R640, PowerEdge R740XDArticle Properties
Article Number: 000130963
Article Type: How To
Last Modified: 08 Sept 2025
Version: 9
Find answers to your questions from other Dell users
Support Services
Check if your device is covered by Support Services.