NRE 17.x: How to Clear Java Cache, Enable Java Console, and Debugging
Summary: This article provides an overview of how to clear Java cache, enable Java console, and configure Java debug on Microsoft Windows systems using NetWorker Runtime Environment (NRE) to access the NetWorker Management Console (NMC). ...
Instructions
NetWorker Runtime Environment (NRE) provides the Java Runtime Environment (JRE) used by the NetWorker authentication service and NetWorker Management Console (NMC).
Terms used to differentiate systems:
- NMC Server: The system where the NMC server package is installed and
gstdservice runs. - NMC Client: Any host used to access the NMC.
This article can be broken up into the following sections:
- NMC Service debugging. When to use:
- NMC server (
gstd) service is failing to start. - Operations within the NMC are producing unexpected errors.
- Default logging levels are inconclusive.
- NMC server (
- Java Logging. When to use:
- Operations within the NMC are producing unexpected errors.
- Default logging levels are inconclusive.
- Issues are observed on the NMC client.
- NetWorker Runtime Environment debugging:
- NMC server service is operational.
- NMC fails to launch on NMC client.
- Java Cache and Heap Diagnostic.
- NMC is behaving abnormally on NMC client (slow, closing, unexpected errors).
Expand the below sections to see specific troubleshooting steps:
NMC Server Service (GSTD) Debug
GSTD) DebugDebugging can be enabled on the NMC's GST service. The method used is dependent on the type if issue.
Debug levels and their primary use cases are outlined in: NetWorker: Debug information levels
Approach One: NMC is not accessible, the NMC server service is failing to start.
Linux:
- On the NMC server , open an elevated shell.
- Create a copy of the NMC service control script:
cp /opt/lgtonmc/etc/gst_linux.sh /opt/lgtonmc/etc/gst_linux.sh.orig- Open the original script with a text editor:
vi /opt/lgtonmc/etc/gst_linux.sh
- Search for the
Starting GST. Add-D9after$gstdin the Starting GST block, example:
   echo_n "Starting GST: "
      if [ -x "$gstd" ] ; then
          "$gstd" -D9
          code=$?
          echo "done."
- Start the NMC service using the startup script:
/opt/lgtonmc/etc/gst_linux.sh start- Collect and review the output.
When debugging is no longer needed, revert to the original file, or remove -D9 from the Starting GST block. Manage the service using normal systemctl or service commands. For example systemctl start gst
Windows:
- On the NMC server, open an elevated prompt.
- Change directory (cd) to the NMC bin directory:
cd "C:\Program Files\EMC NetWorker\Management\GST\bin"- Start the service with debugging enabled:
.\gstd.exe -D9- Collect and review the output
Approach Two: NMC is accessible and specific actions from NMC are being investigated:
- From the NMC's Enterprise screen, click the Setup tab.
- Click the Setup menu and select System Options.

- From System Options, set the Debug Level as required, typically 9.

- No service restart is required, perform actions from NMC requiring debug.
- Render the
gstd.rawfrom the NMC server.
Linux: /opt/lgtonmc/logs/gstd.raw
Windows (Default): C:\Program Files\EMC NetWorker\Management\GST\logs\gstd.raw
To render .raw files, see article NetWorker: How to use nsr_render_log to render .raw log files
- Collect the rendered
gstd.rawfile from the NMC server.
Java Logging Option One - Enable Java Console
Java Logging Option One - Enable Java Console
This approach is useful for when you want to observe the Java Console events while performing actions directly within the NMC. This can be used for persistent issues, or an issue that can be reproduced on demand. This output can also be logged to a file.
- Open Windows File Explorer and go to "
C:\Program Files\OpenWebStart" - Open itw-settings.exe (OpenWebStart Console).
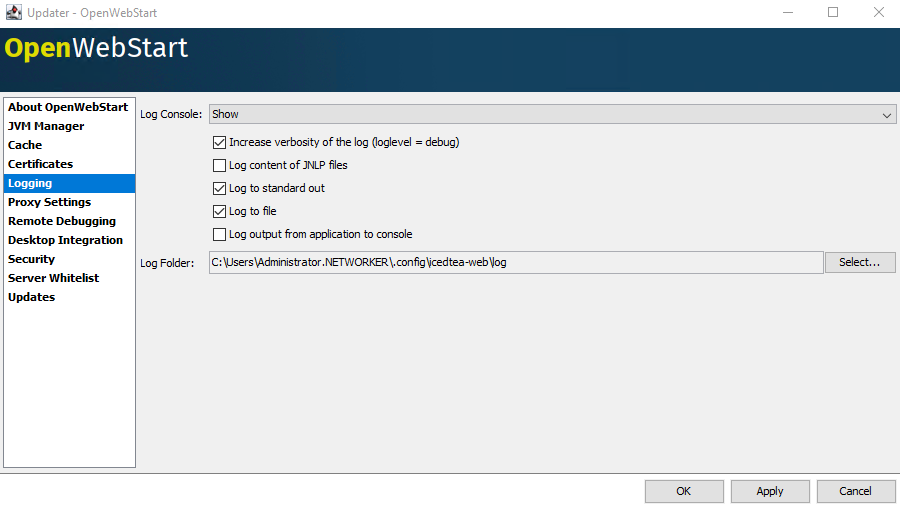
- Go to Logging.
- Select the following options:
- Log Console: Show
- Increase verbosity of the log (debug)
- Log to standard output (logs to the console)
- Log to file (logs to log file)
- Optional: Change the location of the log folder. If this is not changed, the log output is logged to
C:\Users\USER-NAME\.config\icedtea-web\log.
- Click Apply, then click Ok.
Java Logging Option Two - Log to a File
Java Logging Option Two - Log to a File
This approach is useful for when you do not need the Java logging console open but would like to capture events to a log file. This is useful for intermittent issues or issues that cannot be easily reproduced on demand.
- On the NetWorker Management Console (NMC) server, open the
gconsole.jnlpfile in a text editor.
- Linux:
/opt/lgtonmc/web/gconsole.jnlp - Windows (Default): C:\Program Files\EMC NetWorker\Management\GST\web\gconsole.jnlp
- In the
application-descsection, add the following options:
<argument>-f</argument>
<argument>C:\\Program Files\\NRE\\logs\\java1.log</argument>
Example:
<application-desc main-class="COM.legato.gwt.framework.LMainWindow">
		<argument>-g</argument>
		<argument>IPADDR_REPLACE_AT_RUNTIME(fe80::d3e7:121a:e342:3332)</argument>
		<argument>-p</argument>
		<argument>gconsole</argument>
		<argument>-i</argument>
		<argument>false</argument>
		<argument>-s</argument>
		<argument>X_NO_SERVER_X</argument>
		<argument>-P</argument>
		<argument>X_NO_SERVER_PORT_X</argument>
		<argument>-t</argument>
		<argument>X_NO_TASK_X</argument>
		<argument>-h</argument>
		<argument>9000</argument>
		<argument>-n</argument>
		<argument>9001</argument>
		<argument>-b</argument>
		<argument>5432</argument>
		<argument>-A</argument>
		<argument>9090</argument>
		<argument>-d</argument>
		<argument>0</argument>
		<argument>-a</argument>
		<argument>X_NO_AUTH_X</argument>
		<argument>-m</argument>
		<argument>X_NO_ISSUER_X</argument>
		<argument>-f</argument>
		<argument>C:\\Program Files\\NRE\\logs\\java1.log</argument>
</application-desc>
- On the host used to access the NMC, download a new
gconsole.jnlpfrom a we browser:https://NMC_SERVER_ADDRESS:9000/gconsole.jnlp - Launch the NMC using the new
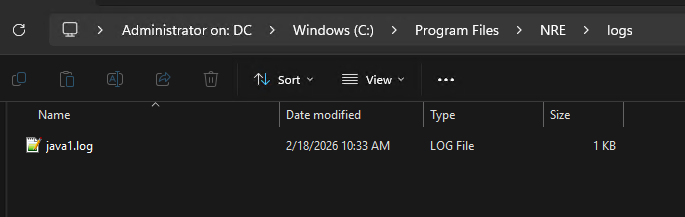
gconsole.jnlpfile. - The
java1.logis created on the host accessing the NMC:
Java Logging - Enabling Java Debug in the NMC Console
- Enable either Java Console or Java log file debug as per the above sections.
- Launch the NetWorker Management Console's (NMC)
gconsole.jnlpfile. - Log in to the NMC.
- From the Enterprise window,
CTRL+SHIFT+Right-Click - Click Save Debug Messages… and specify an output location.

- In the Enterprise window, again
- From Set Debug Level, select the wanted debug level. Usually, 7

- Perform actions within NMC which require debug. Copy the output from the Java Console session and collect the Java output file that is created in step 5.
- To disable debug, repeat the process but set Debug Off.
Enabling NetWorker Runtime Environment (NRE) Debug
Enabling NetWorker Runtime Environment (NRE) Debug
Enable Java Logging Option Two
NRE debug can be configured inside the NRE C:\Program Files\NRE\logs\logConfig.properties file. The default log debug level is WARNING.
The supported Log Levels from lowest to highest are:
OFF
SEVERE
WARNING
INFO
CONFIG
FINE
FINER
FINEST
ALL
Clearing Java Cache
Clearing Java Cache
- Open Windows File Explorer and go to "
C:\Program Files\OpenWebStart" - Open
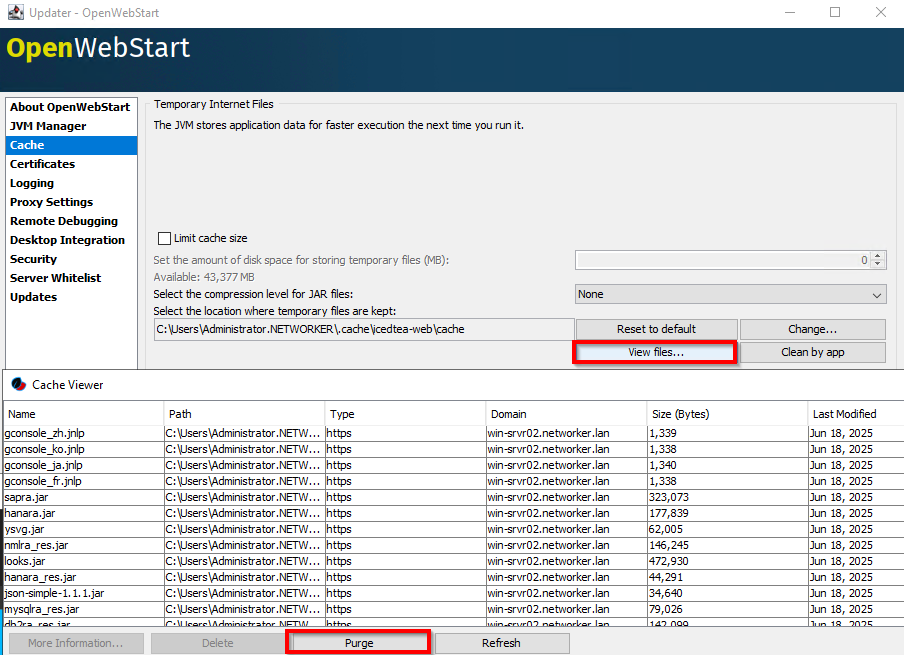
itw-settings.exe(OpenWebStart Console). - Go to Cache
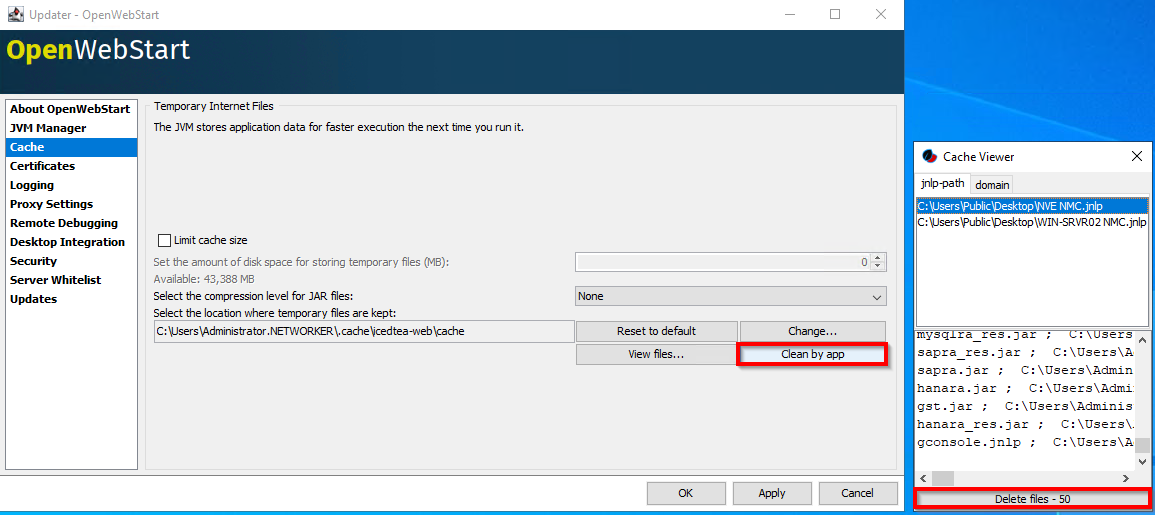
- Use one of the following options to remove all the files (purge), or remove the files for specific NMC server connection.
Option One: Click View Files. Click Purge to remove all the java cache files:
Option Two: From Cache Viewer, click Clean by app. Select the NMC gconsole.jnlp for a specific NMC server, click Delete Files.
NMC Heap Diagnostic
NMC Heap Diagnostic
The NetWorker Management Console (NMC) uses a Java Runtime on the host accessing the console. The console uses the file gconsole.jnlp, which it downloads from the NMC server. You may observe "running out of memory" or "Java heap space" errors in the NMC. The NMC heap limit is allocated memory limit; that said these errors may appear even though the host accessing the NMC still has sufficient memory available. This is expected behavior when performing some operations in the NMC, particularly in larger environments, or environments with a lot of data.
- Open an Administrator Command-Prompt or PowerShell.
- Change directory to your NetWorker Runtime Environment (NRE) java bin directory. For example:
PS C:\Users\administrator.AMER> cd "C:\Program Files\NRE\java\"
PS C:\Program Files\NRE\java> dir


    Directory: C:\Program Files\NRE\java


Mode                 LastWriteTime         Length Name
----                 -------------         ------ ----
d-----         1/19/2026   4:55 PM                jdk-17.0.17


PS C:\Program Files\NRE\java> cd .\jdk-17.0.17\bin
PS C:\Program Files\NRE\java\jdk-17.0.17\bin>
- Get the Process ID (PID) of the
java.exeprocess associated with OpenWebStart:
Get-CimInstance Win32_Process | Where-Object { $_.Name -like "*java*" } | Select-Object ProcessId, Name, CommandLine
Example:
PS C:\Program Files\NRE\java\jdk-17.0.17\bin> Get-CimInstance Win32_Process | Where-Object { $_.Name -like "*java*" } | Select-Object ProcessId, Name, CommandLine

ProcessId Name       CommandLine
--------- ----       -----------
     1352 javaws.exe "C:\Program Files\OpenWebStart\javaws.exe" "C:\Users\administrator.AMER\Downloads\gconsole.jnlp"
     7644 java.exe   "C:\Program Files\NRE\java\jdk-17.0.17\bin\java.exe" "-Xbootclasspath/a:C:\Program Files\OpenWebStart\openwebstart.jar" "-Dicedtea-web.bin.location=C:\Program Files\OpenWebStart\javaws" -Xms512M -Xmx2048M -Djava.locale.providers=COMPAT -Djava.util.Arrays.useLegacyMergeSort=true --add-reads=java.base=ALL-UNNAMED,java.desktop --add-reads=java.d...
jcmd to check the Java Virtual Machine (VM) settings and GC details:
.\jcmd.exe PID VM.flags
.\jcmd.exe PID GC.heap_info
Example:
PS C:\Program Files\NRE\java\jdk-17.0.17\bin> .\jcmd.exe 7644 VM.flags
7644:
-XX:CICompilerCount=2 -XX:ConcGCThreads=1 -XX:G1ConcRefinementThreads=2 -XX:G1EagerReclaimRemSetThreshold=8 -XX:G1HeapRegionSize=1048576 -XX:GCDrainStackTargetSize=64 -XX:InitialHeapSize=536870912 -XX:MarkStackSize=4194304 -XX:MaxHeapSize=2147483648 -XX:MaxNewSize=1287651328 -XX:MinHeapDeltaBytes=1048576 -XX:MinHeapSize=536870912 -XX:NonNMethodCodeHeapSize=5826188 -XX:NonProfiledCodeHeapSize=122916026 -XX:ProfiledCodeHeapSize=122916026 -XX:ReservedCodeCacheSize=251658240 -XX:+SegmentedCodeCache -XX:SoftMaxHeapSize=2147483648 -XX:+UseCompressedClassPointers -XX:+UseCompressedOops -XX:+UseFastUnorderedTimeStamps -XX:+UseG1GC -XX:-UseLargePagesIndividualAllocation

PS C:\Program Files\NRE\java\jdk-17.0.17\bin> .\jcmd.exe 7644 GC.heap_info
7644:
 garbage-first heap   total 524288K, used 112318K [0x0000000080000000, 0x0000000100000000)
  region size 1024K, 103 young (105472K), 2 survivors (2048K)
 Metaspace       used 22772K, committed 23168K, reserved 1114112K
  class space    used 2530K, committed 2752K, reserved 1048576K
| Metric | Value |
| Heap Reserved (max) | Up to 2 GB |
| Heap Currently Committed (initial) | 512 MB |
| Heap used | ~110 MB |
| Metaspace | ~22 MB |
The above jmcd commands may need to be run intermittently or alongside NMC heap errors to observe heap conditions. It may also be necessary to script and monitor the heap conditions at set intervals to observe any consistent patterns.