ECS: OBS: xDoctor: RAP025: Una o más interfaces de red están inactivas o faltan
Resumen: xDoctor informa un error de precaución que indica que una de las interfaces de ECS está inactiva hasta los switches.
Síntomas
A partir de ECS xDoctor v4.8-109.0 y ObjectScale xDoctor v5.1-109.0, RAP025 (una o más interfaces de red están inactivas o faltan) se implementa como un corrector automático. Cuando los problemas de conectividad de los switches superan el umbral configurado de gravedad Error o Critical , xDoctor genera una alerta RAP025 e inicia automáticamente su flujo de trabajo de orquestación de reparación integrada. Este flujo de trabajo realiza las acciones de corrección necesarias si se habilitan los autorcorrectores de xDoctor.
Nota: Si en su entorno se ejecuta una versión de xDoctor anterior a ECS xDoctor v4.8-109.0 u ObjectScale xDoctor v5.1-109.0, la funcionalidad de reparación automática RAP025 no está disponible. En estas versiones, la corrección se debe realizar mediante el proceso de Autopilot que se describe a continuación o siguiendo los pasos de corrección manual que se describen en la sección Resolución.
Alerta que activa la autorreparación de RAP025
El flujo de trabajo de autorreparación de RAP025 se activa cuando se detecta una falla en la interfaz del nodo que cruza el umbral de gravedad Error o Critical configurado. Una vez que se supera este umbral, xDoctor genera una alerta RAP025, que sirve como desencadenante para el proceso de reparación automatizada.
Ejemplo de salida de alerta
Nota: En las versiones de xDoctor anteriores a ECS xDoctor v4.8-109.0 y ObjectScale xDoctor v5.1-109.0, esta condición solo genera una alerta. No se realiza una corrección automática.
----------------------------------------------
INFO - Auto Healer for interface_down disabled
----------------------------------------------
Extra     = Auto Healer for interface_down disabled
Timestamp = 2026-03-24_205634
PSNT      = CKM00190800120 @ 4.8-109.0

-------------------------------------------------------------------------------------
ERROR - (Cached) One or more network interfaces are down or missing
-------------------------------------------------------------------------------------
Node      = Nodes
Extra     = {"Nodes": {"169.254.1.4": ["pslave-1"]}}
RAP       = RAP025
Solution  = KB 503814
Timestamp = 2026-04-01_190513
PSNT      = CKMXXXXXXXXXXX @ 4.8-109.0
Corrección de curador automático (ejemplo)
Cuando se habilitan las autorreparaciones, xDoctor inicia automáticamente la corrección para la falla detectada de la interfaz del nodo mediante la aplicación de acciones correctivas comunes descritas en esta base de conocimientos.
----------------------------------------
FIXED - Auto Healer fixed interface_down
----------------------------------------
Node      = Nodes
Extra     = {"Nodes": {"169.254.1.1": ["pslave-0"]}}
Timestamp = 2026-04-01_190513
PSNT      = CKMXXXXXXXXXXX @ 4.8-109.0
Requisito de Auto Healing
Para que se lleve a cabo esta corrección, se debe habilitar la característica de reparación automática de xDoctor. Los correctores automáticos se pueden habilitar durante la instalación o después de la instalación siguiendo los pasos descritos en:
Base de conocimientos: ECS: xDoctor: Cómo habilitar xDoctor Auto Healer después de la instalación de la herramienta
Validación manual:
- Compruebe el estado del enlace de interfaz en el clúster. En el siguiente ejemplo, el nodo 4 indica NO-CARRIER, lo que significa que no hay conexión a la interfaz secondary-0.
# viprexec -i 'ip link show | egrep "slave-|public"'
admin@node1:~> viprexec -i 'ip link show | egrep "slave-|public"'

Output from host : 1xx.1xx.219.1
bash: public: command not found
3: slave-0: <BROADCAST,MULTICAST,SLAVE,UP,LOWER_UP> mtu 1500 qdisc mq master public state UP mode DEFAULT group default qlen 1000
5: slave-1: <BROADCAST,MULTICAST,SLAVE,UP,LOWER_UP> mtu 1500 qdisc mq master public state UP mode DEFAULT group default qlen 1000
10: public: <BROADCAST,MULTICAST,MASTER,UP,LOWER_UP> mtu 1500 qdisc noqueue state UP mode DEFAULT group default

Output from host : 1xx.1xx.219.2
bash: public: command not found
3: slave-0: <BROADCAST,MULTICAST,SLAVE,UP,LOWER_UP> mtu 1500 qdisc mq master public state UP mode DEFAULT group default qlen 1000
5: slave-1: <BROADCAST,MULTICAST,SLAVE,UP,LOWER_UP> mtu 1500 qdisc mq master public state UP mode DEFAULT group default qlen 1000
10: public: <BROADCAST,MULTICAST,MASTER,UP,LOWER_UP> mtu 1500 qdisc noqueue state UP mode DEFAULT group default

Output from host : 1xx.1xx8.219.3
bash: public: command not found
4: slave-0: <BROADCAST,MULTICAST,SLAVE,UP,LOWER_UP> mtu 1500 qdisc mq master public state UP mode DEFAULT group default qlen 1000
5: slave-1: <BROADCAST,MULTICAST,SLAVE,UP,LOWER_UP> mtu 1500 qdisc mq master public state UP mode DEFAULT group default qlen 1000
10: public: <BROADCAST,MULTICAST,MASTER,UP,LOWER_UP> mtu 1500 qdisc noqueue state UP mode DEFAULT group default

Output from host : 1xx.1xx.219.4
bash: public: command not found
2: slave-0: <NO-CARRIER,BROADCAST,MULTICAST,SLAVE,UP> mtu 1500 qdisc mq master public state DOWN mode DEFAULT group default qlen 1000
5: slave-1: <BROADCAST,MULTICAST,SLAVE,UP,LOWER_UP> mtu 1500 qdisc mq master public state UP mode DEFAULT group default qlen 1000
10: public: <BROADCAST,MULTICAST,MASTER,UP,LOWER_UP> mtu 1500 qdisc noqueue state UP mode DEFAULT group default
- Confirme que las interfaces individuales hayan detectado un enlace:
# viprexec -i "echo slave-0;sudo ethtool slave-0 | grep 'Link detected:';echo slave-1;sudo ethtool slave-1 | grep 'Link detected:'"
admin@node1:~> viprexec -i "echo slave-0;sudo ethtool slave-0 | grep 'Link detected:';echo slave-1;sudo ethtool slave-1 | grep 'Link detected:'" Output from host : 1xx.1xx.219.1 slave-0 Link detected: yes slave-1 Link detected: yes Output from host : 1xx.1xx.219.2 slave-0 Link detected: yes slave-1 Link detected: yes Output from host : 1xx.1xx.219.3 slave-0 Link detected: yes slave-1 Link detected: yes Output from host : 1xx.1xx.219.4 slave-0 Link detected: no slave-1 Link detected: yes
- Confirme si los switches son Arista en 1.ª o 2.ª generación y Dell (u otro modelo) en entornos de 3.ª generación.
# viprexec -i "sudo lldpcli show neigh | grep SysDescr"
1.ª o 2.ª gen.
admin@ecssh121:~> viprexec -i "sudo lldpcli show neigh | grep SysDescr"

Output from host : 1xx.1xx.219.1
    SysDescr:     Arista Networks EOS version 4.11.7.2 running on an Arista Networks DCS-7150S-24
    SysDescr:     Arista Networks EOS version 4.11.7.2 running on an Arista Networks DCS-7150S-24
    SysDescr:     Arista Networks EOS version 4.15.6M running on an Arista Networks DCS-7048T-A

Output from host : 1xx.1xx.219.2
    SysDescr:     Arista Networks EOS version 4.11.7.2 running on an Arista Networks DCS-7150S-24
    SysDescr:     Arista Networks EOS version 4.11.7.2 running on an Arista Networks DCS-7150S-24
    SysDescr:     Arista Networks EOS version 4.15.6M running on an Arista Networks DCS-7048T-A

Output from host : 1xx.1xx.219.3
    SysDescr:     Arista Networks EOS version 4.11.7.2 running on an Arista Networks DCS-7150S-24
    SysDescr:     Arista Networks EOS version 4.11.7.2 running on an Arista Networks DCS-7150S-24
    SysDescr:     Arista Networks EOS version 4.15.6M running on an Arista Networks DCS-7048T-A

Output from host : 1xx.1xx.219.4
    SysDescr:     Arista Networks EOS version 4.11.7.2 running on an Arista Networks DCS-7150S-24
    SysDescr:     Arista Networks EOS version 4.11.7.2 running on an Arista Networks DCS-7150S-24
    SysDescr:     Arista Networks EOS version 4.15.6M running on an Arista Networks DCS-7048T-A
Gen 3
admin@ecsnode1:~> viprexec -i "sudo lldpcli show neigh | grep SysDescr"

Output from host : 1xx.1xx.219.1
    SysDescr:     OS10
    SysDescr:     OS10
    SysDescr:     OS10
    SysDescr:     OS10

Output from host : 1xx.1xx.219.2
    SysDescr:     OS10
    SysDescr:     OS10
    SysDescr:     OS10
    SysDescr:     OS10

Output from host : 1xx.1xx.219.3
    SysDescr:     OS10
    SysDescr:     OS10
    SysDescr:     OS10
    SysDescr:     OS10

Output from host : 1xx.1xx.219.4
    SysDescr:     OS10
    SysDescr:     OS10
    SysDescr:     OS10
    SysDescr:     OS10

Output from host : 1xx.1xx.219.5
    SysDescr:     OS10
    SysDescr:     OS10
    SysDescr:     OS10
    SysDescr:     OS10

Output from host : 1xx.1xx.219.6
    SysDescr:     OS10
    SysDescr:     OS10
    SysDescr:     OS10
    SysDescr:     OS10

Output from host : 1xx.1xx.219.7
    SysDescr:     OS10
    SysDescr:     OS10
    SysDescr:     OS10
    SysDescr:     OS10

Output from host : 11xx.1xx.219.8
    SysDescr:     OS10
    SysDescr:     OS10
    SysDescr:     OS10
    SysDescr:     OS10
- Compruebe la configuración de la interfaz pública para vincular secondary-0 y secondary-1 para público en el nodo, lo que muestra que no hay ningún enlace detectado desde el comando en el paso 2:
# sudo cat /etc/sysconfig/network/ifcfg-public
admin@node4:~> sudo cat /etc/sysconfig/network/ifcfg-public
BONDING_MASTER=yes
BONDING_MODULE_OPTS="miimon=100 mode=4 xmit_hash_policy=layer3+4"
BONDING_SLAVE0=slave-0
BONDING_SLAVE1=slave-1
BOOTPROTO=static
IPADDR=xxx.xxx.xxx.xxx/xx
MTU=1500
STARTMODE=auto
- Confirme que el parámetro correcto del protocolo de control de agregación de enlaces (LACP) esté configurado en los nodos. (La agregación dinámica de enlaces IEEE 802.3ad es la configuración predeterminada y esperada).
Comando:
# viprexec -i "grep Mode /proc/net/bonding/public"
Ejemplo:
admin@node1:~> viprexec -i "grep Mode /proc/net/bonding/public"

Output from host : 1xx.1xx.219.1
Bonding Mode: IEEE 802.3ad Dynamic link aggregation

Output from host : 1xx.1xx.219.2
Bonding Mode: IEEE 802.3ad Dynamic link aggregation

Output from host : 1xx.1xx.219.3
Bonding Mode: IEEE 802.3ad Dynamic link aggregation

Output from host : 1xx.1xx.219.4
Bonding Mode: IEEE 802.3ad Dynamic link aggregation
- Ejecute lo siguiente para confirmar que las conexiones sean coherentes con los puertos y que las interfaces estén conectadas:
Ethernet10 = nodo 2
Ethernet11 = nodo 3
Ethernet12 = nodo 4
Ethernet13 = nodo 5
Ethernet14 = nodo 6
Ethernet15 = nodo 7
Ethernet16 = nodo 8
# viprexec -i "sudo lldpcli show neigh | egrep 'SysName|PortID'"
admin@ecssh121:~> viprexec -i "sudo lldpcli show neigh | egrep 'SysName|PortID'"
Output from host : 1xx.1xx.219.1
    SysName:      rabbit
    PortID:       ifname Ethernet9
    SysName:      hare
    PortID:       ifname Ethernet9
    SysName:      turtle
    PortID:       ifname Ethernet1

Output from host : 1xx.1xx.219.2
    SysName:      rabbit
    PortID:       ifname Ethernet10
    SysName:      hare
    PortID:       ifname Ethernet10
    SysName:      turtle
    PortID:       ifname Ethernet2

Output from host : 1xx.1xx.219.3
    SysName:      hare
    PortID:       ifname Ethernet11
    SysName:      rabbit
    PortID:       ifname Ethernet11
    SysName:      turtle
    PortID:       ifname Ethernet3

Output from host : 1xx.1xx.219.4
    SysName:      hare
    PortID:       ifname Ethernet12
    SysName:      turtle
    PortID:       ifname Ethernet4
Las asignaciones de ECS de 3.ª generación para los nodos son las siguientes para los puertos de switch correspondientes:
ethernet1/1/2 = nodo 2
ethernet1/1/3 = nodo 3
ethernet1/1/4 = nodo 4
ethernet1/1/5 = nodo 5
ethernet1/1/6 = nodo 6
ethernet1/1/7 = nodo 7
ethernet1/1/8 = nodo 8
- Confirme que las conexiones estén activas para que ECS se conecte a los cuatro switches ECS de 3.ª generación: front-end, conejo y liebre, back-end, zorro y sabueso.
# viprexec -i "sudo lldpcli show neigh | egrep 'SysName|PortID'"
admin@ecsnode1:~> viprexec -i "sudo lldpcli show neigh | egrep 'SysName|PortID'"

Output from host : 1xx.1xx.219.1
    SysName:      rabbit
    PortID:       ifname ethernet1/1/1
    SysName:      hare
    PortID:       ifname ethernet1/1/1
    SysName:      fox
    PortID:       ifname ethernet1/1/1
    SysName:      hound
    PortID:       ifname ethernet1/1/1

Output from host : 192.168.219.2
    SysName:      rabbit
    PortID:       ifname ethernet1/1/2
    SysName:      hare
    PortID:       ifname ethernet1/1/2
    SysName:      fox
    PortID:       ifname ethernet1/1/2
    SysName:      hound
    PortID:       ifname ethernet1/1/2

Output from host : 1xx.1xx.219.3
    SysName:      rabbit
    PortID:       ifname ethernet1/1/3
    SysName:      hare
    PortID:       ifname ethernet1/1/3
    SysName:      fox
    PortID:       ifname ethernet1/1/3
    SysName:      hound
    PortID:       ifname ethernet1/1/3

Output from host : 1xx.1xx.219.4
    SysName:      rabbit
    PortID:       ifname ethernet1/1/4
    SysName:      hare
    PortID:       ifname ethernet1/1/4
    SysName:      fox
    PortID:       ifname ethernet1/1/4
    SysName:      hound
    PortID:       ifname ethernet1/1/4

Output from host : 1xx.1xx.219.5
    SysName:      rabbit
    PortID:       ifname ethernet1/1/5
    SysName:      hare
    PortID:       ifname ethernet1/1/5
    SysName:      fox
    PortID:       ifname ethernet1/1/5
    SysName:      hound
    PortID:       ifname ethernet1/1/5

Output from host : 1xx.1xx.219.6
    SysName:      rabbit
    PortID:       ifname ethernet1/1/6
    SysName:      hare
    PortID:       ifname ethernet1/1/6
    SysName:      fox
    PortID:       ifname ethernet1/1/6
    SysName:      hound
    PortID:       ifname ethernet1/1/6

Output from host : 1xx.1xx.219.7
    SysName:      rabbit
    PortID:       ifname ethernet1/1/7
    SysName:      hare
    PortID:       ifname ethernet1/1/7
    SysName:      fox
    PortID:       ifname ethernet1/1/7
    SysName:      hound
    PortID:       ifname ethernet1/1/7

Output from host : 1xx.1xx.219.8
    SysName:      rabbit
    PortID:       ifname ethernet1/1/8
    SysName:      hare
    PortID:       ifname ethernet1/1/8
    SysName:      fox
    PortID:       ifname ethernet1/1/8
    SysName:      hound
    PortID:       ifname ethernet1/1/8
- Conéctese al rabbit con credenciales de administrador y verifique el estado de la interfaz.
ECS de 1.ª o 2.ª generación
# ssh <switch name>
# show interfaces show interfaces Ethernet<Interface Number>
admin@ecs1:~> ssh rabbit
Password:
Last login: Tue Sep  5 11:13:30 2017 from 1xx.1xx.219.1
rabbit>show interfaces Ethernet12
Ethernet12 is down, line protocol is notpresent (notconnect)
  Hardware is Ethernet, address is 444c.a8de.8f83 (bia 444c.a8de.8f83)
  Description: MLAG group 4
  Member of Port-Channel4
  Ethernet MTU 9214 bytes , BW 10000000 kbit
  Full-duplex, 10Gb/s, auto negotiation: off, uni-link: n/a
  Loopback Mode : None
  0 link status changes since last clear
  Last clearing of "show interface" counters never
  5 minutes input rate 0 bps (0.0% with framing overhead), 0 packets/sec
  5 minutes output rate 0 bps (0.0% with framing overhead), 0 packets/sec
     0 packets input, 0 bytes
     Received 0 broadcasts, 0 multicast
     0 runts, 0 giants
     0 input errors, 0 CRC, 0 alignment, 0 symbol, 0 input discards
     0 PAUSE input
     0 packets output, 0 bytes
     Sent 0 broadcasts, 0 multicast
     0 output errors, 0 collisions
     0 late collision, 0 deferred, 0 output discards
     0 PAUSE output
Comando:
ECS de 3.ª generación
# ssh <switch name>
# show interfaces ethernet 1/1/<Interface Number>
Ejemplo:
ECS de 3.ª generación
rabbit# show interface ethernet 1/1/4
Ethernet 1/1/9 is up, line protocol is down
Description: VLT Group 9
Port is part of Port-channel 9
Hardware is Dell EMC Eth, address is d8:9e:f3:c6:31:09
    Current address is d8:9e:f3:c6:31:09
Pluggable media not present

Interface index is 17305276
Internet address is not set
Mode of IPv4 Address Assignment: not set
Interface IPv6 oper status: Enabled
MTU 9216 bytes, IP MTU 9184 bytes
LineSpeed 0, Auto-Negotiation off
FEC is auto
Flowcontrol rx off tx off
ARP type: ARPA, ARP Timeout: 60
Last clearing of "show interface" counters: 6 days 17:39:09
Queuing strategy: fifo
Input statistics:
     0 packets, 0 octets
     0 64-byte pkts, 0 over 64-byte pkts, 0 over 127-byte pkts
     0 over 255-byte pkts, 0 over 511-byte pkts, 0 over 1023-byte pkts
     0 Multicasts, 0 Broadcasts, 0 Unicasts
     0 runts, 0 giants, 0 throttles
     0 CRC,  overrun, 0 discarded
Output statistics:
     0 packets, 0 octets
     0 64-byte pkts, 0 over 64-byte pkts, 0 over 127-byte pkts
     0 over 255-byte pkts, 0 over 511-byte pkts, 0 over 1023-byte pkts
     0 Multicasts, 0 Broadcasts, 0 Unicasts
     0 throttles, 0 discarded, 0 Collisions, 0 wreddrops
Rate Info(interval 299 seconds):
     Input 0 Mbits/sec, 0 packets/sec, 0% of line rate
     Output 0 Mbits/sec, 0 packets/sec, 0% of line rate
Time since last interface status change: 6 days 17:39:10
Compruebe si hay posibles problemas en las tarjetas de interfaz de red (NIC):
Otro componente para comprobar si el buffer de mensajes de los nodos (dmesg) busca problemas recientes de NIC en el nodo afectado. En el siguiente ejemplo, la NIC alterna entre el estado activo e inactivo.
Si hay una alerta de NIC en el dmesg, es posible que sea necesario reemplazarla.
- En el caso de ECS de 1.ª o 2.ª generación: proporcione el resultado al ingeniero de hardware de soporte de ECS para realizar un análisis.
- Si es ECS Gen 3 : proporcione el resultado al equipo de hardware de Dell que sería experto en hardware de la serie EX.
Comando:
# sudo dmesg -T
Ejemplo:
admin@node1:~> sudo dmesg -T
[Tue Jul  6 09:40:56 2021] public: link status definitely up for interface slave-1, 25000 Mbps full duplex
[Tue Jul  6 09:40:56 2021] bnxt_en 0000:04:00.1 slave-1: NIC Link is Down
[Tue Jul  6 09:40:56 2021] public: link status definitely down for interface slave-1, disabling it
[Tue Jul  6 09:40:57 2021] public: link status definitely down for interface slave-1, disabling it
[Tue Jul  6 09:41:09 2021] bnxt_en 0000:04:00.1 slave-1: NIC Link is Up, 25000 Mbps full duplex, Flow control: ON - receive & transmit
[Tue Jul  6 09:41:09 2021] bnxt_en 0000:04:00.1 slave-1: FEC autoneg off encodings: None
[Tue Jul  6 09:41:09 2021] public: link status definitely up for interface slave-1, 25000 Mbps full duplex
[Tue Jul  6 09:41:10 2021] bnxt_en 0000:04:00.1 slave-1: NIC Link is Down
[Tue Jul  6 09:41:10 2021] bnxt_en 0000:04:00.1 slave-1: speed changed to 0 for port slave-1
[Tue Jul  6 09:41:11 2021] public: link status definitely down for interface slave-1, disabling it
[Tue Jul  6 09:41:20 2021] bnxt_en 0000:04:00.1 slave-1: NIC Link is Up, 25000 Mbps full duplex, Flow control: ON - receive & transmit
[Tue Jul  6 09:41:20 2021] bnxt_en 0000:04:00.1 slave-1: FEC autoneg off encodings: None
[Tue Jul  6 09:41:20 2021] public: link status definitely up for interface slave-1, 25000 Mbps full duplex
[Tue Jul  6 09:41:22 2021] bnxt_en 0000:04:00.1 slave-1: NIC Link is Down
[Tue Jul  6 09:41:22 2021] bnxt_en 0000:04:00.1 slave-1: speed changed to 0 for port slave-1
[Tue Jul  6 09:41:22 2021] public: link status definitely down for interface slave-1, disabling it
[Tue Jul  6 09:41:31 2021] bnxt_en 0000:04:00.1 slave-1: NIC Link is Up, 25000 Mbps full duplex, Flow control: ON - receive & transmit
[Tue Jul  6 09:41:31 2021] bnxt_en 0000:04:00.1 slave-1: FEC autoneg off encodings: None
[Tue Jul  6 09:41:32 2021] public: link status definitely up for interface slave-1, 25000 Mbps full duplex
[Tue Jul  6 09:41:33 2021] bnxt_en 0000:04:00.1 slave-1: NIC Link is Down
Causa
Causas posibles
Este problema puede ocurrir debido a una o más de las siguientes condiciones:
-
SFP
insertado incorrectamente Es posible que el módulo conectable de factor de forma pequeño (SFP) no se haya insertado completamente durante la instalación. -
Cambios en el
switch administrado por el usuario Los cambios realizados en switches administrados por el cliente fuera del control de Dell, como actualizaciones de firmware, cambios en la configuración o actividades de mantenimiento, pueden hacer que los enlaces de red dejen de funcionar y, luego, se vuelvan a negociar, como se describe en la sección Resolución. -
Hardware de redes de ECS con fallas, incluido lo siguiente:
- Tarjeta de interfaz de red (NIC)
- Cable de red
- Módulo conectable de factor de forma pequeño (SFP)
- Switch de red o puerto de switch
Resolución
Sanador automático xDoctor: ObjectScale xDoctor v5.1-109.0/ECS xDoctor v4.8-109.0 o posterior
- Para activar manualmente la autorreparación habilitada, ejecute el siguiente comando en el
master.racknodo. Esto inicia los analizadores de rack, que validarán y repararán automáticamente los nodos uno a la vez.
# sudo xdoctor --rap=RAP025
Ejemplo:
admin@ecsnode1:~> admin@ecsnode1:~> sudo xdoctor --rap=RAP025
2026-04-01 19:05:13,590: xDoctor_4.8-109.0 - INFO    : Initializing xDoctor v4.8-109.0 ...
2026-04-01 19:05:14,143: xDoctor_4.8-109.0 - INFO    : Removing orphaned session - session_1775070174.306
2026-04-01 19:05:14,146: xDoctor_4.8-109.0 - INFO    : Starting xDoctor session_1775070313.036 ... (SYSTEM)
2026-04-01 19:05:14,146: xDoctor_4.8-109.0 - INFO    : Primary Node Control Check ...
2026-04-01 19:05:14,336: xDoctor_4.8-109.0 - INFO    : xDoctor Composition - Analyzer(s):ac_interface_check
2026-04-01 19:05:14,352: xDoctor_4.8-109.0 - INFO    : Session limited to 0:40:00
2026-04-01 19:05:15,410: xDoctor_4.8-109.0 - INFO    : --------------------
2026-04-01 19:05:15,410: xDoctor_4.8-109.0 - INFO    : ECS Version: 3.8.1.4
2026-04-01 19:05:15,410: xDoctor_4.8-109.0 - INFO    : --------------------
2026-04-01 19:05:15,525: xDoctor_4.8-109.0 - INFO    : xDoctor Pre Features
2026-04-01 19:05:15,526: xDoctor_4.8-109.0 - INFO    : Cron Activation
2026-04-01 19:05:15,526: xDoctor_4.8-109.0 - INFO    : xDoctor already active ...
[... Truncated Output ...]
2026-04-01 19:05:21,987: xDoctor_4.8-109.0 - INFO    : ------------------------------
2026-04-01 19:05:21,992: xDoctor_4.8-109.0 - INFO    : Analyzing collected data ...
2026-04-01 19:05:21,992: xDoctor_4.8-109.0 - INFO    : Analysis Limit: 0:13:00
2026-04-01 19:05:21,993: xDoctor_4.8-109.0 - INFO    : ANALYZER [ac_interface_check]
2026-04-01 19:05:22,291: xDoctor_4.8-109.0 - INFO    : Autohealing interface_down on node 169.254.1.4 ...
2026-04-01 19:08:39,599: xDoctor_4.8-109.0 - INFO    : Autohealing interface_down on node 169.254.1.1 ...
2026-04-01 19:11:19,874: xDoctor_4.8-109.0 - INFO    : All data analyzed in 0:05:57
2026-04-01 19:11:20,709: xDoctor_4.8-109.0 - INFO    : --------------------
2026-04-01 19:11:20,709: xDoctor_4.8-109.0 - INFO    : Diagnosis Summary
2026-04-01 19:11:20,709: xDoctor_4.8-109.0 - INFO    : --------------------
2026-04-01 19:11:20,709: xDoctor_4.8-109.0 - INFO    : PSNT: CKM00190800120
2026-04-01 19:11:20,709: xDoctor_4.8-109.0 - INFO    : --------------------
2026-04-01 19:11:20,710: xDoctor_4.8-109.0 - INFO    : FIXED             =  1
2026-04-01 19:11:20,710: xDoctor_4.8-109.0 - INFO    : CRITICAL          =  0
2026-04-01 19:11:20,710: xDoctor_4.8-109.0 - INFO    : CRITICAL (CACHED) =  0
2026-04-01 19:11:20,710: xDoctor_4.8-109.0 - INFO    : ERROR             =  0
2026-04-01 19:11:20,710: xDoctor_4.8-109.0 - INFO    : ERROR (CACHED)    =  1
2026-04-01 19:11:20,710: xDoctor_4.8-109.0 - INFO    : WARNING           =  0
2026-04-01 19:11:20,710: xDoctor_4.8-109.0 - INFO    : INFO              =  0
2026-04-01 19:11:20,710: xDoctor_4.8-109.0 - INFO    : VERBOSE           =  0
2026-04-01 19:11:20,710: xDoctor_4.8-109.0 - INFO    : REPORT            =  0
2026-04-01 19:11:20,826: xDoctor_4.8-109.0 - INFO    : ---------------------
2026-04-01 19:11:20,826: xDoctor_4.8-109.0 - INFO    : xDoctor Post Features
2026-04-01 19:11:20,826: xDoctor_4.8-109.0 - INFO    : ----------------
2026-04-01 19:11:20,826: xDoctor_4.8-109.0 - INFO    : Data Combiner
2026-04-01 19:11:20,826: xDoctor_4.8-109.0 - INFO    : -------------
2026-04-01 19:11:20,827: xDoctor_4.8-109.0 - INFO    : Created a Data Collection Report (data.xml)
2026-04-01 19:11:20,827: xDoctor_4.8-109.0 - INFO    : ------
2026-04-01 19:11:20,827: xDoctor_4.8-109.0 - INFO    : SysLog
2026-04-01 19:11:20,827: xDoctor_4.8-109.0 - INFO    : ------
2026-04-01 19:11:20,828: xDoctor_4.8-109.0 - INFO    : Using Fabric as Syslog Server
2026-04-01 19:11:20,828: xDoctor_4.8-109.0 - INFO    : Syslog triggered on Warning
2026-04-01 19:11:20,828: xDoctor_4.8-109.0 - INFO    : Forwarded 1 event(s) to syslog
2026-04-01 19:11:20,828: xDoctor_4.8-109.0 - INFO    : ----
2026-04-01 19:11:20,828: xDoctor_4.8-109.0 - INFO    : SNMP
2026-04-01 19:11:20,828: xDoctor_4.8-109.0 - INFO    : ----
2026-04-01 19:11:20,829: xDoctor_4.8-109.0 - INFO    : Using 10.118.165.48:162 as SNMP server
2026-04-01 19:11:20,829: xDoctor_4.8-109.0 - INFO    : SNMP triggered on Warning
2026-04-01 19:11:26,905: xDoctor_4.8-109.0 - INFO    : Triggered 1 SNMPv2c event(s) and the SNMP server acknowledged 0 event(s)
2026-04-01 19:11:26,905: xDoctor_4.8-109.0 - INFO    : ------------
2026-04-01 19:11:26,905: xDoctor_4.8-109.0 - INFO    : ProcComplete
2026-04-01 19:11:26,905: xDoctor_4.8-109.0 - INFO    : ------------
2026-04-01 19:11:26,905: xDoctor_4.8-109.0 - WARNING : ProcComplete is disabled, please re-enable it (xdoctor --config)
2026-04-01 19:11:27,023: xDoctor_4.8-109.0 - INFO    : ----------------
2026-04-01 19:11:27,023: xDoctor_4.8-109.0 - INFO    : Session Archiver
2026-04-01 19:11:27,023: xDoctor_4.8-109.0 - INFO    : ----------------
2026-04-01 19:11:27,033: xDoctor_4.8-109.0 - INFO    : Session Stored in folder      - /usr/local/xdoctor/archive/other/2026-04-01_190513
2026-04-01 19:11:27,033: xDoctor_4.8-109.0 - INFO    : Session Archived as tar       - /usr/local/xdoctor/archive/other/xDoctor-CKMXXXXXXXXXXX-2026-04-01_190513.tgz
2026-04-01 19:11:27,034: xDoctor_4.8-109.0 - INFO    : --------------------------
2026-04-01 19:11:27,034: xDoctor_4.8-109.0 - INFO    : Session Report                - sudo xdoctor --report --archive=2026-04-01_190513
2026-04-01 19:11:27,034: xDoctor_4.8-109.0 - INFO    : ---------------
2026-04-01 19:11:27,034: xDoctor_4.8-109.0 - INFO    : Session Cleaner
2026-04-01 19:11:27,034: xDoctor_4.8-109.0 - INFO    : ---------------
2026-04-01 19:11:27,046: xDoctor_4.8-109.0 - INFO    : Removing folder  (count limit) - /usr/local/xdoctor/archive/other/2026-04-01_180540
2026-04-01 19:11:27,047: xDoctor_4.8-109.0 - INFO    : Removing archive (count limit) - /usr/local/xdoctor/archive/other/xDoctor-CKMXXXXXXXXXXX-2026-04-01_180540.tgz
2026-04-01 19:11:27,051: xDoctor_4.8-109.0 - INFO    : Cleaned 2 archived session(s)
2026-04-01 19:11:27,051: xDoctor_4.8-109.0 - INFO    : -------
2026-04-01 19:11:27,051: xDoctor_4.8-109.0 - INFO    : Emailer
2026-04-01 19:11:27,051: xDoctor_4.8-109.0 - INFO    : -------
2026-04-01 19:11:27,052: xDoctor_4.8-109.0 - INFO    : Using Dedicated Server (25:25) as SMTP Server ...
2026-04-01 19:11:27,052: xDoctor_4.8-109.0 - INFO    : Email Type = Individual Events
2026-04-01 19:11:27,052: xDoctor_4.8-109.0 - INFO    : ------------------------------
2026-04-01 19:11:27,053: xDoctor_4.8-109.0 - INFO    : xDoctor session_1775070313.036 finished in 0:06:14
2026-04-01 19:11:27,075: xDoctor_4.8-109.0 - INFO    : Successful Job:1775070313 Exit Code:200
- Ejecute el informe de sesión para revisar los resultados de la ejecución de la autorreparación manual.
# sudo xdoctor --report --archive=<session report>
Ejemplo:
admin@ecsnode1:~> sudo xdoctor --report --archive=2026-04-01_180344

xDoctor 4.8-109.0
CKMXXXXXXXXXXX - ECS 3.8.1.4

Displaying xDoctor Report (2026-04-01_180344) Filter:[] ...

----------------------------------------
FIXED - Auto Healer fixed interface_down
----------------------------------------
Node      = Nodes
Extra     = {"Nodes": {"169.254.1.1": ["pslave-0"]}}
Timestamp = 2026-04-01_190513
PSNT      = CKMXXXXXXXXXXX @ 4.8-109.0
- En caso de que se produzca una falla, abra una SR para investigarla.
Ejemplo de falla:------------------------------------------------------------------------------------- ERROR - (Cached) Auto fix failed - One or more network interfaces are down or missing ------------------------------------------------------------------------------------- Node = Nodes Extra = {"Nodes": {"169.254.1.4": ["pslave-1"]}} RAP = RAP025 Solution = KB 503814 Timestamp = 2026-04-01_190513 PSNT = CKMXXXXXXXXXXX @ 4.8-109.0
Piloto automático de xDoctor:
IMPORTANTE: Se lanzó una nueva función en xDoctor 4-8.104.0 y versiones posteriores. Esta base de conocimientos (KB) ahora está automatizada con xDoctor para intentar recuperar rápidamente una interfaz de nodo mediante la comprobación de los detalles del nodo y del switch. Si el script no puede recuperar la interfaz, proporciona un resumen detallado de sus hallazgos.
Para configurar el repositorio de automatización con xDoctor 4-8.104.0 y versiones posteriores, siga ECS: ObjectScale: Cómo ejecutar scripts de automatización de KB (piloto automático)
- Ejecute el comando de automatización desde un nodo con xDoctor 4-8.104.0 y superior.
Nota:
--target-nodees compatible con esta acción. Este script se incluyó con la versión 4-8.104.0 de xDoctor, que incluye la versión 3.0 de los scripts de automatización de Ansible.
# sudo xdoctor autopilot --kb 50341 --target-node <Node NAN IP>Ejemplo:
admin@ecsnode1:~> sudo xdoctor autopilot --kb 50341 --target-node 169.254.1.1
Checking for existing screen sessions...
Starting screen session 'autopilot_kb_50341_20250627_124206'...
Screen session 'autopilot_kb_50341_20250627_124206' started successfully.
Attaching to screen session 'autopilot_kb_50341_20250627_124206'...
- Revise el resumen de automatización:
Ejemplo:
>TASK [Print all summaries] ***************************************************************************************************************************************************************************
ok: [169.254.1.7] => {
    "msg": [
        "Host: 169.254.1.7",
        "*******************************************************************************",
        "Node interface summary:",
        "*******************************************************************************",
        "Interface status for switch rabbit and node interface(slave-0):",
        "                           Node Interface: UP",
        "                           Node physical link detected: yes",
        "                           Node SFP Vendor: DELL",
        "                           Node SFP PN: VXFJY",
        "                           Node SFP Type: GBIC/SFP defined by 2-wire interface ID",
        "                           Node connection detected: ethernet1/1/7",
        "                           Switch Interface: ethernet1/1/7",
        "                           Switch Speed: 25G",
        "                           Switch Status: up",
        "                           Switch SFP Model: 25GBASE-CR-3.0M",
        "                           Switch SFP Qualified: true",
        "Interface status for switch hare and node interface(slave-1):",
        "                           Node Interface: UP",
        "                           Node physical link detected: yes",
        "                           Node SFP Vendor: DELL",
        "                           Node SFP PN: VXFJY",
        "                           Node SFP Type: GBIC/SFP defined by 2-wire interface ID",
        "                           Node connection detected: ethernet1/1/7",
        "                           Switch Interface: ethernet1/1/7",
        "                           Switch Speed: 25G",
        "                           Switch Status: up",
        "                           Switch SFP Model: 25GBASE-CR-3.0M",
        "                           Switch SFP Qualified: true",
        "Interface status for switch fox and node interface(pslave-0):",
        "                           Node Interface: UP",
        "                           Node physical link detected: yes",
        "                           Node SFP Vendor: DELL",
        "                           Node SFP PN: VXFJY",
        "                           Node SFP Type: GBIC/SFP defined by 2-wire interface ID",
        "                           Node connection detected: ethernet1/1/7",
        "                           Switch Interface: ethernet1/1/7",
        "                           Switch Speed: 25G",
        "                           Switch Status: up",
        "                           Switch SFP Model: 25GBASE-CR-3.0M",
        "                           Switch SFP Qualified: true",
        "Interface status for switch hound and node interface(pslave-1): ",
        "                           Node Interface:UP",
        "                           Node physical link detected:yes",
        "                           Node SFP Vendor: DELL",
        "                           Node SFP PN: VXFJY",
        "                           Node SFP Type: GBIC/SFP defined by 2-wire interface ID",
        "                           Node connection detected: ethernet1/1/7",
        "                           Switch Interface: ethernet1/1/7",
        "                           Switch Speed: 25G",
        "                           Switch Status: up",
        "                           Switch SFP Model: 25GBASE-CR-3.0M",
        "                           Switch SFP Qualified: true",
        "*******************************************************************************",
        "Actions taken and Reccomendations:",
        "*******************************************************************************",
        "Validated node(s) to switch connection are correct: PASS: Node(s) are correctly connected on all reachable Dell managed switches",
        "Validated SFP on the node(s): PASS: SFP detected on all interfaces",
        "Validated interface status on the node(s): PASS: All interfaces are up",
        "Validated SFP on the switches are qualified: PASS: All SFPs are qualified.",
        "Validated Frontend switch(es): PASS: All frontend switches appear to be Dell managed switches.",
        "Validated Backend switch(es): PASS: All backend switch(es) are reachable",
        "*******************************************************************************"
    ]
}

TASK [Fail if validation fails] **********************************************************************************************************************************************************************
skipping: [169.254.1.7] => {"changed": false, "skip_reason": "Conditional result was False", "skipped": true}

PLAY RECAP *******************************************************************************************************************************************************************************************
169.254.1.7                : ok=70   changed=6    unreachable=0    failed=0
localhost                  : ok=8    changed=1    unreachable=0    failed=0

Playbook execution successful
20241112 22:28:58.932: | PASS (2 min 44 sec)
================================================================================
Status: PASS
Time Elapsed: 3 min 1 sec
Debug log: /opt/emc/caspian/service-console/log/20241112_222531_run_KB_Fix/dbg_robot.log
HTML log: /opt/emc/caspian/service-console/log/20241112_222531_run_KB_Fix/log.html
================================================================================

[screen is terminating]
Los pasos manuales se indican a continuación:
Antes de realizar cualquier trabajo: En los casos en que se realizan mantenimientos a switches administrados por el usuario, como las actualizaciones de firmware, los enlaces pueden dejar de funcionar y renegociarse. El siguiente ejemplo corresponde a una interfaz secondary-0 inactiva después de una actualización de firmware realizada por el usuario en un switch FE administrado por el usuario. El siguiente comando se utiliza para renegociar la interfaz:
ethtool -r <i/f name>

admin@ecs-n-1:~> sudo ethtool slave-0
Settings for slave-0:
        Supported ports: [ FIBRE ]
        Supported link modes:   1000baseX/Full
                                10000baseSR/Full
        Supported pause frame use: Symmetric
        Supports auto-negotiation: Yes
        Advertised link modes:  1000baseX/Full
                                10000baseSR/Full
        Advertised pause frame use: No
        Advertised auto-negotiation: Yes
        Speed: Unknown!
        Duplex: Unknown! (255)
        Port: FIBRE
        PHYAD: 0
        Transceiver: internal
        Auto-negotiation: off
        Supports Wake-on: g
        Wake-on: g
        Current message level: 0x0000000f (15)
                               drv probe link timer
        Link detected: no
admin@ecs-n-1:~>

admin@ecs-n-1:~> sudo ethtool -r slave-0
admin@ecs-n-1:~>

admin@ecs-n-1:~> sudo ethtool slave-0
Settings for slave-0:
        Supported ports: [ FIBRE ]
        Supported link modes:   1000baseX/Full
                                10000baseSR/Full
        Supported pause frame use: Symmetric
        Supports auto-negotiation: Yes
        Advertised link modes:  1000baseX/Full
                                10000baseSR/Full
        Advertised pause frame use: No
        Advertised auto-negotiation: Yes
        Speed: 10000Mb/s
        Duplex: Full
        Port: FIBRE
        PHYAD: 0
        Transceiver: internal
        Auto-negotiation: off
        Supports Wake-on: g
        Wake-on: g
        Current message level: 0x0000000f (15)
                               drv probe link timer
        Link detected: yes
Existen diferentes modelos de SFP que utilizan cobre o fibra. Además, los switches de back-end y front-end pueden usar diferentes tipos de cables SFP. Confirme qué pieza se necesita antes del reemplazo.
Información adicional
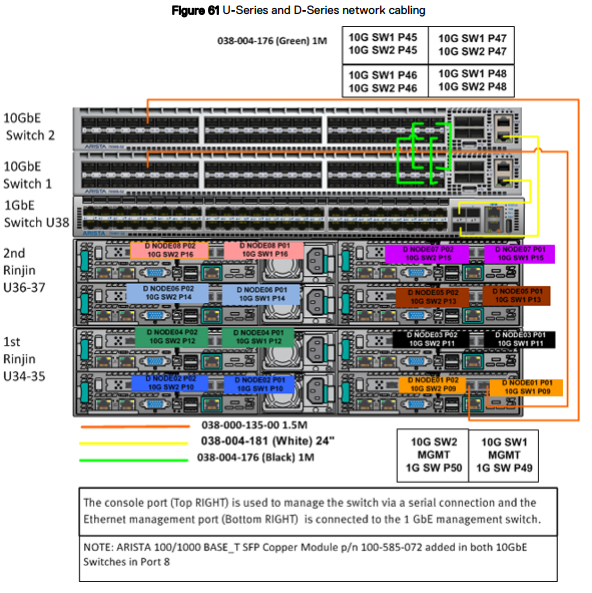
Cableado de red
Los diagramas de cableado de red se aplican a un dispositivo ECS serie U, serie D o C en un rack proporcionado por Dell o por el cliente.
- Hare (liebre): El switch público de 10 GbE se encuentra en la parte superior del rack en una serie U o D, o en el switch superior en un segmento de la serie C.
- Rabbit (conejo): El switch público de 10 GbE se encuentra debajo del hare en la parte superior del rack en una serie U o D o debajo del switch hare en un segmento de la serie C.
- Turtle (tortuga): Switch privado de 1 GbE ubicado debajo del rabbit en la parte superior del rack en una serie U o debajo del switch hare en un segmento de la serie C.
En la siguiente figura, se muestra un diagrama de cableado de red simplificado para una configuración de rack de ocho nodos para un ECS serie U o D configurado por Dell o por el cliente. Después de esta figura, otras figuras y tablas detalladas proporcionan información sobre los puertos, las etiquetas y el color de los cables.
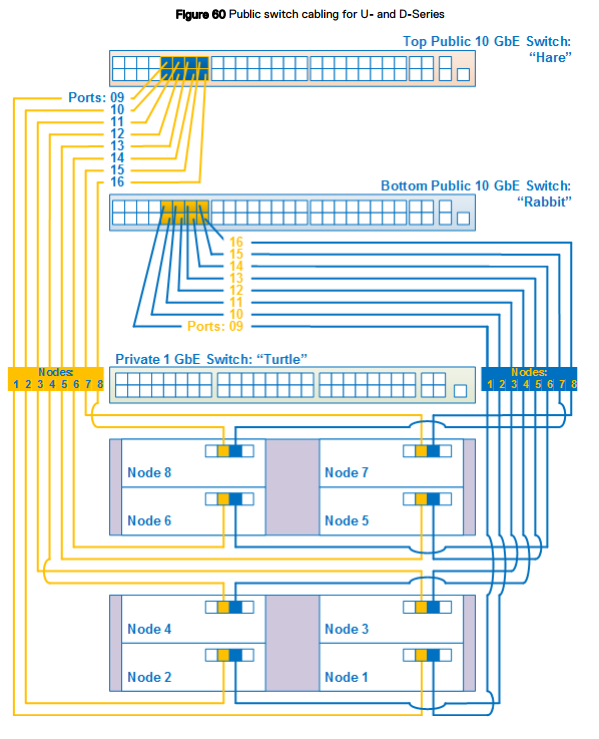
Switch 1 = rabbit = switch inferior
Switch 2 = hare = switch superior
Puertos de nodo:
Secondary-0 = P01 = puerto derecho: se conecta al switch 1/rabbit/switch inferior.
Secondary-1 = P02 = puerto izquierdo: se conecta al switch 2/hare/switch superior.