VMware:vSAN 物理磁盘故障处理指南
Summary: 这是一份常规故障处理指南,可帮助确定 vSAN 群集中的物理磁盘是否存在问题。
This article applies to
This article does not apply to
This article is not tied to any specific product.
Not all product versions are identified in this article.
Instructions
从 Web UI 检查 vSAN 物理磁盘状态:
连接到 vCenter Server Web Client 并从以下位置检查磁盘状态:
库存 >主机和群集 > vSAN 群集>配置 > vSAN > 磁盘管理
图 1:vSAN 磁盘管理视图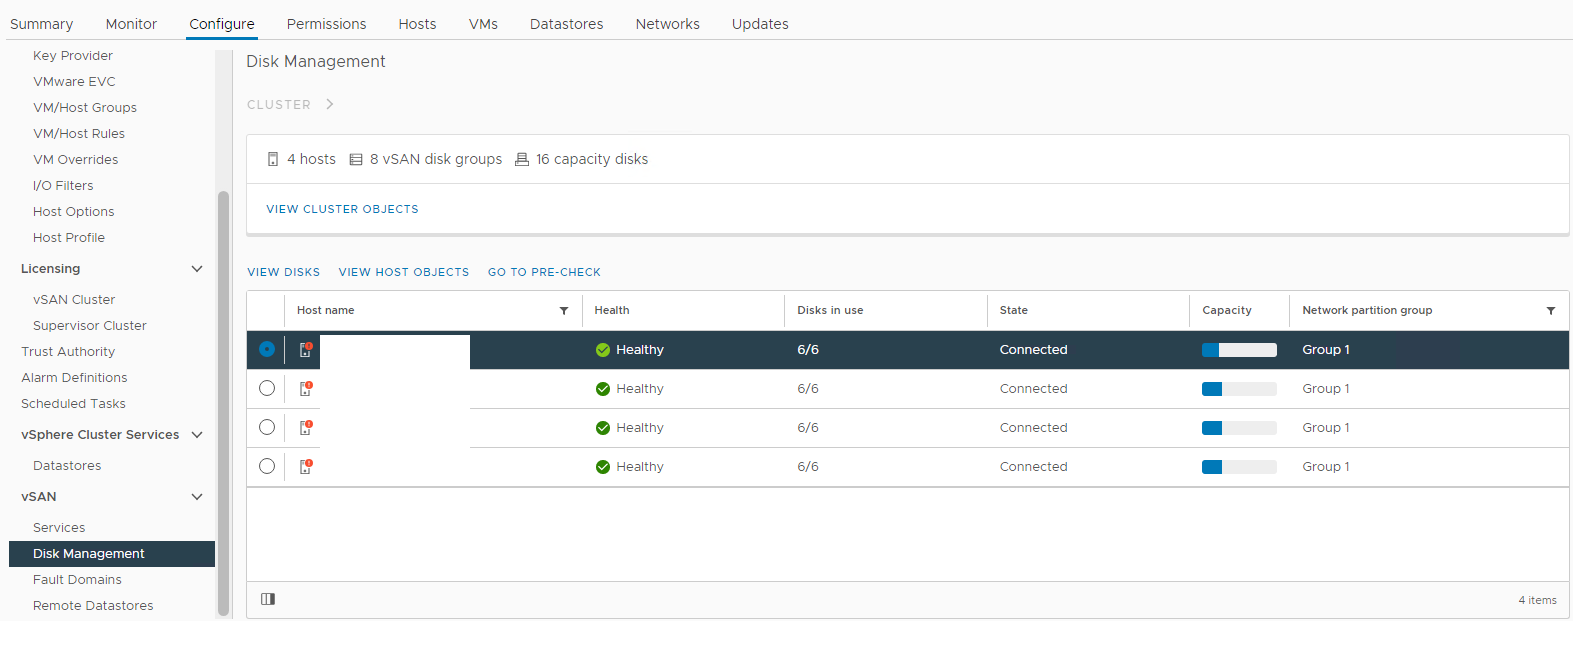
选择受影响的主机,然后展开“查看磁盘”部分:
图 2:vSAN 磁盘组视图

在这里,您可以验证磁盘是否被检测到:
运行状况不佳 已卸载
0 容量
永久磁盘故障
磁盘关闭
不存在磁盘
此外,检查从 vSAN Skyline 运行状况部分触发的与磁盘相关的警报:
库存 > 主机和群集 > vSAN 群集 > 监视 > vSAN > Skyline 运行状况 > 物理磁盘
图 3:Skyline 运行状况视图

您可以在此处验证是否触发了以下任何警报:
即将发生永久磁盘故障,正在撤出数据(运行状况 — 黄色)。
即将发生永久磁盘故障,由于资源不足,数据疏散失败(运行状况 - 红色)。
即将发生永久磁盘故障,由于无法访问对象,数据疏散失败(运行状况 - 红色)。
即将发生永久磁盘故障,数据疏散已完成(运行状况状态 — 黄色)
此外,您还可以从受影响主机的存储设备列表中检查磁盘状态:
库存 >主机和群集 vSAN 群集>受影响的 vSAN ESXi 主机 > 配置>存储>存储设备 图 4:>
主机存储设备视图

您可以在此处验证磁盘状态是否为:
0 Capacity
Disk Absent
Disk Unmounted
Verify there are the Resync happening:
库存 > 主机和群集 > vSAN 群集 > 监视 > vSAN > 重新同步对象:
图 5:“重新同步对象”视图

验证 vSAN 对象的状态:
库存 >主机和群集vSAN 群集监视>程序vSAN >> Skyline 运行状况>数据>vSAN 对象运行状况图 6:vSAN 对象>运行状况视图

下一步是通过 CLI 收集有关问题的更多信息并检查日志:
从 CLI 检查 vSAN 物理磁盘状态:
通过 SSH 连接到受影响的主机并运行以下命令:
示例:
示例:
示例:
示例:
示例:
示例:
按 Ctrl+C 停止命令。
正常 -- 状态 7
无法访问 -- 状态 13
不存在或降级 -- 状态 15
示例:
如何通过 CLI 确定故障 SSD 或硬盘的位置:
列出所有可用设备:
示例:
使用列表中的每个磁盘 naa 检查位置:
示例:
如果缺少设备名称,如何识别发生故障的硬盘或 SSD:
可能未检测到故障磁盘,并且无法使用相应的 naa 进行识别。在这种情况下,需要找到所有磁盘,而未实际找到的磁盘将是发生故障的磁盘。
下面是一个脚本,可用于稍快地执行任务:
存储相关问题的 vSAN 相关日志:
/var/log/vmkernel.log
读取和写入 vSAN 磁盘、vSAN 主机心跳信号、PDL、SCSI 感知代码和 I/O 请求(读取/写入)以及群集成员身份信息时出现问题。
示例:
/var/log/vobd.log
报告磁盘运行状况、永久设备丢失磁盘 (PDL)、磁盘延迟,并报告主机何时进入和退出维护模式。
示例:
/var/log/vsandevicemonitord.log
它可帮助您确定磁盘是否由于过度日志拥塞或 I/O 延迟而被标记为不正常。
示例:
连接到 vCenter Server Web Client 并从以下位置检查磁盘状态:
库存 >主机和群集 > vSAN 群集>配置 > vSAN > 磁盘管理
图 1:vSAN 磁盘管理视图
选择受影响的主机,然后展开“查看磁盘”部分:
图 2:vSAN 磁盘组视图
在这里,您可以验证磁盘是否被检测到:
运行状况不佳 已卸载
0 容量
永久磁盘故障
磁盘关闭
不存在磁盘
此外,检查从 vSAN Skyline 运行状况部分触发的与磁盘相关的警报:
库存 > 主机和群集 > vSAN 群集 > 监视 > vSAN > Skyline 运行状况 > 物理磁盘
图 3:Skyline 运行状况视图
您可以在此处验证是否触发了以下任何警报:
即将发生永久磁盘故障,正在撤出数据(运行状况 — 黄色)。
即将发生永久磁盘故障,由于资源不足,数据疏散失败(运行状况 - 红色)。
即将发生永久磁盘故障,由于无法访问对象,数据疏散失败(运行状况 - 红色)。
即将发生永久磁盘故障,数据疏散已完成(运行状况状态 — 黄色)
此外,您还可以从受影响主机的存储设备列表中检查磁盘状态:
库存 >主机和群集 vSAN 群集>受影响的 vSAN ESXi 主机 > 配置>存储>存储设备 图 4:>
主机存储设备视图
您可以在此处验证磁盘状态是否为:
0 Capacity
Disk Absent
Disk Unmounted
Verify there are the Resync happening:
库存 > 主机和群集 > vSAN 群集 > 监视 > vSAN > 重新同步对象:
图 5:“重新同步对象”视图
提醒:重新同步可能表示正在从受影响的磁盘或磁盘组中撤出数据。需要进一步调查以确定受影响的磁盘是否已准备好卸下或更换。
验证 vSAN 对象的状态:
库存 >主机和群集vSAN 群集监视>程序vSAN >> Skyline 运行状况>数据>vSAN 对象运行状况图 6:vSAN 对象>运行状况视图
提醒:务必确认没有不可访问的对象。对象不可访问意味着“对象的所有副本都丢失”。如果您卸下或更换可能导致 DL 的磁盘。
下一步是通过 CLI 收集有关问题的更多信息并检查日志:
从 CLI 检查 vSAN 物理磁盘状态:
通过 SSH 连接到受影响的主机并运行以下命令:
vdq -qH检查“IsPDL”(永久设备丢失)参数。如果等于 1,则磁盘丢失。
示例:
DiskResults:
 DiskResult[0]:
 Name: naa.600508b1001c4b820b4d80f9f8acfa95
 VSANUUID: 5294bbd8-67c4-c545-3952-7711e365f7fa
 State: In-use for VSAN
 ChecksumSupport: 0
 Reason: Non-local disk
 IsSSD?: 0
IsCapacityFlash?: 0
 IsPDL?: 0
 <<truncated>>
 DiskResult[18]:
 Name:
 VSANUUID: 5227c17e-ec64-de76-c10e-c272102beba7
 State: In-use for VSAN
 ChecksumSupport: 0
 Reason: None
 IsSSD?: 0
IsCapacityFlash?: 0
 IsPDL?: 1
vdq -iH检查磁盘组中是否缺少磁盘。
示例:
Mappings:
DiskMapping[0]:
SSD: naa.58ce38ee2016ffe5
MD: naa.5002538a4819e3e0

DiskMapping[2]:
SSD: naa.58ce38ee2016fe55
MD: naa.5002538a48199ca0
MD: naa.5002538a48199e20
MD: naa.5002538a48199e00
esxcli vsan storage list检查“In CMMDS”参数。如果为 false,则与磁盘的通信会丢失。
示例:
Device: Unknown
Display Name: Unknown
Is SSD: false
VSAN UUID: 529cadbc-acd1-b588-8643-68336d5512d6
VSAN Disk Group UUID:
VSAN Disk Group Name:
Used by this host: false
In CMMDS: false
On-disk format version: <Unknown>
Deduplication: false
Compression: false
Checksum:
Checksum OK: false
Is Capacity Tier: false
for i in `esxcli storage core device list | grep ^naa` ; do echo $i; esxcli storage core device smart get -d $i; done.使用智能 get 命令检查读/写错误。
示例:
naa.55cd2e404c1f35a1
Parameter                   Value  Threshold  Worst  Raw
--------------------------  -----  ---------  -----  ---
Health Status               OK     N/A        N/A    N/A
Media Wearout Indicator     100    0          100    86
Read Error Count            130    39         130    133
Power-on Hours              100    0          100    110
Power Cycle Count           100    0          100    106
Drive Temperature           100    0          100    26
Uncorrectable Sector Count  100    0          100    0
naa.55cd2e404c1f35a5
Parameter                   Value  Threshold  Worst  Raw
--------------------------  -----  ---------  -----  ---
Health Status               OK     N/A        N/A    N/A
Media Wearout Indicator     100    0          100    10
Read Error Count            130    39         130    53
Power-on Hours              100    0          100    110
Power Cycle Count           100    0          100    106
Drive Temperature           100    0          100    27
Uncorrectable Sector Count  100    0          100    0
esxcli vsan storage list | grep "VSAN Disk Group UUID:" | sort | uniq -c检查可用的磁盘组。
示例:
      2    VSAN Disk Group UUID: 5203424c-ee56-497d-75d1-fcf73ae997cb
      2    VSAN Disk Group UUID: 52af8e5c-77d1-b552-3310-ec5fef09edf4
while true;do echo " ****************************************** "; echo "" > /tmp/resyncStats.txt ;cmmds-tool find -t DOM_OBJECT -f json |grep uuid |awk -F \" '{print $4}' |while read i;do pendingResync=$(cmmds-tool find -t DOM_OBJECT -f json -u $i|grep -o "\"bytesToSync\": [0-9]*,"|awk -F " |," '{sum+=$2} END{print sum / 1024 / 1024 / 1024;}');if [ ${#pendingResync} -ne 1 ]; then echo "$i: $pendingResync GiB";fi;done |tee -a /tmp/resyncStats.txt;total=$(cat /tmp/resyncStats.txt |awk '{sum+=$2} END{print sum}');echo "Total: $total GiB" |tee -aa /tmp/resyncStats.txt;total=$(cat /tmp/resyncStats.txt |grep Total);totalObj=$(cat /tmp/resyncStats.txt|grep -vE " 0 GiB|Total"|wc -l);echo "`date +%Y-%m-%dT%H:%M:%SZ` $total ($totalObj objects)" >> /tmp/totalHistory.txt; echo `date `; sleep 60; done 检查是否存在正在进行或停滞的重新同步作。
示例:
Total: 0 GiB
Mon Feb 13 17:32:06 UTC 2023
按 Ctrl+C 停止命令。
cmmds-tool find -f python | grep CONFIG_STATUS -B 4 -A 6 | grep 'uuid\|content' | grep -o 'state\\\":\ [0-9]*' | sort | uniq -c检查组件的状态。
正常 -- 状态 7
无法访问 -- 状态 13
不存在或降级 -- 状态 15
示例:
425 state\": 7
如何通过 CLI 确定故障 SSD 或硬盘的位置:
列出所有可用设备:
esxcli storage core device list | grep "naa" | awk '{print $1}' | grep "naa"
示例:
naa.5000c500852df8d3
naa.55cd2e404c1f35a1
naa.55cd2e404c1f35a5
naa.5000c500852dd5e7
使用列表中的每个磁盘 naa 检查位置:
esxcli storage core device physical get -d
示例:
esxcli storage core device physical get -d naa.5000c500852df8d3
esxcli storage core device physical get -d naa.55cd2e404c1f35a1
esxcli storage core device physical get -d naa.55cd2e404c1f35a5
esxcli storage core device physical get -d naa.5000c500852dd5e7

   Physical Location: enclosure 65535 slot 0
   Physical Location: enclosure 65535 slot 1
   Physical Location: enclosure 65535 slot 2
   Physical Location: enclosure 65535 slot 3
如果缺少设备名称,如何识别发生故障的硬盘或 SSD:
可能未检测到故障磁盘,并且无法使用相应的 naa 进行识别。在这种情况下,需要找到所有磁盘,而未实际找到的磁盘将是发生故障的磁盘。
下面是一个脚本,可用于稍快地执行任务:
echo "=============Physical disks placement=============="
echo ""
esxcli storage core device list | grep "naa" | awk '{print $1}' | grep "naa" | while read in; do
echo "$in"
esxcli storage core device physical get -d "$in"
sleep 1
echo "===================================================="
done
存储相关问题的 vSAN 相关日志:
/var/log/vmkernel.log
读取和写入 vSAN 磁盘、vSAN 主机心跳信号、PDL、SCSI 感知代码和 I/O 请求(读取/写入)以及群集成员身份信息时出现问题。
示例:
2021-06-22T12:02:08.408Z cpu30:1001397101)ScsiDeviceIO: PsaScsiDeviceTimeoutHandlerFn:12834: TaskMgmt op to cancel IO succeeded for device naa.55cd2e404b7736d0 and the IO did not complete. WorldId 0, Cmd 0x28, CmdSN = 0x428.Cancelling of IO will be
2021-06-22T12:02:08.408Z cpu30:1001397101)retried.
/var/log/vobd.log
报告磁盘运行状况、永久设备丢失磁盘 (PDL)、磁盘延迟,并报告主机何时进入和退出维护模式。
示例:
2022-05-31T11:42:46.065Z: [vSANCorrelator] 10605891965954us: [vob.vsan.lsom.devicerepair] vSAN device 521a74ce-c980-c16c-ff3d-38a036233daf is being repaired due to I/O failures, and will be out of service until the repair is complete. If the device is part of a dedup disk group, the entire disk group will be out of service until the repair is complete.
2022-05-31T11:42:46.065Z: [vSANCorrelator] 10606062774178us: [esx.problem.vob.vsan.lsom.devicerepair] Device 521a74ce-c980-c16c-ff3d-38a036233daf is in offline state and is getting repaired
/var/log/vsandevicemonitord.log
它可帮助您确定磁盘是否由于过度日志拥塞或 I/O 延迟而被标记为不正常。
示例:
INFO vsandevicemonitord WARNING - WRITE Average Latency on VSAN device naa.50000xxxxxxxx has exceeded threshold value 2000000 us 2 times.
INFO vsandevicemonitord Tier 2 (naa.50000xxxxxxxx) as unhealthy
Affected Products
VMware ESXi 6.7.X, VMware ESXi 7.x, VMware ESXi 8.x, VMware VSANProducts
VxRail, PowerEdge C6420, PowerEdge C6520, PowerEdge C6525, PowerEdge C6615, PowerEdge C6620, PowerEdge M640 (for PE VRTX), PowerEdge R440, PowerEdge R450, PowerEdge R540, PowerEdge R550, PowerEdge R640, PowerEdge R6415, PowerEdge R650
, PowerEdge R650xs, PowerEdge R6515, PowerEdge R6525, PowerEdge R660, PowerEdge R660xs, PowerEdge R6615, PowerEdge R6625, PowerEdge R740, PowerEdge R740XD, PowerEdge R740XD2, PowerEdge R7415, PowerEdge R7425, PowerEdge R750, PowerEdge R750XA, PowerEdge R750xs, PowerEdge R7515, PowerEdge R7525, PowerEdge R760, PowerEdge R760XA, PowerEdge R760xd2, PowerEdge R760xs, PowerEdge R7615, PowerEdge R7625, PowerEdge R840, PowerEdge R860, PowerEdge R940, PowerEdge R940xa, PowerEdge R960, PowerEdge T430, PowerEdge T440, PowerEdge T550, PowerEdge T560, PowerEdge T630, PowerEdge T640, Dell EMC vSAN C6420 Ready Node, Dell EMC vSAN MX740c Ready Node, Dell EMC vSAN MX750c Ready Node, Dell vSAN Ready Node MX760c, Dell EMC vSAN R440 Ready Node, Dell EMC vSAN R640 Ready Node, Dell EMC vSAN R6415 Ready Node, Dell EMC vSAN R650 Ready Node, Dell EMC vSAN R6515 Ready Node, vSAN Ready Node R660, Dell vSAN R6615 Ready Node, Dell EMC vSAN R740 Ready Node, Dell EMC vSAN R740xd Ready Node, Dell EMC vSAN R750 Ready Node, Dell EMC vSAN R7515 Ready Node, Dell EMC vSAN R760 Ready Node, Dell vSAN R7615 Ready Node, Dell vSAN Ready Node R7625, Dell EMC vSAN R840 Ready Node, Dell EMC vSAN T350 Ready Node
...
Article Properties
Article Number: 000209262
Article Type: How To
Last Modified: 11 Feb 2025
Version: 5
Find answers to your questions from other Dell users
Support Services
Check if your device is covered by Support Services.