Dell NativeEdge: Metric Graph Shows Continuous Line When Data is Missing
Summary: When viewing long‑range metrics (7, 30, or 90 days) in NativeEdge, the graph may appear continuous even on days where the endpoint was disconnected and no telemetry should exist. This behavior can lead users to assume the system is incorrectly displaying data continuity. This behavior is expected and is not a product defect. ...
Symptoms
Users may observe one or more of the following:
- Missing data is shown as a continuous line on long‑range metric graphs.
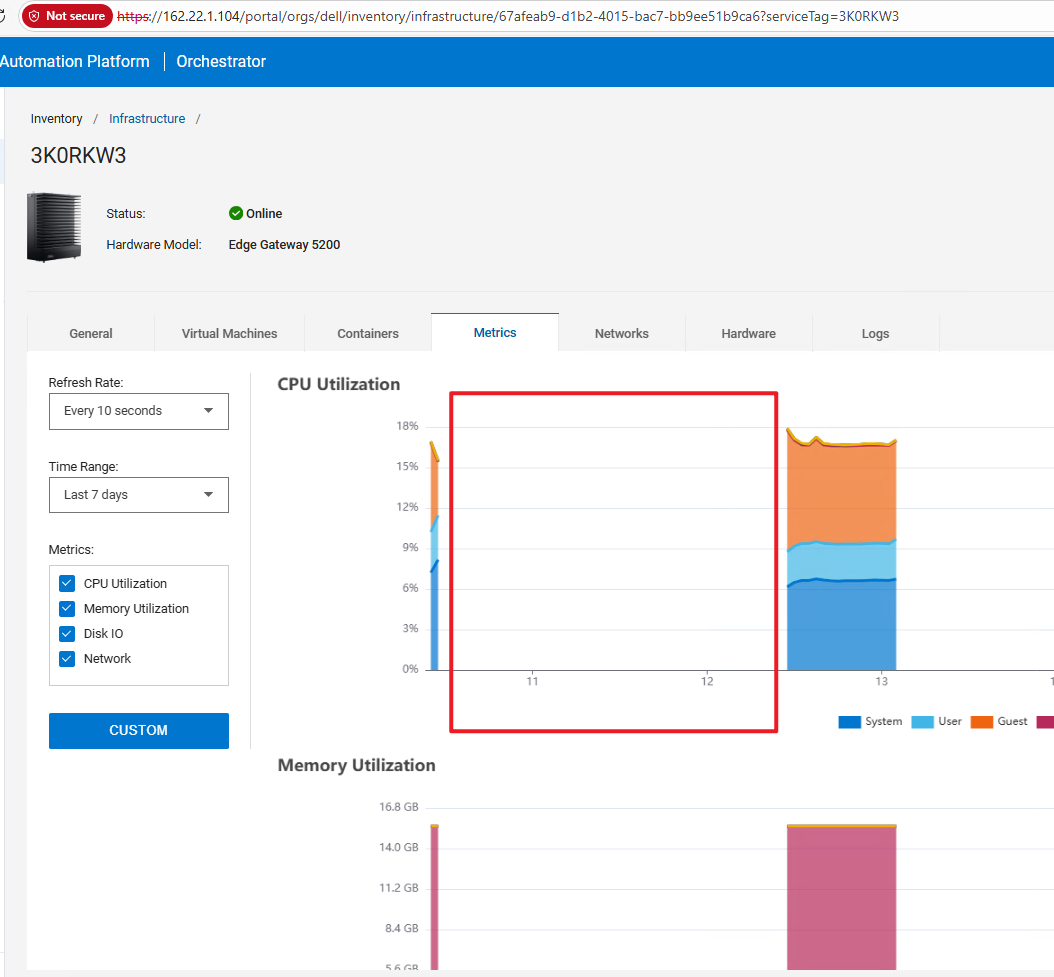
- For shorter ranges (for example, Last 7 days), missing dates correctly appear as a break.
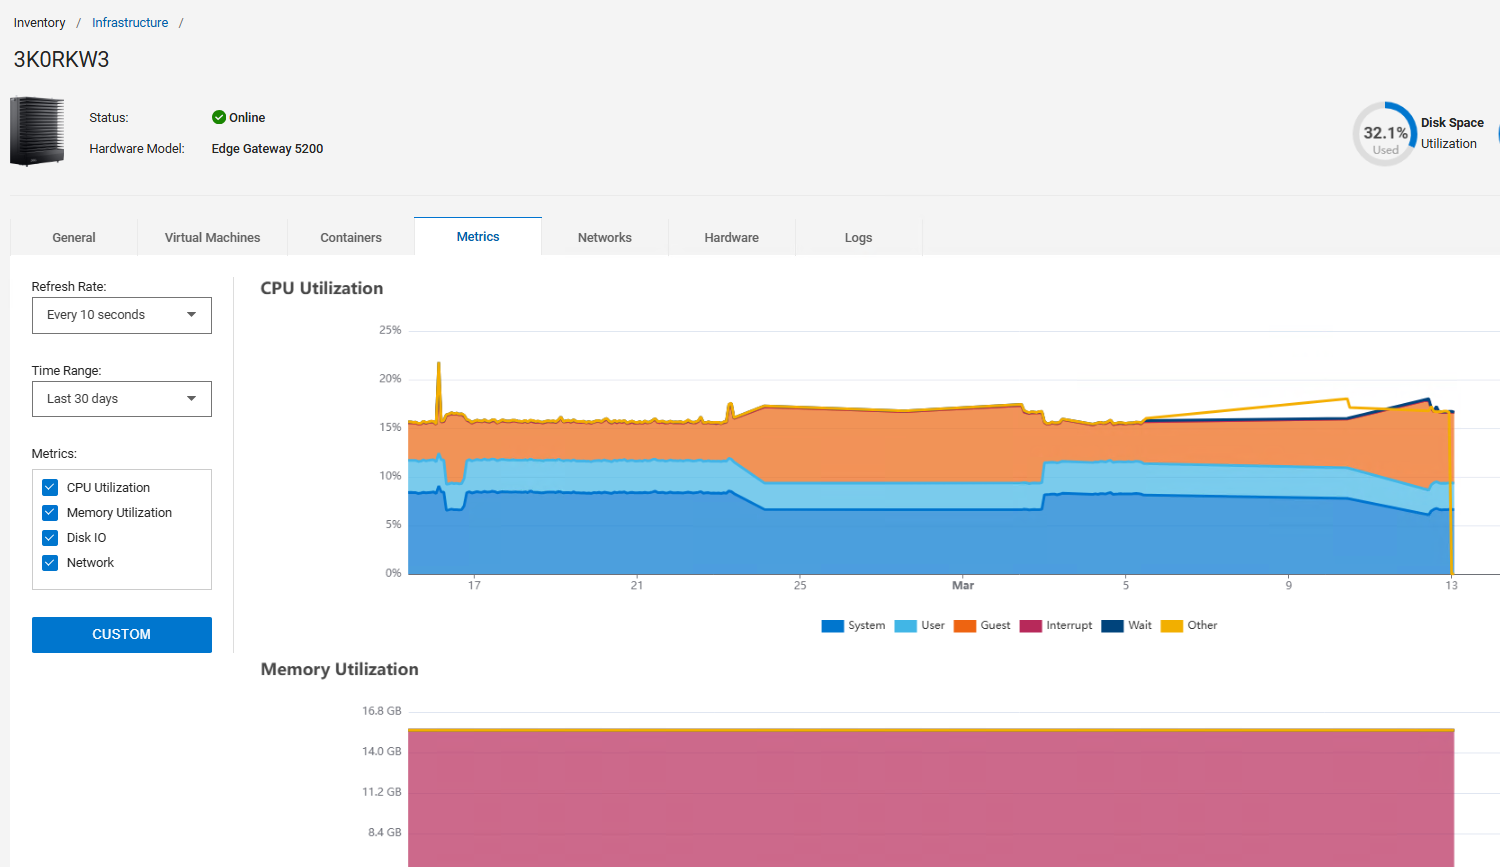
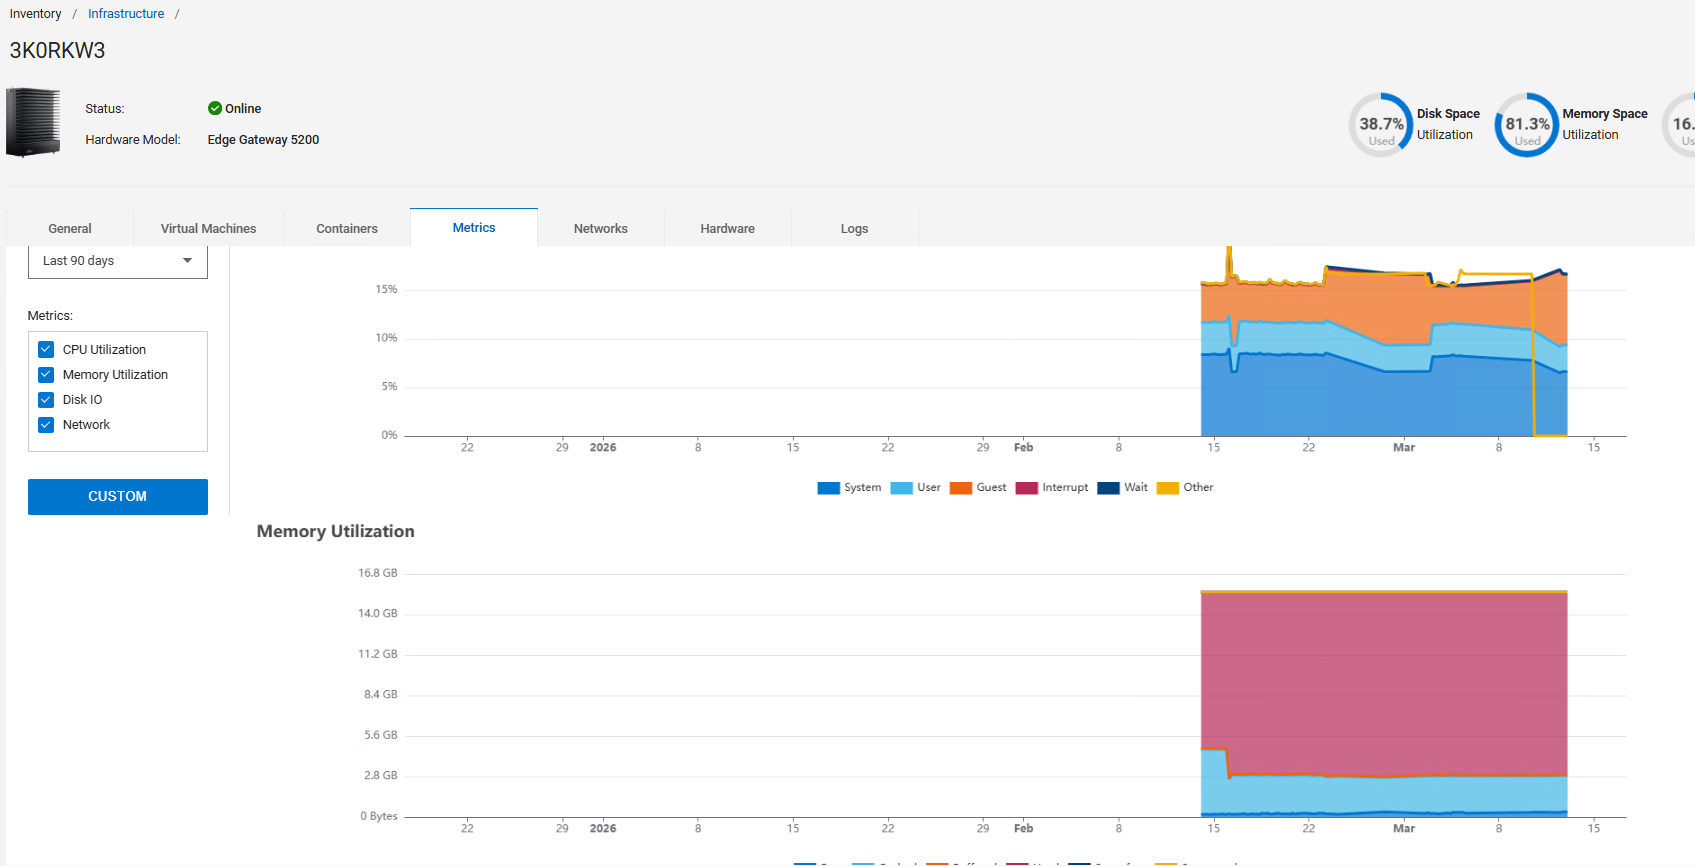
- For longer ranges (Last 30 days or Last 90 days), the graph visually appears smoothed and no gap is rendered.
- X‑axis alignment in the 90‑day view may appear slightly skewed.
Example reported symptoms:
- Endpoint was deliberately disconnected between Mar 11-12
- "Last 7 days" view correctly shows breaks.
- "Last 30 days" and "Last 90 days" views appear continuous.
Cause
- Endpoint Buffer Limitations During Disconnection
When the endpoint is offline, it cannot transfer metrics to Gocky or Orchestrator.
Endpoint has a limited buffer for Telegraf metrics.
Once the buffer is full:
- Older metrics are dropped
- The system does not backfill missing data upon reconnection
Therefore, gaps in real data exist even though the graph appears visually continuous.
- Metric Graph Downsampling for Long Time Ranges.
When the user selects larger date ranges (30 or 90 days), the graphing system does not increase the sample count.
Instead, it performs:
- Downsampling
- Visual smoothing
- Reduced point granularity
Because the visualization engine uses interpolation at low resolution, missing points may not appear as gaps in long‑range views.
Resolution
No fix is required. The behavior has been reviewed with Engineering leads and is confirmed as expected.
Key points:
- NativeEdge does not reconstruct missing Endpoint data after buffer overflow.
- Long‑range charts use downsampled, smoothed data—gaps may not be visually rendered.
If customers require strict visibility of missing metrics across long ranges, this may be considered for future enhancement, but is not part of expected functionality.
To detect missing data more visibly:
- Use "Last 7 Days" view where the granularity is higher.
- Review raw Endpoint Telegraf logs (if available before buffer drop).
- Monitor Endpoint connectivity status to prevent prolonged offline periods.