Onboard PowerEdge to Dell AIOps with OpenManage Enterprise
Summary: Follow the instructions in this article to onboard the PowerEdge Server to Dell AIOps.
Instructions
Introduction
Dell AIOps is a no-cost, cloud-native application developed by Dell that uses AI machine learning to proactively monitor and assess the overall health and performance of Dell storage systems and Connectrix switches. Dell AIOps provides intelligent, comprehensive, and predictive analytics to help IT teams maintain system performance and reliability. PowerEdge systems can be onboarded to Dell AIOps using the Dell Connectivity Client (Log in as a registered Dell Support user may be required to view this article) (for qualifying 15th, 16th, and 17th generation PowerEdge servers) or OpenManage Enterprise with the AIOps Observability plugin. The differences in feature support by connectivity type are explained in Dell Connectivity Client connection type for Dell AIOps.
Prerequisites for an OpenManage Enterprise Connection with AIOps Observability Plugin
Before onboarding your PowerEdge system to Dell AIOps, ensure that the following conditions are met:
- Users who log in to Dell AIOps must have Dell Support credentials for a business or corporate account and be able to log in to https://www.dell.com/support. See How to Register for Access to Dell Technologies Online Support or Upgrade an Existing Account
- All devices used with Dell AIOps must be under a ProSupport (or higher) contract to successfully send data to Dell AIOps. To check for ProSupport coverage, enter the service tag for devices on the Dell Support Services & Warranty page
- OpenManage Enterprise requirements:
- OpenManage Enterprise v3.7 or later
- OpenManage Enterprise v3.9 or later for cybersecurity support and modular chassis support
- OpenManage Enterprise v3.10 with AIOps Observability plugin v1.2 or above required for maintenance and firmware update operations
- CloudIQ Plugin v 1.1 or later, installed on OpenManage Enterprise for cybersecurity and modular chassis support
- Connection between OpenManage Enterprise and Dell Connectivity Service
- Port 443 is accessible to establish HTTPS connection between OpenManage Enterprise and Dell Connectivity Service.
- The primary network in OpenManage Enterprise is a public-facing network to allow for AIOps Observability plugin registration and file transfers between OpenManage Enterprise and Dell AIOps. Use the Text User Interface (TUI) in OpenManage Enterprise to select the primary network interface.
- During the configuration of the PowerEdge Server, OpenManage Enterprise should be configured to communicate with the iDRACs IP addresses. The iDRACs are the source of the information that is shown in Dell AIOps.
- Simple Network Management Protocol (SNMP) traps must be enabled for hardware health monitoring for all managed IDRACs (this can be done automatically as part of the iDRAC discovery task in OpenManage Enterprise). See additional information below.
- Access Groups provide a way for customers to limit the visibility of resources in MyService360. See Dell article 179622: Company Administration - Create and Manage Access Groups for details on Access Groups.
Supported Devices
- C Series sleds
- FC Series sales and chassis
- R Series
- T Series
- XC Series
- XE Series
- XR and XR2 Series
- FX Modular chassis
- MX Modular sleds and chassis
- M Modular compute sleds and chassis
- VRTX Series sleds and chassis
Unsupported Devices
- Input Output Aggregators (IOA)
- Dell VxRail Hyperconverged appliances
- Dell Storage modules
- Dell Networking devices—previously Dell Force10 devices
- Dell Technologies AX Nodes
- Non-Dell servers
Install the OpenManage Enterprise AIOps Observability Plugin.
- Log in to OpenManage Enterprise with an Administrator role.
- Go to Application Settings > Console and plugins. The AIOps Observability plugin is installed as part of the default OpenManage Enterprise install.
If it is already present, go to the Configure the AIOps Observability Plugin procedure. Otherwise, continue to the next step. - In the Plugins section, click Install for the AIOps Observability plugin. The Install and update multiple plugins wizard displays.
- From the Plugins available for install list, select the AIOps Observability Plugin, and then click Next.
- View the progress of the plugin in the Download section, and then click Next on completion.
IMPORTANT: The download continues even if you exit the wizard. - Read and accept the following agreements. After accepting, click Next to proceed with the plugin installation. The details of the number of users who are logged in to OpenManage Enterprise, tasks in progress, and scheduled jobs are displayed in the Review and confirm action dialog box.
- A consent form is displayed to inform you about the End User License Agreement (EULA). Click Accept.
- A consent form is displayed to inform you about the INFRASTRUCTURE TELEMETRY NOTICE. Click Accept.
- Select the "I agree that I have captured a backup of the OpenManage Enterprise appliance prior to performing a plugin action" option to confirm the installation, and then click Finish.
The appliance reboots, and the AIOps Observability plugin is installed.
Configure the AIOps Observability plugin.
Configuring the AIOps Observability plugin is a two-step process. The first step is to register the plugin with Dell Connectivity Service by using the access key and PIN to establish a secure connection with the Dell backend.
The second step is to specify the collector name, configure your cybersecurity data collection and maintenance operations under Collector Details, and select device groups to send data to Dell AIOps for cloud-based monitoring from Collector Scope.
- Register the plugin with Dell Connectivity Service.
- Log in to Enterprise with an Administrator role.
- From the Plugins menu, go to AIOps Observability > Overview. The Overview screen displays.
- (First time only) In the banner at the top of the Overview page under "APEX AIOps Observability," click Activate Now. This process validates connectivity to the Dell Connectivity Service infrastructure. If there is no connectivity with the Dell Connectivity Service, an error appears, and the user must configure a Proxy to communicate to the Dell Connectivity Service infrastructure.
- Do one of the following:
- If you have already registered your other OpenManage Enterprise plugins with Dell Connectivity Service, go to Step 2, "Configure Collector Details."
- OR
- If you have not yet registered with Dell Connectivity Service, continue to the next step.
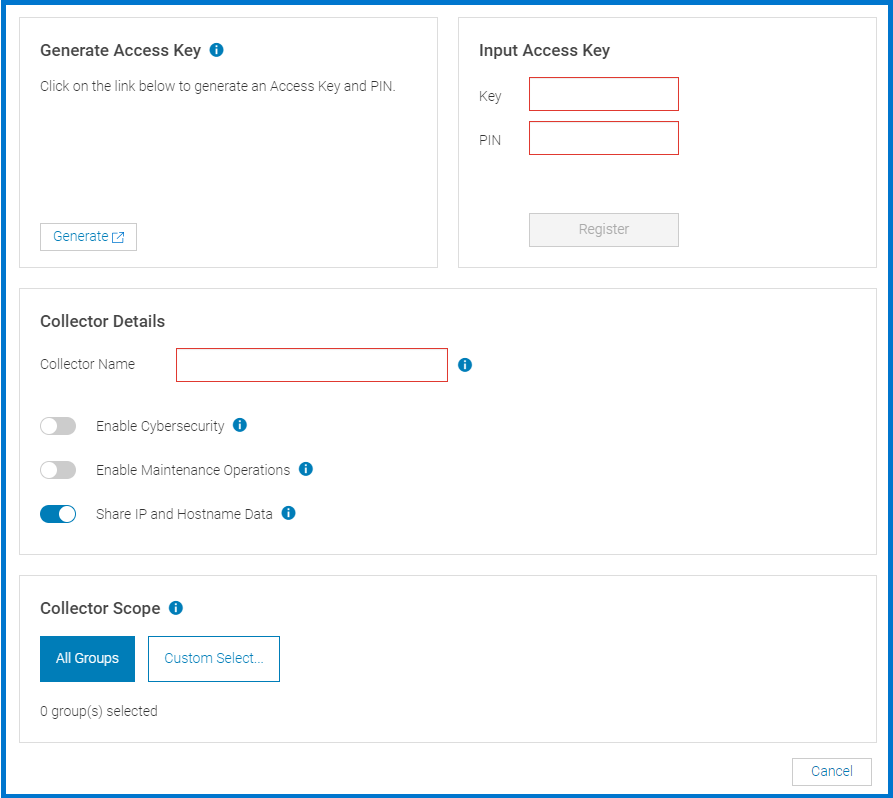
- In the Generate Access Key section, click Generate to create a new Access Key and PIN.
- Enter the generated information in the Key and PIN boxes. Once this one-time authentication process is completed and the credentials are validated, the section displays "This OpenManage Enterprise collector has successfully been registered to Dell Connectivity Services" and is marked with a Complete checkbox
- Click Register and wait for validation to finish.
- Configure Collector Details.
- In the Collector Details section, enter a collector name.
This is the name which displays for the collector in Dell AIOps. - Configure optional settings:
- Toggle on the Enable Cybersecurity slider to enable cybersecurity data collection.
- Toggle on the Enable Maintenance Operations slider to enable remote maintenance operations.
- Toggle on Share IP and Hostname data if you want to share the IP address and hostname information with Dell support.
Leave this setting off if you do not want to share this information. - In the Collector Scope section, do one of the following:
- Click All Groups
- OR
- Click Custom Select and select the device groups whose data you want to send to Dell AIOps for cloud-based monitoring.
- Click OK to confirm your selection.
- Review the changes including the collector name, cybersecurity data collection configuration, and the device groups that you selected and then click Apply to confirm your selection.
The AIOps Observability overview displays the AIOps Observability plugin registration and configuration information.
Accessing Dell AIOps Portal for First-Time Users
- In your browser, access Dell AIOps by going to https://aiops.dell.com.
- Log in to Dell AIOps using your Dell Support credentials.
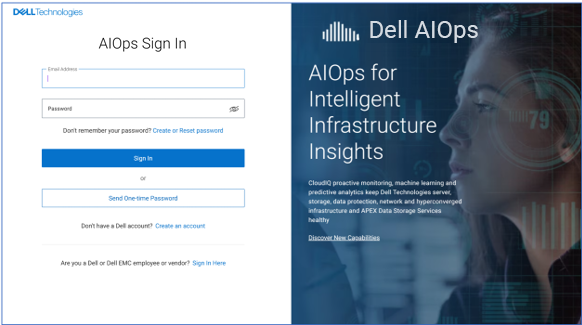
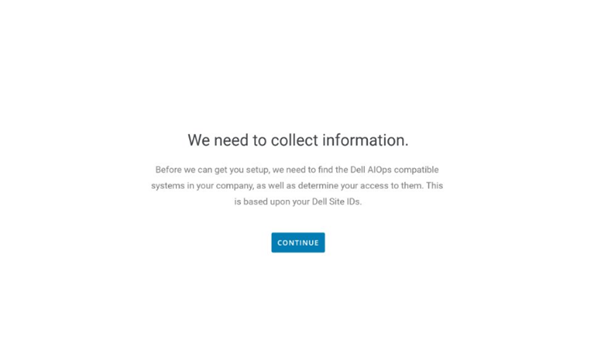
- When a new user logs in to Dell AIOps, they step through the following onboarding screens.

-
Dell AIOps retrieves the systems that are associated to the user's site IDs based on their support credentials. Click Continue.

-
Once the command finishes, it shows a Success screen.

-
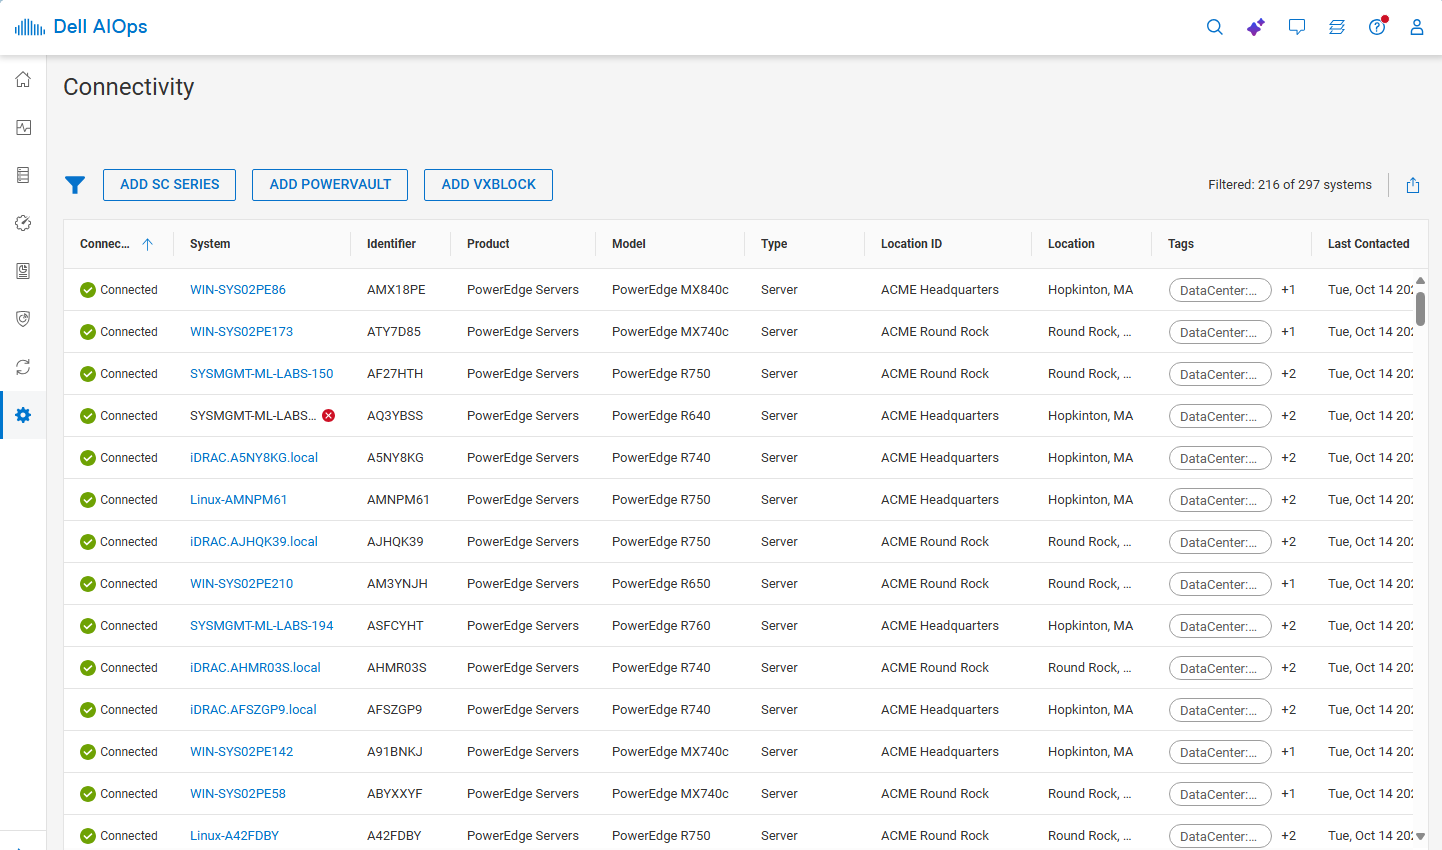
Upon logging in to Dell AIOps, the user sees all systems that are successfully sending data to AIOps.
Additional Information
If monitoring of server hardware health events is required, all managed iDRACs require the SNMP trap service, a trap destination, and the SNMP community name to be configured.
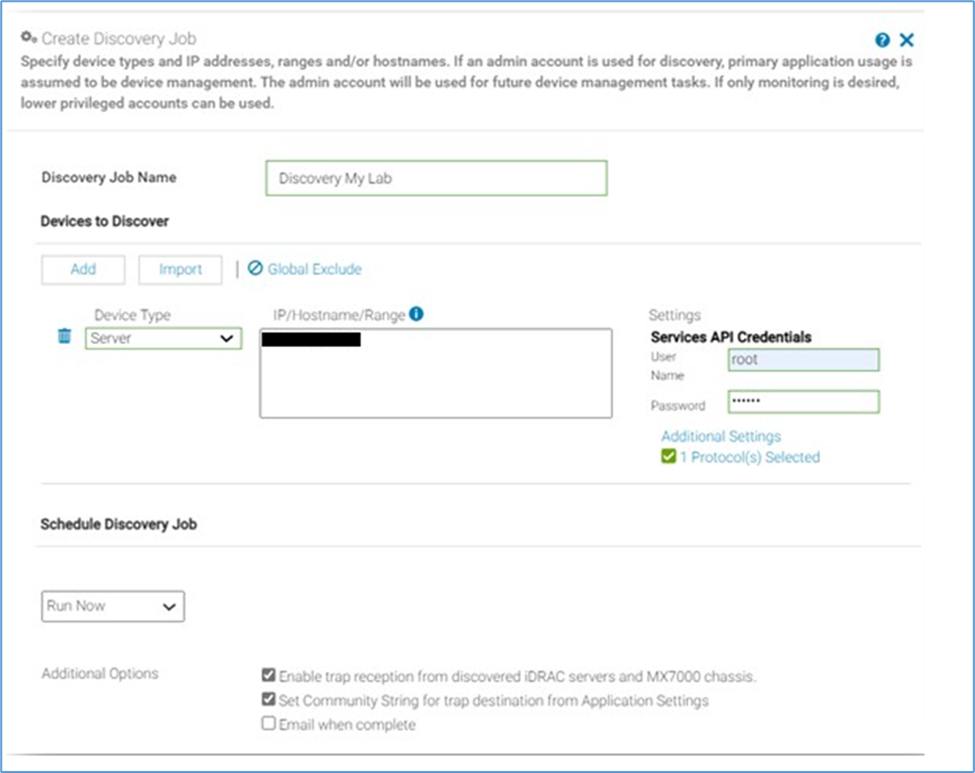
These iDRAC settings can be configured as part of a discovery task in OpenManage Enterprise when selecting server iDRAC discovery and using the additional options ticked boxes for enable trap and or set community.
Example of creating a discovery job in OpenManage Enterprise - at the bottom of the screen are two tick boxes so the discovery job enables the SNMP service, configure the SNMP community name and trap destination with OpenManage Enterprise information about any iDRACs that are discovered.
