Dell PowerEdge R770 Server Database Workload Benchmarking using TPROC-C
Executive Summary
This benchmarking report presents a structured evaluation of Dell’s PowerEdge R770 and R760 servers under scalable, real-world workloads. The assessment was conducted using VMware-based virtualization environments running MySQL databases with HammerDB load generators, modeled on TPROC-C benchmark protocols.
Key performance indicators such as Transactions Per Minute (TPM), New Orders Per Minute (NOPM), and power consumption were measured across increasing concurrency and workload scales. The tests used a standardized configuration (including dual Intel Xeon processors with 32 cores per socket) to simulate realistic enterprise operations.
The findings offer a comparative behavior profile between the two platforms, particularly across metrics like power efficiency, VM workload density, and concurrency performance—providing infrastructure teams with actionable reference points for planning and evaluation.
What follows is a neutral benchmarking analysis based on consistent configurations. It presents a measurable behavior profile across server generations and offers a practical reference for infrastructure teams evaluating system performance, platform evolution, or deployment planning, particularly in contexts where performance per watt, VM density, and concurrency are becoming critical infrastructure traits.
This study was conducted with authorized collaboration and inputs from Dell Technologies and Intel, ensuring alignment with platform configurations and benchmark standards.
Testing Methodology
We conducted controlled benchmarking tests to assess how Dell PowerEdge R770 and R760 servers handle transaction-based workloads under repeatable, scalable conditions.
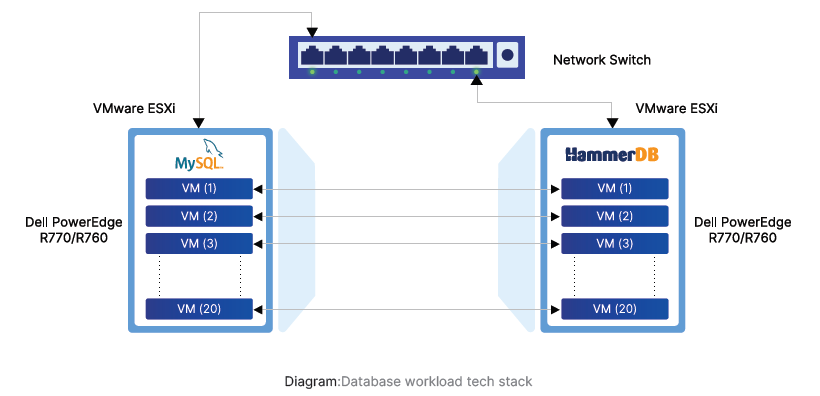
- Test Environment Configuration: The testing setup consisted of paired MySQL database virtual machines and HammerDB-based workload generators running on a virtualized infrastructure using VMware ESXi environments. Each configuration was designed to maintain consistency in virtual machine count, concurrency levels, and test duration.
- Key Metrics Captured: The benchmarking used the HammerDB tool configured to run workloads based on the TPROC-C protocol, which simulates transaction processing based on real-world scenarios. Each workload run involved a fixed number of virtual users and a defined number of warehouse units to simulate a realistic data and compute environment. Alongside transactional throughput, power consumption during runtime was also tracked to provide insight into the performance-to-power behavior of the servers under scale.
- Benchmarking Tool: Measurements were taken for transactions per minute (TPM), new orders per minute (NOPM), execution power draw, and network throughput. The goal was to observe server behavior in consistent conditions across different scales, ranging from small to high concurrency levels.
- Test Consistency: Each test iteration was conducted with the same control parameters to isolate the effect of server generation on performance, responsiveness, and resource usage.
Control measures
The test configuration was standardized on a 32-core CPU setup. This specification reflects the most commonly deployed core count in VMware-based virtualized environments, providing an appropriate balance between compute availability, licensing optimization, and scalability. By anchoring the benchmark on this configuration, the evaluation aligns with what infrastructure teams typically plan for in enterprise-grade deployments.
Here are the control parameters that defined our testing environment. These, as indicated before, were tweaked systematically to create credible and measurable observations.
| Hardware Specifications | Dell R770 (17G) | Dell R760 (16G) |
|---|---|---|
| Processors | ||
| Number of processors | 2 | 2 |
| Vendor and model | Intel Xeon 6737P | Intel Xeon 6548N |
| Core count (per processor) | 32 Core | 32 Core |
| Memory | ||
| Total memory (GB) | 1024 | 1024 |
| Type and speed | DDR5 RAM @ 6400 MT/s | DDR5 RAM @ 4800 MT/s |
| Network | ||
| NIC | 1x Broadcom BCM57608, 2x 100G OCPEthernet NIC | 1x Broadcom NetXtreme GigabitEthernet (BCM5720), 2x Intel Ethernet 100G E810-CAdapter |
| Storage Controller | ||
| Vendor and Model | BOSS-N1 DC-MHS | BOSS-N1 Monolithic (Embedded) |
| OS Drive Storage | ||
| Number of drives | 2 | 2 |
| Type | NVMe SSDs | NVMe SSDs |
| Drive size (GB) | 447.07 | 447.13 |
| Data Drive Storage | ||
| Number of drives | 6 | 3 |
| Drive size (TB) | 1.75 | 3.58 |
| Power | ||
| Power supplies | Delta 1500 Watt | 2800 Watt |
| Operating System and Version | ||
| VMware vSphere | 8.0U3 | 8.0U3 |
| Red Hat Enterprise (64 bit) | 9.1 | 9.1 |
| Workload - HammerDB | ||
| Version | TPROC-C 4.11 | TPROC-C 4.11 |
| Number of VMs |
20 | 20 |
| CPU per VM | 16 | 16 |
| Workload Parameters | 128 warehouses, 128 virtual users, all_warehouse=true | 128 warehouses, 128 virtual users, all_warehouse=true |
| RAM per VM (GB) | 64 | 64 |
| HD (GB) | 100 | 100 |
| Data and logs - MySQL | ||
| Version | 8.0 | 8.0 |
| Number of VM1 | 20 | 20 |
| CPU per VM | 16 | 16 |
| RAM per VM (GB) | 96 | 96 |
| HD for OS installation (GB) | 60 | 60 |
| HD for data (GB) | 300 | 300 |
| Metric | Definition | Logic |
|---|---|---|
| VMs (SQL) | Number of virtual machines running MySQL database instances | Represents database processing scale; more VMs simulate distributed database environments |
| VMs (HammerDB) | Number of virtual machines generating transactional load using HammerDB | Controls how load is distributed; more VMs can reduce local bottlenecks on generators |
| Virtual Users | Simulated users executing transactions concurrently | Represents concurrency in real-world systems; a higher number simulates peak usage scenarios |
| Warehouses | Logical units defined by the TPC-C workload, each with its own data subset | Simulates dataset complexity and size; more warehouses result in greater I/O and processing overhead |
| Server Platform | The hardware being tested (Dell PowerEdge R770 or R760) | The primary comparison point; allows performance evaluation across generations |
| ESXi Version | Hypervisor version under which the virtual machines run | Determines virtualization layer behavior; included to assess consistency across environments |
Observation metrics
Here are the metrics we tracked (observed) based on the changes to our control parameters.
| Metric | Definition | Logic |
|---|---|---|
| TPM (Transactions Per Minute) | Number of total transactions processed per minute | Primary performance indicator showing how the system handles transactional load under concurrency |
| NOPM (New Orders Per Minute) | Number of new order entries committed per minute | Tracks write-intensive workload responsiveness; relevant for systems under transactional stress |
| Power | Power consumed by the system during workload execution | Used to compute operational efficiency across varying transactional loads |
Correlation and derived efficiency metrics
| Metric | Definition | Logic |
|---|---|---|
| TPM per Watt | Ratio of TPM to power consumption | Normalizes performance against power; used to evaluate energy efficiency at different loads |
| NOPM change with load | Increase of NOPM with load (R770 vs R760) | Tracks concurrency handling efficiency; higher values suggest better multi-user performance |
| TPM change with load | Increase of TPMs with load (R770 vs R760) | Measures virtualization efficiency per database instance |
| Correlation Coefficients | Measures relationship between control inputs and performance metrics | Indicates how system variables like VM count or user load affect transactional behavior and power use |
Dell PowerEdge R770
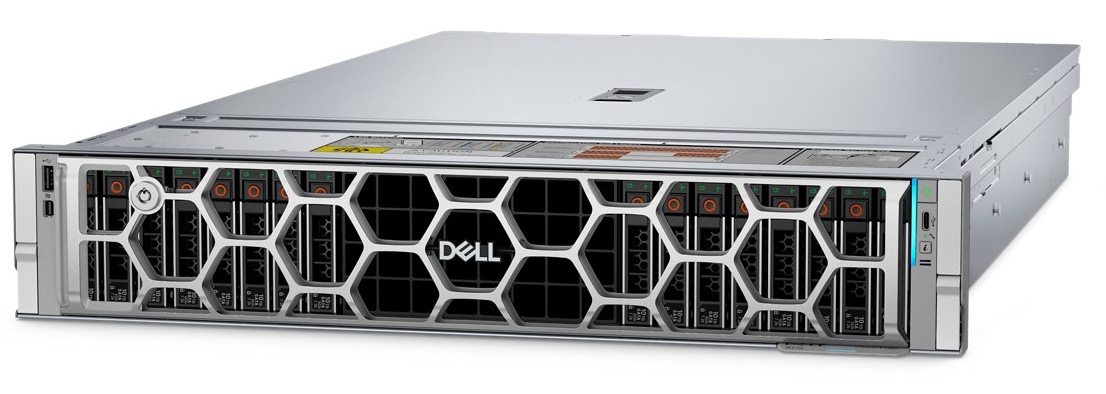
A next-generation compute platform powered by Intel Xeon 6 processors (former codename Granite Rapids). Built for performance-intensive environments, the server supports high I/O throughput, accelerator integration, and scalable memory bandwidth.
Ideal for workloads demanding concurrency stability, consistent virtualization output, and better power-to-performance efficiency under load.
Dell PowerEdge R760
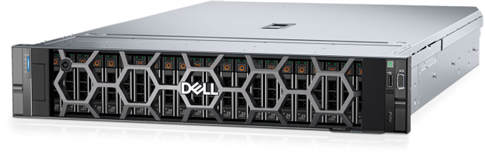
An infrastructure-optimized server built for general-purpose workloads, offering dependable performance across virtualized and cloud-native operations - powered by Intel® Xeon® Gold processors.
Designed to operate efficiently in constrained environments where space, power, and cost control are key factors.
Test Scenarios
All tests were conducted in a virtualized lab environment using ESXi infrastructure. SQL and HammerDB virtual machines were deployed in defined ratios to simulate real-world concurrency.
- Each test maintained a consistent mapping of user load, VM count, and warehouse configuration.
- Each test run was time-bound and triggered simultaneously across the SQL and load-generating VMs. The systems were left in a default state between runs to avoid environmental contamination.
- The same test sequence was used across both server models. Metrics were captured during the test runtime and directly after completion. The testing software was configured to log throughput and new order rates, along with network statistics. Power readings were recorded at pre-execution to isolate base system draw.\Each test point was validated through a complete run; partial passes or failures were not included in the dataset. This allowed a consistent performance line to be plotted across increasing complexity levels, while keeping the test environment stable.
Results and Observations
Each test was conducted under the same load structure for both Dell PowerEdge R770 and R760 servers, enabling a direct comparison. Metrics such as TPM, NOPM, power draw, and throughput were used to assess core performance and efficiency patterns. Each test was conducted under the same load structure for both Dell PowerEdge R770 and R760 servers, enabling a direct comparison. Metrics such as TPM, NOPM, power draw, and throughput were used to assess core performance and efficiency patterns.
| Correlation Basis | Metric | Peak Performance | Inference |
|---|---|---|---|
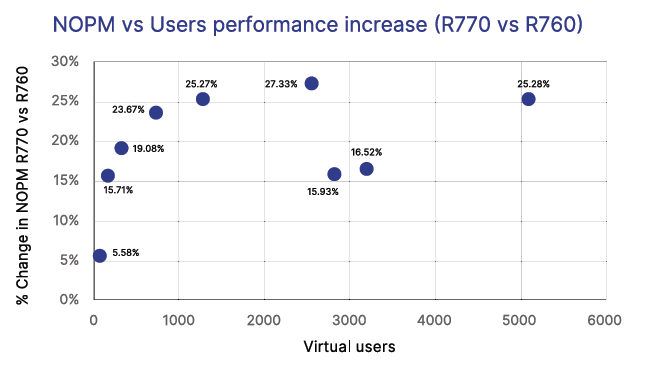
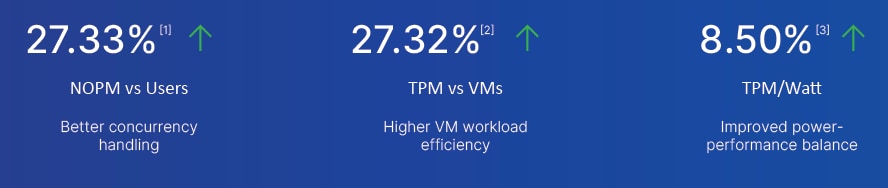
| Concurrency scaling efficiency | NOPM change | +27.33%[1] | Concurrency efficiency peaked under high user loads, showing robust multi-thread scaling in R770. |
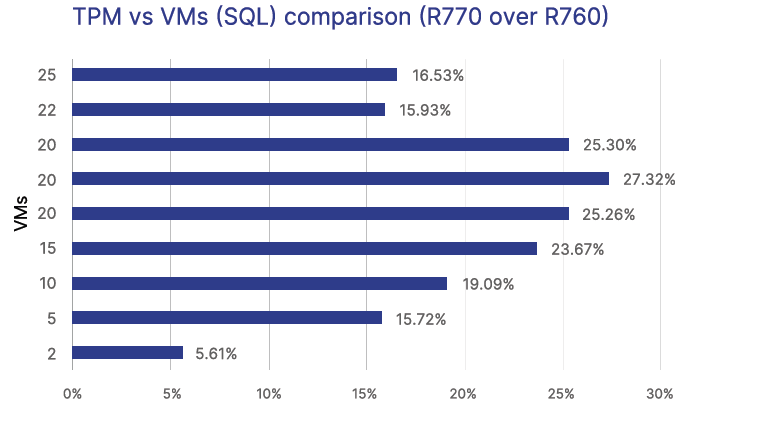
| Workload density efficiency | TPM change | +27.32%[2] | R770 handled more transactions with higher load (at scale), indicating better virtualization performance. |
| Efficiency to power ratio | TPM/Watt | +8.50%[3] | Highest performance-per-watt improvement observed in R770 under moderate workload. |
The results reflect consistent behavior under concurrency and scale, backed by the architectural strengths of Intel Xeon Scalable processors. These CPUs are designed to sustain throughput under multi-VM load conditions, with performance stability across workloads and runtime stages. The validated runs form a credible reference point for infrastructure evaluations.
NOPM change with increase in virtual users
Standouts in Dell PowerEdge R770
The Dell PowerEdge R770 showed measurable efficiency gains across key metrics, with up to 27.33%[1] improvement in NOPMs under high concurrency and sustained TPM gains across scaled workloads. These results were captured in controlled and scalable configurations.
While the overall power draw increased under load, the TPM per watt metric showed relative improvement under moderate workloads, aligning with expected energy efficiency gains in next-generation hardware. The system delivered consistent output across scale levels, supporting its role in environments where performance consistency is critical across dynamic operational states.
The R770’s performance trends suggest suitability for VM-dense, transactional, and hybrid workloads that demand throughput and control across distributed compute nodes.
Inferences and Conclusion
The gains observed in the R770 were not isolated to any one load profile. Instead, improvements were distributed across light to high-load scenarios, suggesting the system is structurally better suited for environments with variable demand. The correlation analysis supported this view, showing stable relationships between input controls (VMs, users) and output metrics (TPM, NOPM, power).
| Persona | Focus Area | Observed Metric Used | Practical Insight | Deployment Relevance |
|---|---|---|---|---|
| CXOs | Infrastructure return clarity | TPM/Watt, TPM per SQL VM | Higher efficiency per watt and per VM offers predictable output per asset invested | Supports cost-based scaling and infrastructure ROI mapping |
| CIOs / Infra Heads | Scalable performance planning | NOPM change, Power draw | R770 sustains throughput under growing user loads with stable power scaling | Assists in refresh planning across dynamic loads |
| System Architects / Tech Leads | Predictable system behavior | TPM change, scalable increase (correlation) | Scaling behavior remains consistent with increased VMs and concurrency | Helps model workloads and define VM density rules |
| IT Ops / Infrastructure Admins | Default performance reliability | Raw TPM, controlled conditions | Gains observed in realistic scenarios, implying out-of-box readiness | Simplifies deployment and reduces setup overhead |
| DevOps / Platform Teams | Resource isolation and distribution | TPM/User, VMs vs throughput | R770 handles heavier VM loads without transactional drop-off | Supports container scheduling and API concurrency planning |
These infrastructure traits - predictable scaling, consistent power-performance behavior, and I/O stability, also align with the baseline expectations of AI-adjacent workloads. While not tested explicitly for AI tasks, the R770’s behavior suggests readiness for environments where inference, streaming, or parallel compute tasks are evolving alongside traditional virtualized services.
Please also read the detailed science report (showcasing the deep logic and process followed during the benchmarking tests).
Appendix A - Testing environment assumptions
| Assumption Area | Assumption Description |
|---|---|
| Hypervisor settings | VMware ESXi default scheduler and memory allocation; in realistic scenarios. |
| BIOS/firmware | Factory-default BIOS settings for both servers, including CPU power profiles and turbo modes. |
| Cooling and power | Standard data center airflow and ambient conditions; Smart Cooling active on R770. |
| Test workload parity | Same HammerDB settings, virtual users, and transaction profiles applied across server generations. |
References
1. Based on Claim ID CLM-014581 – Testing was conducted by Calsoft with servers located in Dell Labs during the June 2025 timeframe. The R770 server was running 2-socket 6th Gen Intel® Xeon® 6737P CPUs with 32 Cores, compared to the R760 server running 2-socket 5th Gen Intel® Xeon® 6548N CPU with 32 cores.
2. Based on Claim ID CLM-014582 – Testing was conducted by Calsoft with servers located in Dell Labs during the June 2025 timeframe. The R770 server was running 2-socket 6th Gen Intel® Xeon® 6737P CPUs with 32 Cores, compared to the R760 server running 2-socket 5th Gen Intel® Xeon® 6548N CPU with 32 cores.
3. Based on Claim ID CLM-014583 – Testing was conducted by Calsoft with servers located in Dell Labs during the June 2025 timeframe. The R770 server was running 2-socket 6th Gen Intel® Xeon® 6737P CPUs with 32 Cores, compared to the R760 server running 2-socket 5th Gen Intel® Xeon® 6548N CPU with 32 cores.
Calsoft is a leading technology-first partner, providing digital and product engineering services. For over 25 years, Calsoft has been helping its customers solve their business challenges using technologies in Storage, virtualization, networking, security, cloud, AI/ML, IoT, and telecommunication domains.
Write to us at: marketing@calsoftinc.com
Website: www.calsoftinc.com