LLM-Serving Observability Framework
Revision history
Summary
Abstract
Summary
Overview
Summary
In today's AI-driven landscape, the reliability and performance of Large Language Model (LLM) services are more critical than ever. While many organizations are well on their way to some form of generative AI (GenAI) deployment and use case implementation, service availability, reliability, and optimization must be considered to gain true AI maturity.
In a recent study that Enterprise Strategy Group[1] conducted, organizations cited model services, monitoring, and operations as stop gaps:
- Model maintenance and monitoring (31 percent)
- Evaluation and optimization of performance GenAI solutions (31 percent)
- LLM operations (28 percent)
Observability is a vital component for any GenAI-based solution, offering visibility into usage, quality, costs, feedback, latency, and more. Effective observability is a precursor to evaluating the ROI and value of GenAI solutions, requiring high-quality usage data, feedback, and a mix of manual and automated evaluation metrics.
As organizations increasingly rely on AI to drive business outcomes, the need for robust observability frameworks is paramount to address this reliance. Dell Technologies has developed a comprehensive GenAI LLM-Serving Observability Framework to monitor and maintain LLM performance in real-time, setting a new standard in the industry .
This white paper highlights the strategic benefits of our framework, including its key features, value in upholding service level agreements (SLAs), and robust root cause analysis capabilities.
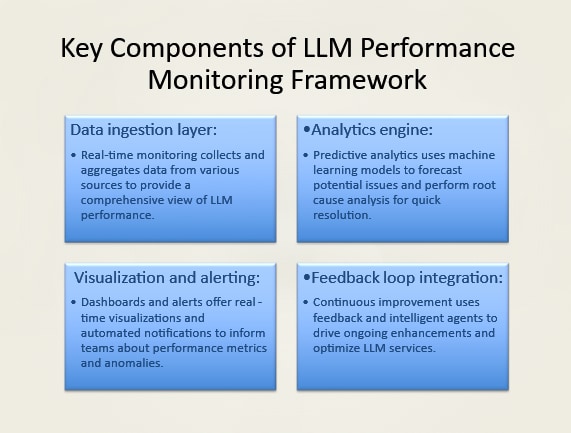
The architecture and operational processes enable a future state in which the analytics engine drives continuous improvement through feedback loops, machine learning, and agents.
The following figure shows a functional view of our AI acceleration Platform and its various capabilities:
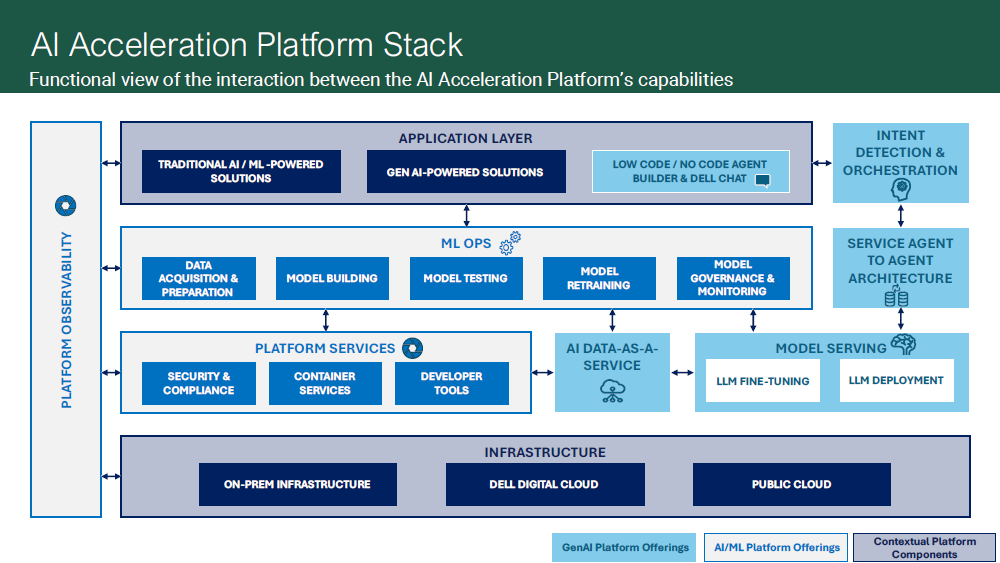
By using real-time monitoring, predictive analytics, and automated alerts, the framework provides unparalleled visibility and control over LLM operations. It plays a critical role in enhancing internal customer satisfaction, maintaining SLA compliance, and guaranteeing service availability for our highest-volume use cases.
The following figure describes the key components of the framework:
[1] Enterprise Strategy Group "Assessing AI Maturity: Measuring the State of the Market and What Organizations Stand to Gain by Advancing Their AI Sophistication", March 2025
Solution description
Introduction
Real-time monitoring
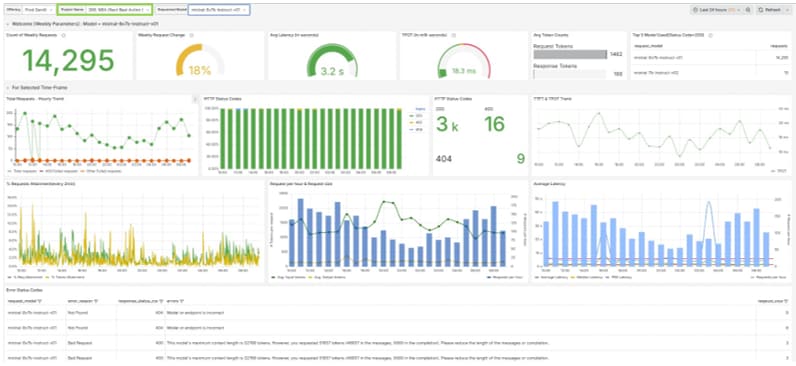
The framework employs real-time monitoring to track the health and performance of LLM services continuously. Using tools such as Grafana Dashboard, it provides detailed visualizations of service metrics, including:
- Request rates to enable you to understand the volume of incoming requests handled by the LLM services.
- Latency statistics to track the response time of services to ensure quick and efficient processing.
- Error rates to monitor the frequency of errors to identify and resolve issues promptly.
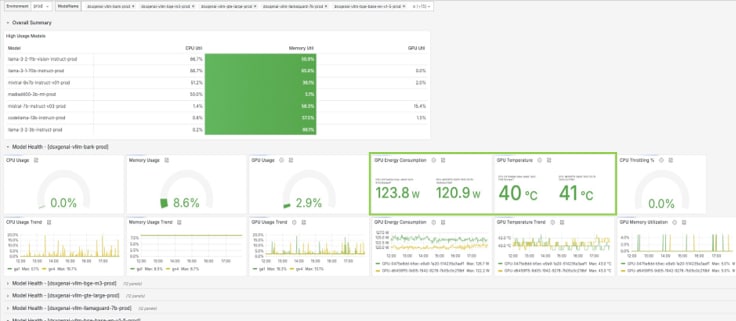
The following figure shows the Grafana dashboard:
Resource use levels
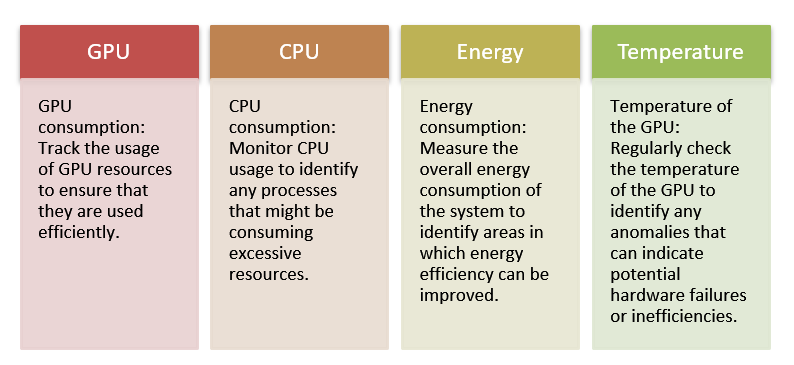
Analyze the resource consumption to optimize infrastructure and avoid bottlenecks. This task includes monitoring:
The following figure shows the Grafana dashboard:
The following figure shows the Grafana dashboard:
Automated alerts and incident management
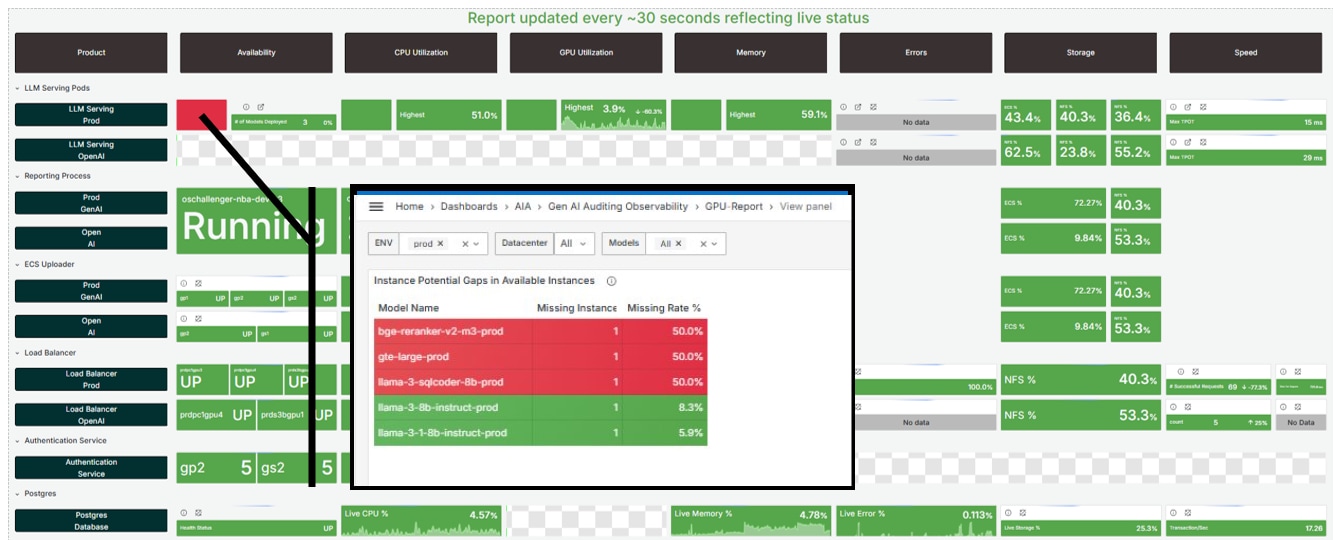
The observability framework is integrated with an automated alerting system. When predefined thresholds are breached or anomalies are detected, alerts are instantaneously triggered, ensuring prompt notification and resolution.
The following figure shows a real-time, automated alert for a model capacity breach:
Predictive analytics
Root Cause Analysis (RCA) capabilities
A standout feature of the framework is its exceptional root cause analysis capabilities. When an issue arises, the framework can dissect and analyze the problem across various dimensions, such as:
- Model-source
- Identification of whether the issue stems from a particular model
- Client-specific interactions
- Examination of specific clients to understand if the issue is isolated or widespread
- Request patterns
- Analysis of the patterns and sequences of requests leading up to the issue
- Real-world scenario
- Use in a real-world scenario, for example, Black Friday holiday shopping
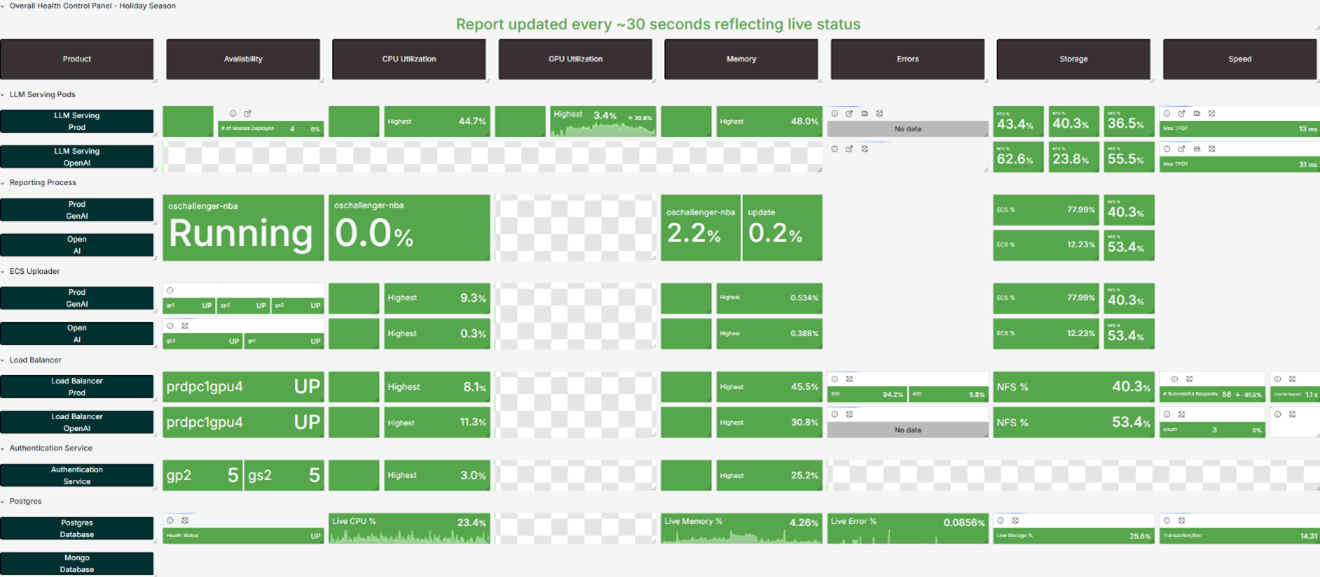
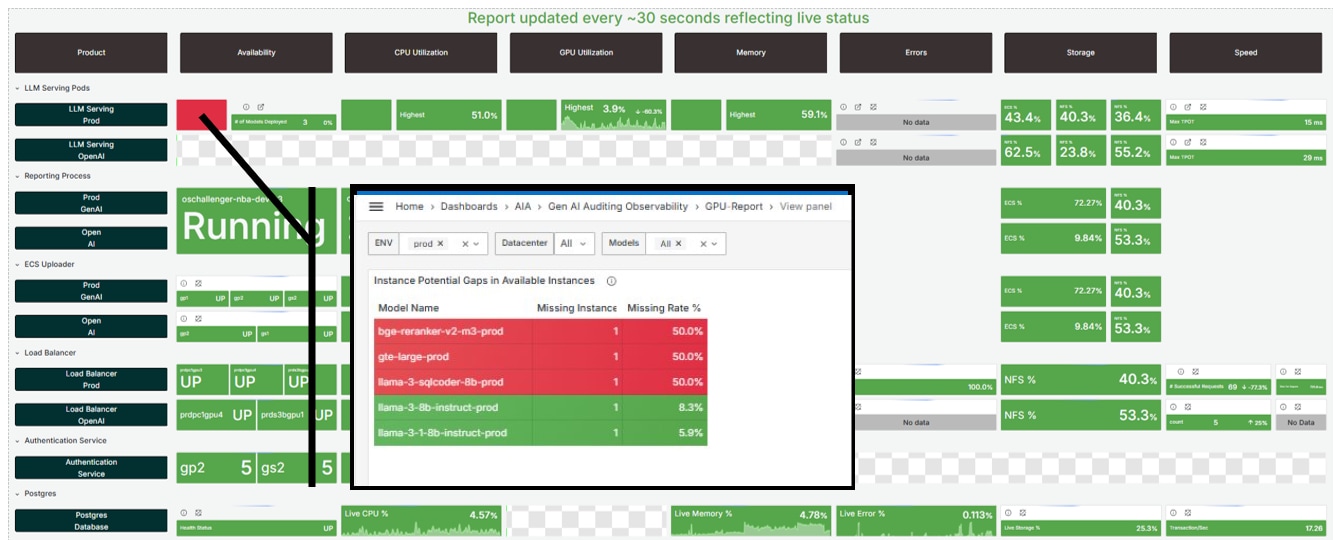
During high-traffic events such as Black Friday and Cyber Monday holiday shopping, we can monitor key metrics, including energy consumption. For instance, tracking the energy use of specific model serving instances helps us understand the impact on overall performance. This comprehensive monitoring helps improve services and set up SLAs, enabling timely interventions.
The following figure shows an example of real-time monitoring reflecting platform status:
Business impact
Introduction
Strategic benefits
Architecture and process flow
The architecture of the LLM-Serving Observability Framework is designed for scalability, reliability, and ease of integration.
The architecture of the LLM-Serving Observability Framework is designed for scalability, reliability, and ease of integration. The following list provides a high-level overview of the architectural components and their interactions:
- The agent monitoring component is deployed on each server hosting LLM services to collect detailed metrics and logs.
- The metrics aggregator component is a centralized service that aggregates data from all monitoring agents for processing.
- The data storage component stores the aggregated metrics and logs, and typically employs time-series databases for metrics and NoSQL databases for log data.
- The alerting system component monitors real-time data against predefined thresholds and triggers alerts when anomalies are detected.
- The dashboard and visualization component uses Grafana and other visualization tools to present a comprehensive view of system health.
- In its future state, the analytics engine performs predictive analysis and root cause analysis using advanced machine learning algorithms.
As we establish a feedback loop, we can identify patterns and adjust our alerting mechanisms to improve the time to resolution. We can:
- Predict anomalies by analyzing historical data. The engine can forecast potential issues before they occur, allowing for proactive measures.
- Identify root causes. Machine learning algorithms help identify the underlying causes of anomalies, facilitating quicker and more accurate resolutions.
- Optimize alerting. Continuous feedback refines our alerting system, ensuring that alerts are timely and relevant, reducing false positives and improving response times.
- Adapt to changes. The feedback loop enables the system to learn and adapt to new patterns and behaviors, maintaining its effectiveness over time.
By using this advanced analytics engine, we can enhance our ability to maintain optimal performance and efficiency, ensuring a robust and resilient infrastructure.
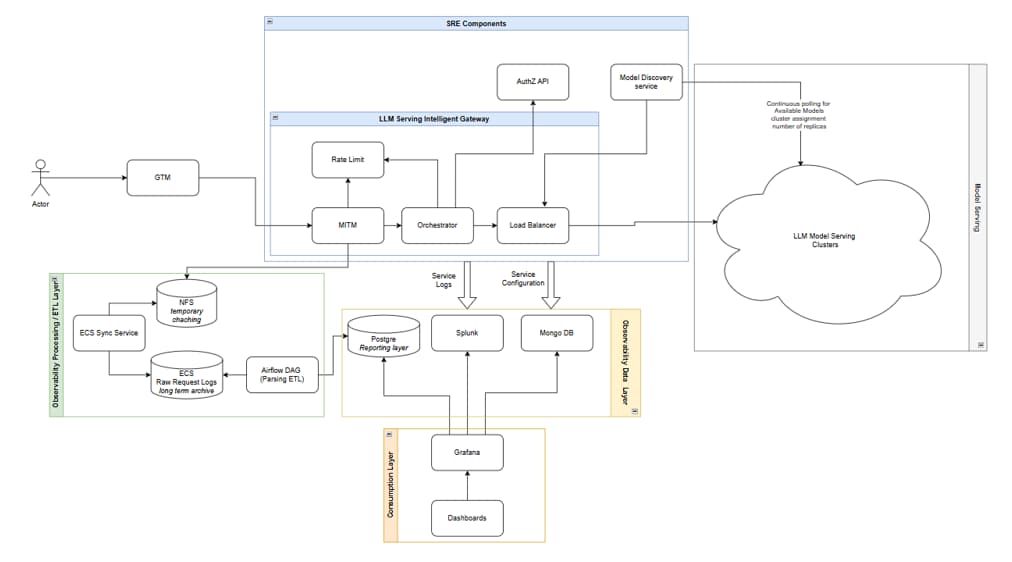
The following figure shows the LLM Serving Observability process flow:
Conclusion
Summary
We value your feedback
Appendix A Use case examples
Introduction
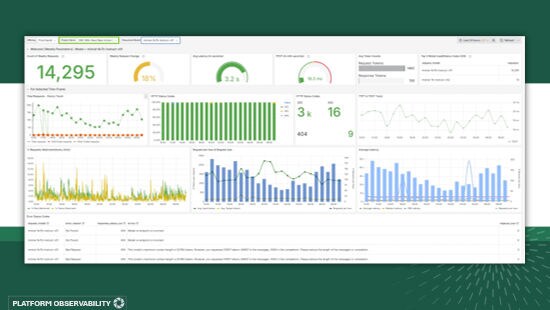
Client-specific interactions
Examine specific clients to understand if an issue is isolated or widespread, as shown in the following figure:
Real-world scenario: Monitoring holiday shopping
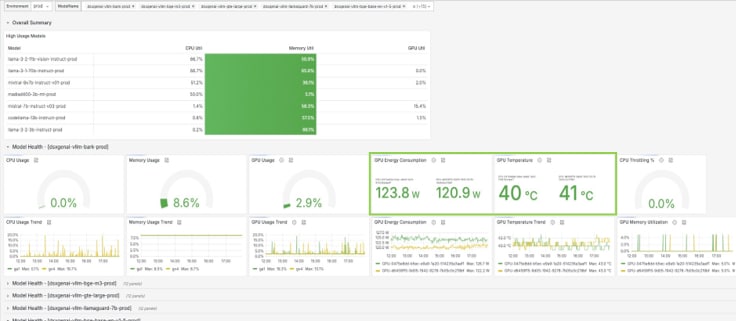
During high-traffic events such as Black Friday and Cyber Monday holiday shopping, we monitor key metrics, including energy consumption. For instance, tracking the energy use of specific model serving instances helps us to understand the impact on overall performance.
The following figure shows that we also have views at the individual use-case level, in which we connect infrastructure performance to specific use cases by monitoring:
- GPU and CPU utilization metrics
- Speed, latency, and overall usage
Figure 10. Infrastructure performance 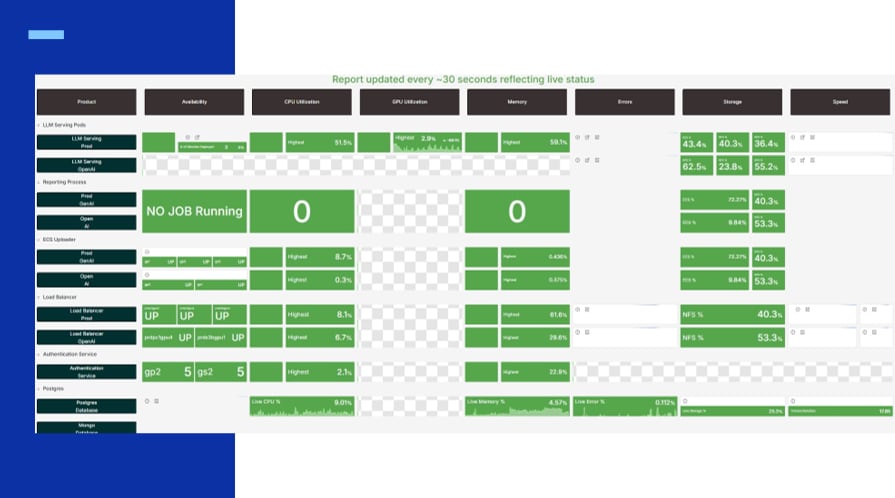
This comprehensive monitoring helps us improve our services and set up SLAs, enabling timely interventions.
- Resource utilization levels
Monitor resource use levels to analyze the resource consumption to optimize infrastructure and avoid bottlenecks, as shown in the following figure:
Figure 11. GPU Capacity monitoring board 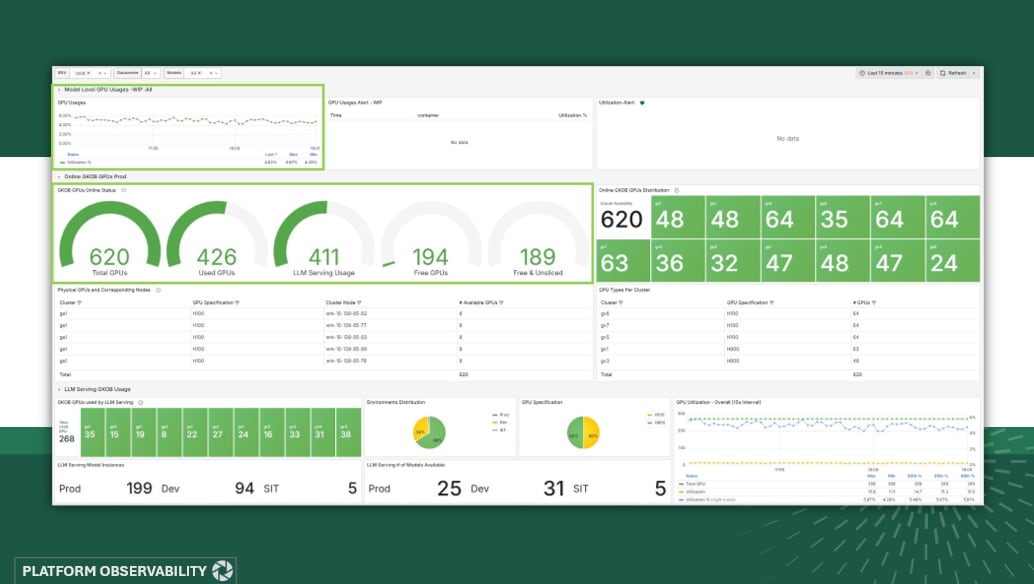
- GPU consumption
Track the use of GPU resources to ensure that they are being used efficiently. Monitor the temperature of the GPU to detect any overheating issues early.
- CPU consumption
Monitor CPU use to identify any processes that might be consuming excessive resources. This information helps to balance the load and prevent performance degradation.
- Energy consumption
Measure the overall energy consumption of the system to identify areas in which energy efficiency can be improved. This measurement helps reduce operational costs and environmental impact.
- GPU temperature
Regularly check the temperature of the GPU to identify any anomalies that can indicate potential hardware failures or inefficiencies. Maintaining optimal temperature levels is crucial for the longevity and performance of the GPU.
By closely monitoring these parameters, you can detect anomalies at a lower level and take proactive measures to maintain optimal performance and efficiency of your infrastructure.
The robust root cause analysis capabilities enable quick identification and resolution of issues. This efficiency in troubleshooting not only reduces the mean time to repair (MTTR) but also ensures that any underlying issues are thoroughly addressed, preventing recurrence.
Appendix B Architecture and process flow
Summary
The architecture of the LLM Serving Observability Framework is designed for scalability, reliability, and ease of integration. This appendix provides a high-level overview of the architectural components and their interactions.
Process flow and architecture
The following figure shows the flow of data and interactions between these components:
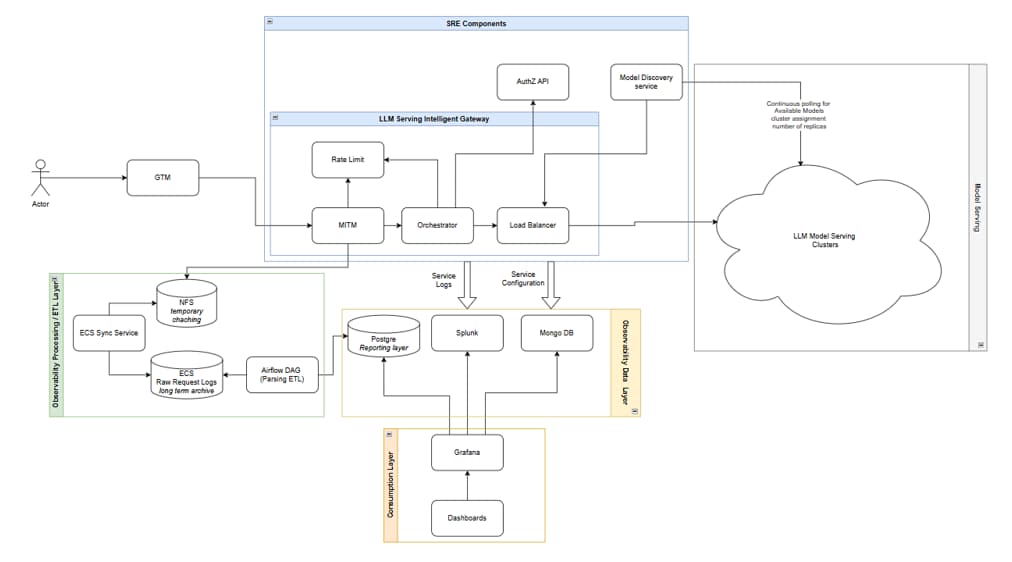
The technologies that are used include:
- Grafana, which is a powerful open-source platform for monitoring and observability. It allows you to visualize metrics, logs, and traces from various data sources, helping you monitor the health and performance of your systems in real-time.
- PostgreSQL, which is an advanced open-source relational database management system. It is used for performing SQL queries to verify model deployment and ensure data integrity.
- Apache Airflow, which is an open-source platform to author, schedule, and monitor workflows programmatically. It is used for running Directed Acyclic Graphs (DAGs) to capture model data and update reports.
- ECS, which is the Simple Storage Service (S3) is used for storing trace messages from the load-balancer. It provides scalable object storage with high availability and security.
- MITM, which captures and analyzes HTTP requests and responses. These results pinpoint slow responses or oversized payloads to fix delays. Intercepting traffic to see what data is being sent and received, also helps debug data-related problems.
- MongoDB, which is a document-oriented NoSQL database that provides scalability, high availability, and advanced querying capabilities.
- Splunk, which is a platform for searching, monitoring, and analyzing machine-generated data, offering real-time monitoring, advanced analytics, and enhanced security and observability.
Data reconciliation
Data reconciliation is a critical process to ensure data integrity and consistency across different systems. In our framework, we perform data reconciliation by verifying three different record counts on an hourly basis:
- Hourly file counts in ECS S3:
- We track the number of files that are stored in the Dell ECS (Simple Storage Service) each hour. This process ensures that all expected datafiles are uploaded and stored correctly.
- Hourly file counts as per request timestamp:
- We verify the number of files based on the timestamps of incoming requests. This task ensures that the data being processed and stored aligns with the actual request activity within the system.
- Hourly request count in auditing tables:
- We maintain auditing tables that log each request the system processes. By comparing the hourly request counts in these tables with the file counts, we can identify any discrepancies and ensure that all requests are accounted for with data retention of 190 days.
Reconciliation in rate-limit report
To monitor and manage rate limits, we track the counts of 429 (Too Many Requests) responses. This process helps us understand how often the system is reaching rate limits and allows us to adjust configurations or optimize performance to reduce these occurrences.
By monitoring these counts, we can set SL limits and use the data as a feedback loop to estimate hardware capacity. This process ensures that the system remains in acceptable operational thresholds, provides a smooth user experience, and supports strategic planning for infrastructure needs.
These reconciliation processes are vital for maintaining the accuracy and reliability of our data, ensuring that the framework operates effectively and efficiently.
Appendix C Duration monitoring
Summary
This appendix provides examples of several use cases.
LLM-serving benchmarks are an essential component of quality control and root cause analysis (RCA) that monitor each step of the inferencing process. We can identify and address any changes in latency and time per operation (TPO) metrics. By locating the source of delays—whether they stem from load balancing, the model itself, the Gateway-orchestrator, or other components—we can effectively troubleshoot and resolve performance issues, as shown in the following figure:
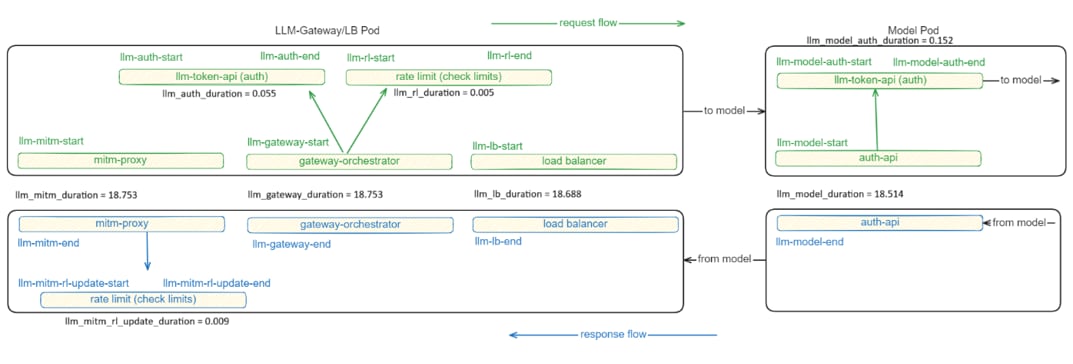
To resolve performance issues, we have embedded mechanisms to track and log all calls. Performance issues are reflected through alerting thresholds visible on our real-time dashboards, as shown in the following figure: