PowerScale OneFS: Advanced Alert Configurations
Executive summary
Overview
This white paper provides configuration considerations and best practices of Dell PowerScale OneFS Alerting including the following topics:
- The detailed configuration considerations covering all three types of alerts in OneFS:
- SMTP (Simple Mail Transfer Protocol) alerts
- SNMP (Simple Network Management Protocol) TRAP
- General alert configuration considerations and typical alert configuration scenarios
- Detailed configuration considerations for the OneFS SNMP monitoring feature
- Useful tools and CLI commands introduction and explanation
- The complete SNMP TRAP list for OneFS
- The complete query list for the SNMP monitoring feature
Audience
This guide is intended for experienced system and storage administrators who are familiar with file services and network storage administration. This guide assumes the reader has a working knowledge of the following:
- Network-attached storage (NAS) systems
- The SNMP and SMTP protocols
- The PowerScale scale-out storage architecture and the PowerScale OneFS operating system
Readers should also be familiar with PowerScale documentation resources including:
- Dell Community Network info hubs
- Dell OneFS release notes, which are available on the Dell support network and contain important information about resolved and known issues.
- Dell PowerScale OneFS Best Practices
Revisions
|
Part number/ |
Description |
|
|
May 2018 |
|
Initial release |
|
April 2019 |
|
Updated for OneFS 8.2.0 |
|
May 2020 |
|
Updated for OneFS 9.0.0.0 |
|
August 2020 |
|
Updated for OneFS 9.1.0.0 including configurable event threshold |
|
April 2021 |
H17458 |
Updated for OneFS 9.2.0.0 including
|
|
April 2022 |
H17458.1 |
Update for OneFS 9.4.0.0, including:
|
|
June 2024 |
H17458.2 |
Template conversion, published in HTML. |
We value your feedback
Dell Technologies and the authors of this document welcome your feedback on this document. Contact the Dell Technologies team by email.
Author: Vincent Shen
Note: For links to other documentation for this topic, see the PowerScale Info Hub.
Alert configuration consideration
This section focuses on the types of alert notifications that OneFS supports:
- SMTP alerts
- SNMP TRAP
- ConnectEMC alerts
For each type of alert, the specific architecture and detailed configuration considerations will be discussed and explained in the following sections. Apart from that, this section will also introduce some general alert configuration considerations which apply to all the three types of alerts. Finally, it will provide some typical examples to configure alerts in OneFS.
Alert architecture
Figure 1 shows the overall architecture of the alert system in OneFS.
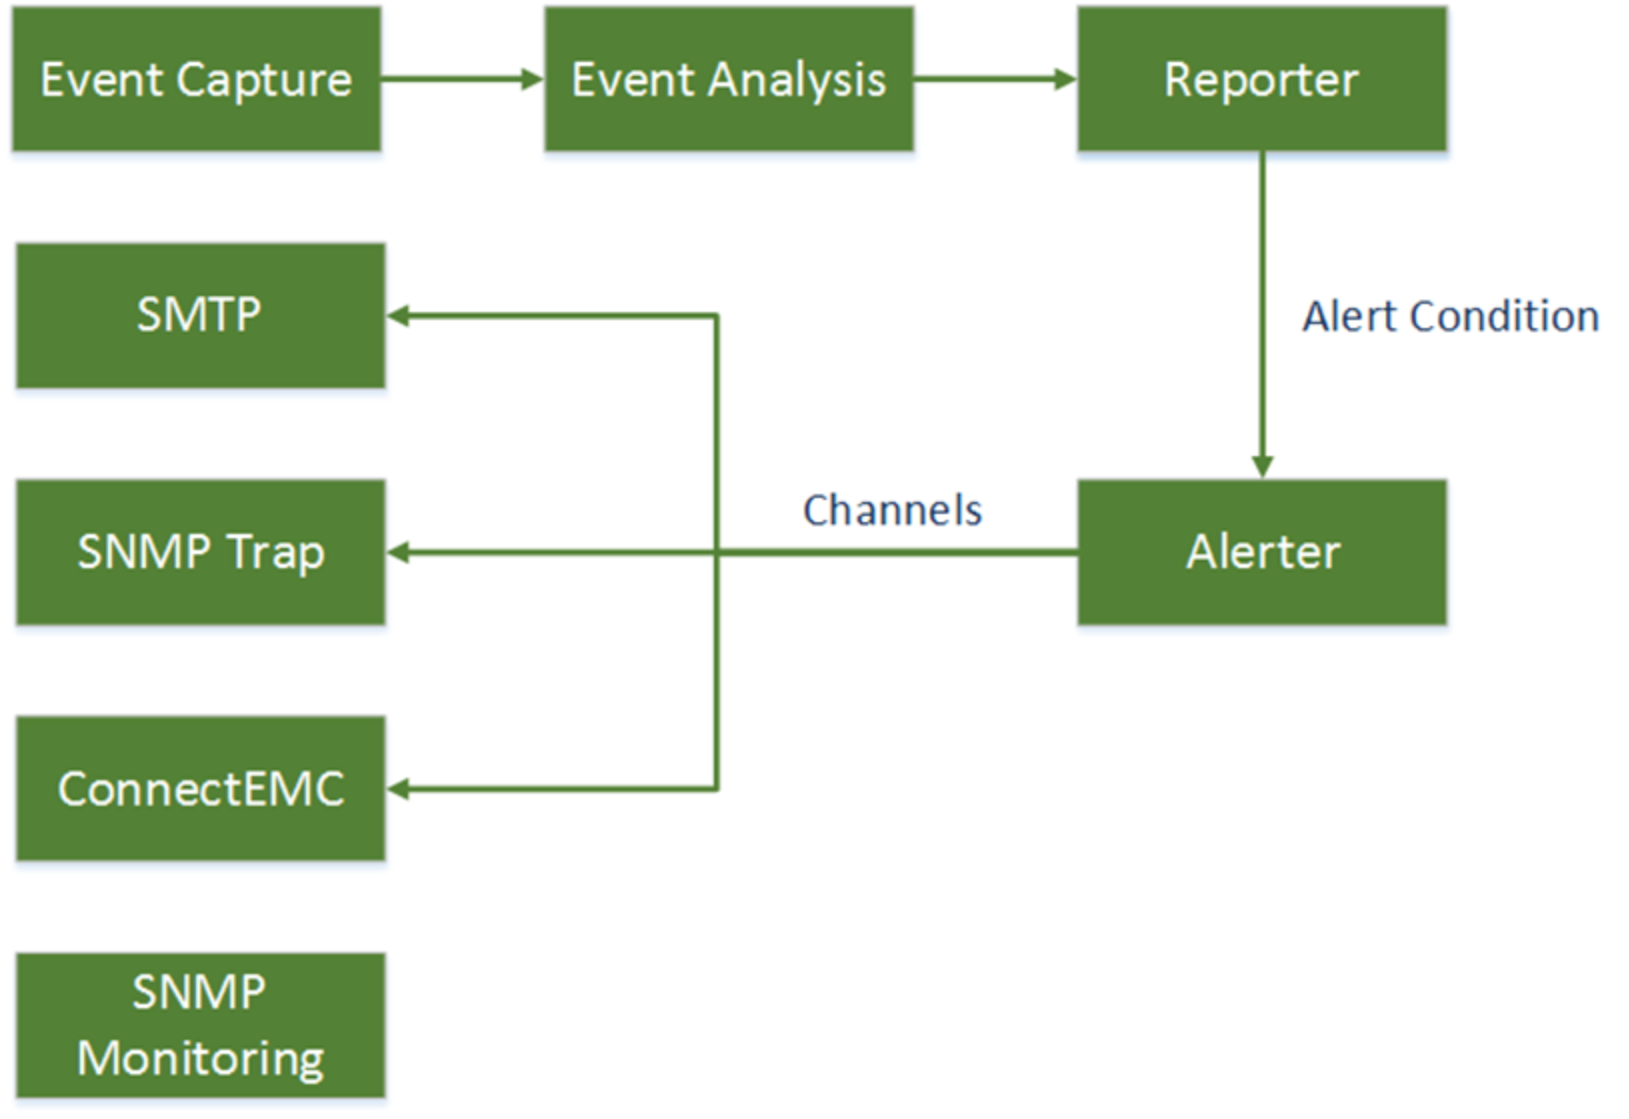
Figure 1. Alert architecture
Event Capture is the first stage in the processing pipeline. It is responsible for reading event occurrences from the kernel queue, storing them safely on persistent local storage, generating attachments and queueing them in priority buckets for analysis.
Event Analysis is the second stage in the processing pipeline. The main analysis process collects related event occurrences together as event group occurrences, which can be processed by the next stage – Reporter.
Reporter is the third stage in the processing pipeline. The reporter periodically queries Event Analysis for event group occurrences which have changed. For each of these changes, Reporter evaluates any relevant alert conditions, generating alert requests for any events which are satisfied to the next stage – Alerter.
Alert Condition defines how event group occurrences are alerted. An alert condition states that a specified set of event groups will be reported on by a specified set of channels under a specified condition as described in Table 1:
Table 1. Alert condition types
|
Description |
|
|
New event groups |
Reports on event group occurrences that have never been reported on before. |
|
New events |
Reports on event group occurrences that are new since the event group was last reported on. |
|
Interval |
Provides periodic reports on event group occurrences that have not been resolved. |
|
Severity increase |
Reports on event group occurrences whose severity has increased since the event group was last reported on. |
|
Severity decrease |
Reports on event group occurrences whose severity has decreased since the event group was last reported on. |
|
Resolved event group |
Reports on event group occurrences that have been resolved since the event group was last reported on. |
Alerter is the final stage in the processing pipeline. It is responsible for actually delivering the alerts requested by the reporter.
Channel is a named destination for alerts. A channel specifies the mechanisms by which alerts are sent, which are listed below:
- SMTP
- SNMP TRAP
- ConnectEMC
Figure 2 shows the relationship between event group categories, event types, and event groups.
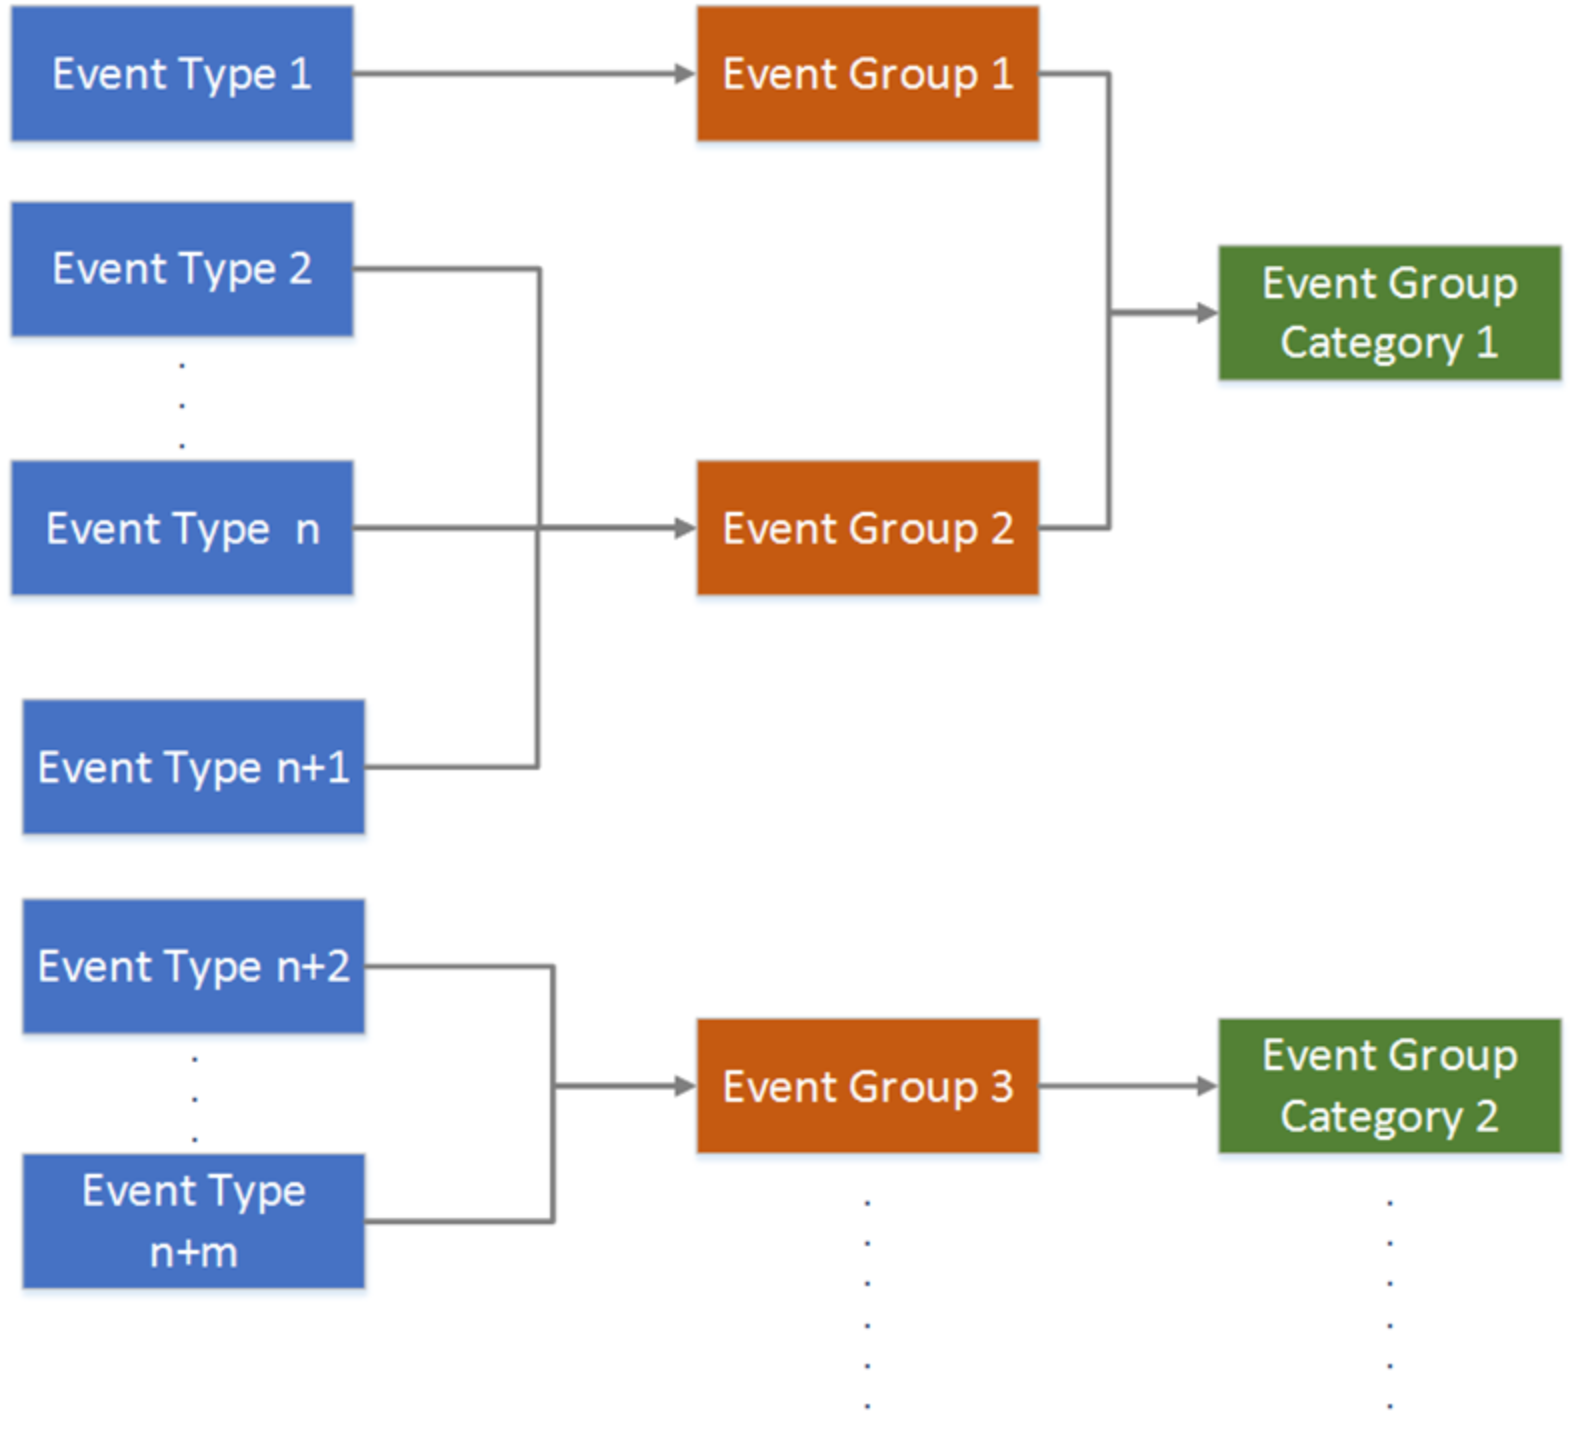
Figure 2. Event group category, event type, and event group
Event group category defines 10 subsets of events at a very high level as listed in Table 2. For each event group category, there are several events defined. An event definition is also known as an event type which is for a specific type of event. Event groups contain closely related event occurrences.
Table 2. Event group categories
|
Event group category name |
|
|
100000000 |
System disk events |
|
200000000 |
Node status events |
|
300000000 |
Reboot events |
|
400000000 |
Software events |
|
500000000 |
Smart Quotas events |
|
600000000 |
Snapshot events |
|
700000000 |
Windows Networking events |
|
800000000 |
Filesystem events |
|
900000000 |
Hardware events |
|
1100000000 |
CloudPool events |
Event groups are collections of individual events that shares related symptoms of a single situation on the PowerScale cluster. Event groups provide a single point of management for multiple event instances that are generated in response to a specific situation on the cluster. Starting from OneFS 8.0, the related events are organized into event groups. In this case, the CLI command isi event is an abbreviation for isi event group.
General alert configuration considerations
The following sections list some general alert configuration considerations including the following:
- Alert granularity customization
- Alert severity configuration
- Alert configuration by the deny list
- Stop receiving alert notifications for heart beat events
- Cause Long vs. Cause Short
Alert granularity customization
As covered in the section Alert architecture, events are organized into event groups and event groups are categorized by the event group categories. Alerts can be configured in different granularities by event group categories or event groups through the web UI and the CLI command. The following examples demonstrate alert configuration using both of these granularities.
The following command creates an alert named demo_alerts, sets the alert condition to NEW and sets the event group categories to System disk events and Node status events subscribing to all new event groups in these categories. To view all the event group categories, see Table 2.
isi event channels create mychannel smtp --address my_email@xxx.com --smtp_host smtp.xxx.com
isi event alerts create demo_alerts --category "100000000,200000000" NEW mychannel
The following command creates an alert named demo_alerts, sets the alert condition to NEW and only subscribes to event groups 100010001 and 100010009.
isi event alerts create demo_alerts --eventgroup "100010001,100010009" NEW mychannel
To view all the event groups which can be subscribed through SMTP in the form of the combination of event group ID, event group name, event group description and the belonging event group category, use the following CLI command:
isi event types list –format list
Sample output:
--------------------------------------------------------------------------
ID: 900100017
Name: HW_NVRAM_SRAM_ECC_CORRECTABLE
Category: 900000000
Description: NVRAM SRAM correctable (single-bit) ECC error in chassis {chassis} slot {slot}
--------------------------------------------------------------------------
Note: The command isi event types list is only available in OneFS 8.0.0.5 and later versions.
Alert severity configuration
It is highly recommended to tune the alert severity based on each specific environment to minimize unnecessary email alerts. The only way to configure alert severity is to use the OneFS CLI.
The following command creates an alert named ExternalNetwork, sets the alert condition to NEW, sets the source event group to the event group with the ID number 400160001, sets the channel that will broadcast the event to RemoteSupport and sets the severity level to critical:
isi event alerts create ExternalNetwork NEW --eventgroup 400160001 --channel RemoteSupport --severity critical
The following example modifies the alert named ExternalNetwork to ExtNetwork, adding the event group with an event group ID number of 400160001, and filtering so that alerts will only be sent for event groups with a severity value of critical:
isi event alerts modify ExternalNetwork --name ExtNetwork --add-eventgroup 400160001 --severity critical
Alert configuration by the deny list
It is a quite common scenario to configure alerts by deny list which means to alert on all the types of event groups except type X, Y, and Z. The following examples will demonstrate how to achieve this function by a custom script. This example will subscribe to all event group types except 400160001 in the SMTP alerts configuration. The implementation is different between OneFS versions before 8.0.0.5 and later:
- In OneFS version 8.0.0.0 – 8.0.0.4, create a file called eventgroups.py containing the following code. This is to generate a collection of all the event group types.
#!/usr/bin/python
import json
efile="/etc/celog/events.json"
egfile="/etc/celog/eventgroups.json"
with open(efile, "r") as ef:
e = json.loads(ef.read())
with open(egfile, "r") as egf:
eg = json.loads(egf.read())
out = []
symptoms = []
for eg,v in eg.iteritems():
if eg != v["name"]:
print "warning.. name not same %s" % eg
out += [eg]
for s in v["symptoms"]:
symptoms += [s]
for e,v in e.iteritems():
if e not in symptoms:
out += [e]
print ",".join(out)
- Create an SMTP channel and associate it with a customized alert to exclude event group type 400160001.
isi event channels create mychannel smtp --address my_email@xxx.com --smtp_host smtp.xxx.com
isi event alert create myalert NEW mychannel --eventgroup `./eventgroups.py | sed 's/,400160001//'`
- To verify the configuration, send a test alert by leveraging the following script. The expected outcome is that the SMTP alert for event group type 40005002 is sent to the subscriber.
/usr/bin/isi_celog/celog_send_events.py -o 400160001
/usr/bin/isi_celog/celog_send_events.py -o 400050002
In 8.0.0.5 and later versions, the list of event group types is available by isi event type list. It will do the same job as the scripts in the above step 1 to generate a collection of all the event group types. Setting up an SMTP alert for all event group types except 40016001 is described below:
- Create an SMTP channel and associate it to a customized alert to exclude event group type 400160001.
isi event channels create mychannel smtp --address my_email@xxx.com --smtp_host smtp.xxx.com
isi event type list --format json | python -c 'import json;import sys;print ",".join([eg["id"] for eg in json.loads(sys.stdin.read())])' | sed 's/,400160001//' > a.txt
isi event alert create myalert NEW mychannel --eventgroup `cat a.txt`
- To verify the configuration, send the test alert by leveraging the following script. The expected outcome is that the SMTP alert for event group type 40005002 is sent to the subscriber.
/usr/bin/isi_celog/celog_send_events.py -o 400160001
/usr/bin/isi_celog/celog_send_events.py -o 400050002
Starting in OneFS 9.4.0.0, you can use PAPI to achieve the same purpose. Send event IDs that you want to exclude in an HTTP PUT request to /platform/15/event/alert-conditions/<alert rule name>
The following is an example data body:
{"exclude_eventgroup_ids": ["100010001", "100010002"]}
The following figure shows an example to exclude the event ID 100010001 and 100010002 from the alert – DemoAlertRule:
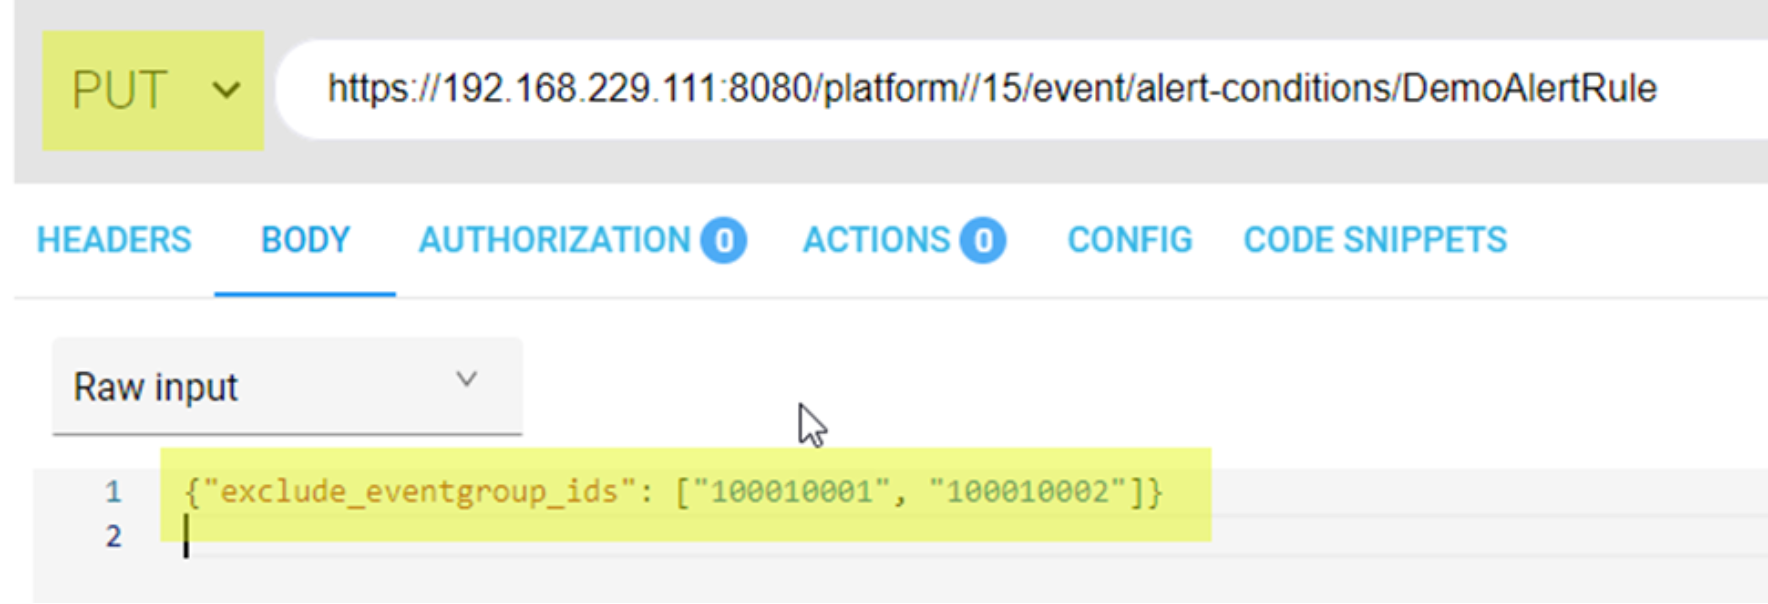
Figure 3. An example to exclude the events from an alert
Stop receiving alert notification for heartbeat events
In OneFS 8.0 and later versions, PowerScale cluster will generate a number of heartbeat events every day. Heartbeat alerts are intended to tell you when a node is unable to send alerts. Normally these events are only for informational purposes. The total number of heartbeat alert notifications is equal to the total number of nodes in the PowerScale cluster. For example, if you have configured SMTP alerts in a 60-node PowerScale cluster; you will get 60 email alert notifications for heart beat events every day. The event group ID for heart beat events is 400050004. So you can either add event group ID 400050004 to the deny list or you can set a non-informational severity for this event as discussed in the section Alert severity configuration. The following examples will demonstrate both ways.
Use the following CLI commands to exclude the heart beat event group (400050004) in the SMTP alert configuration. (OneFS 8.0.0.5 and later)
isi event channels create mychannel smtp --address my_email@xxx.com --smtp_host smtp.xxx.com
isi event type list --format json | python -c 'import json;import sys;print ",".join([eg["id"] for eg in json.loads(sys.stdin.read())])' | sed 's/,400050004//' > a.txt
isi event alert create myalert NEW mychannel --eventgroup `cat a.txt`
Use the following CLI command to set the severity level for heart beat event group (400050004) to emergency, critical, and warning.
isi event alerts create demo_alerts --eventgroup "400050004" --severity "emergency,critical,warning" NEW mychannel
Causes long or causes short
Starting from OneFS 8.0, the related events are organized into event groups. In this case, the CLI command isi event is an abbreviation for isi event group. To view a list of groups of correlated event occurrences, we can use either isi event list or isi event groups list to achieve this. This command will list a short description (causes short) for each event group as shown in Figure 4.

Figure 4. Causes short
If more details are preferred, we recommend you use the CLI command isi event list -v or isi event group list -v to view the long description (Causes Long). Here is another example:
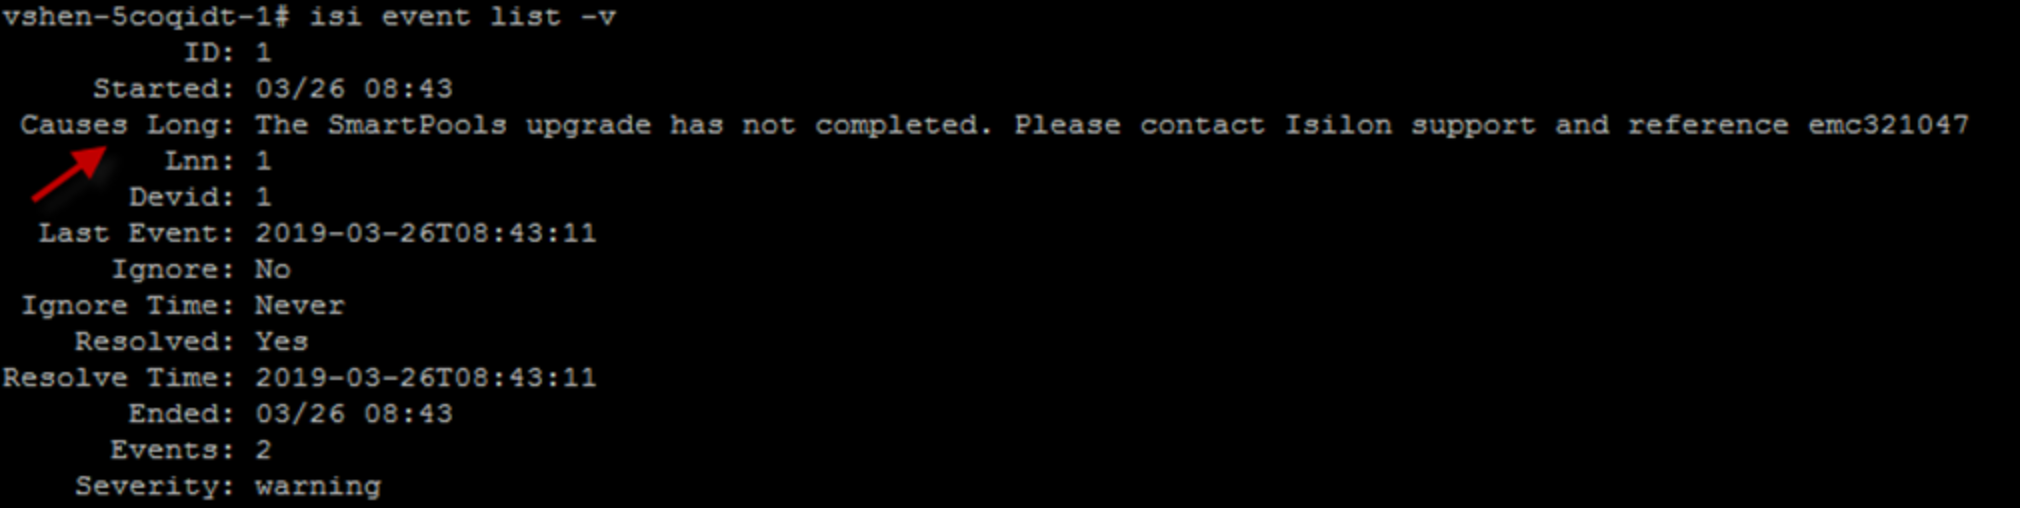
Figure 5. Causes long
Configurable event threshold
This feature is introduced in OneFS 9.1.0.0 and allows users to customize event thresholds to a level listed below other than the defaults.
- Info
- Warn
- Crit.
- Emerg.
In OneFS 9.1.0.0, seven events are configurable with their thresholds. For the configurable events and their default threshold values, see Table 3:
Table 3. Configurable event thresholds and their default values
|
ID |
Name |
Description |
Info |
Warn |
Crit. |
Emerg. |
|
100010001 |
SYS_DISK_VARFULL |
Percentage at which /var partition is near capacity |
75% |
85% |
90% |
NA |
|
100010002 |
SYS_DISK_VARCRASHFULL |
Percentage at which /var/crash partition is near capacity |
NA |
90% |
NA |
NA |
|
100010003 |
SYS_DISK_ROOTFULL |
Percentage at which /(root) partition is near capacity |
NA |
90% |
95% |
NA |
|
100010015 |
SYS_DISK_POOLFULL |
Percentage at which a nodepool is near capacity |
75% |
80% |
90% |
97% |
|
100010018 |
SYS_DISK_SSDFULL |
Percentage at which an SSD drive is near capacity |
75% |
85% |
90% |
NA |
|
600010005 |
SNAP_RESERVE_FULL |
Percentage at which snapshot reserve space is near capacity |
NA |
90% |
99% |
NA |
|
800010006 |
FILESYS_FDUSAGE |
Percentage at which the system is near capacity for open file descriptors |
85% |
90% |
95% |
NA |
To configure the event thresholds, use WebUI or CLI as the following:
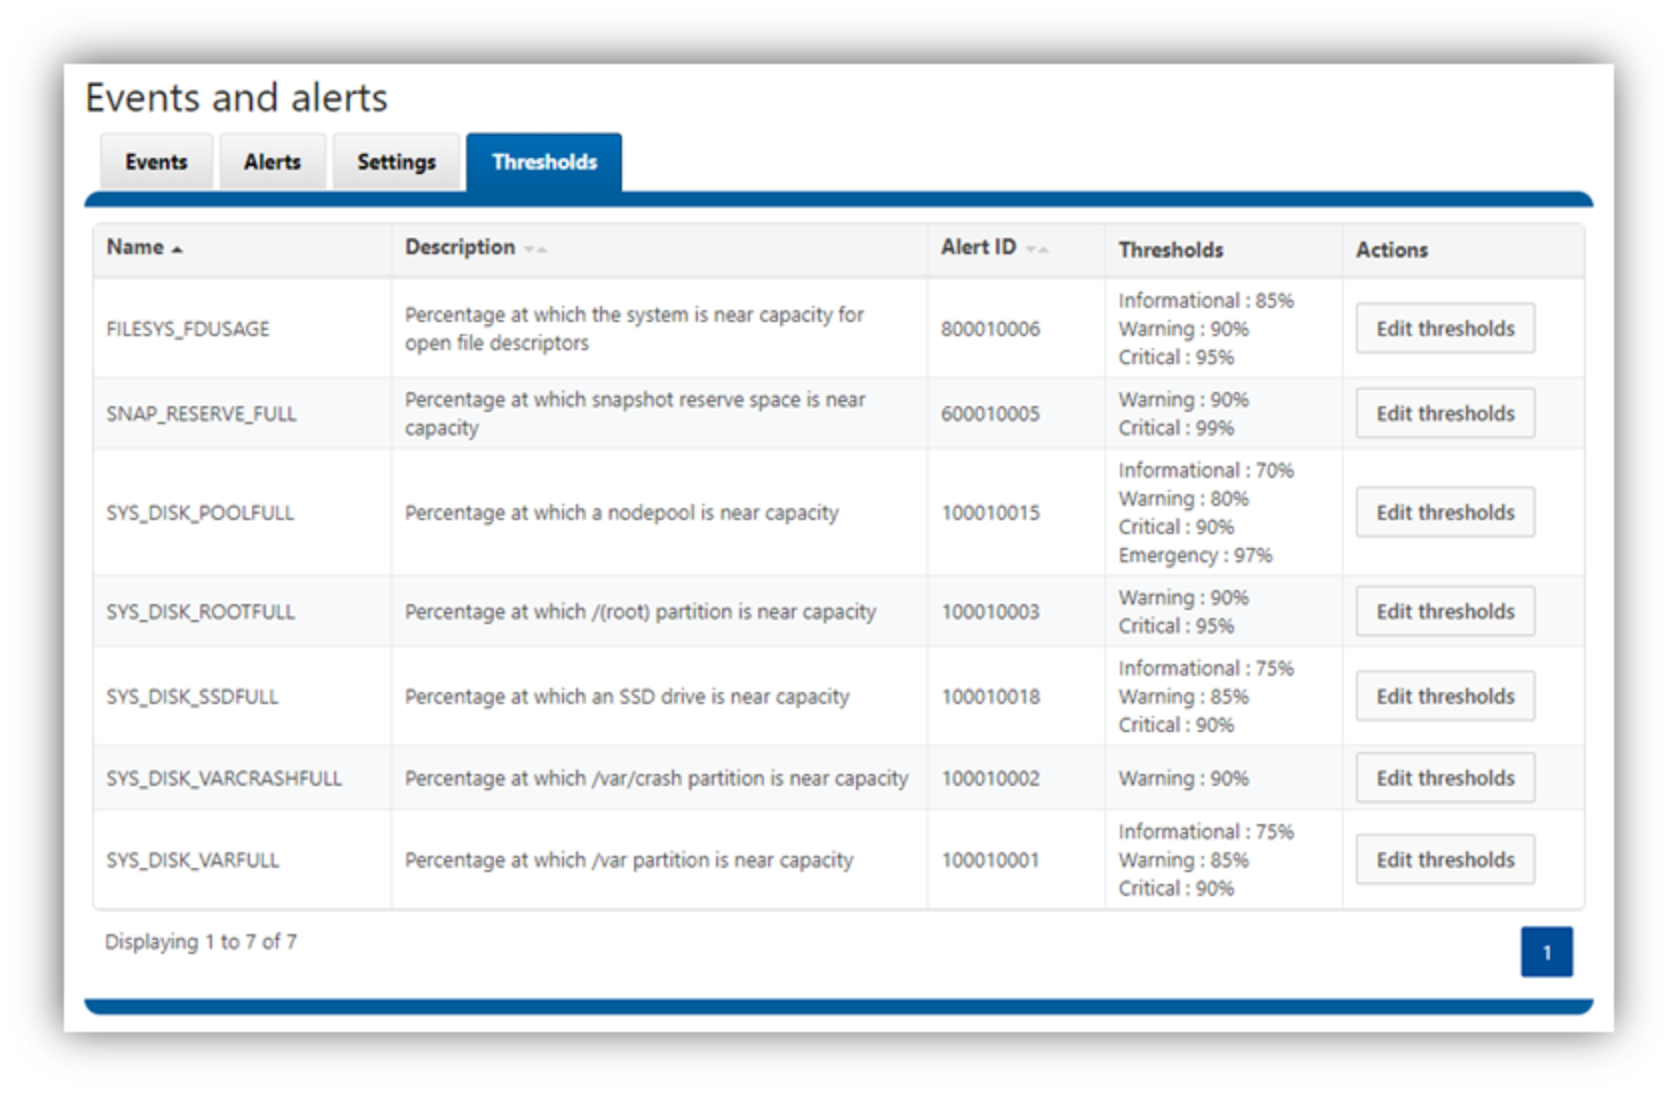
Figure 6. WebUI to configure the event thresholds
The following are examples of how to use CLI to list, view, modify, and reset the event thresholds:
vshen-llh7eh7-1# isi event thresholds view 100010001
ID: 100010001
ID Name: SYS_DISK_VARFULL
Description: Percentage at which /var partition is near capacity
Defaults: info (75%), warn (85%), crit (90%)
Thresholds: info (75%), warn (85%), crit (90%)
vshen-llh7eh7-1# isi event thresholds modify 100010001 --info 50 --crit 95
vshen-llh7eh7-1# isi event thresholds view 100010001
ID: 100010001
ID Name: SYS_DISK_VARFULL
Description: Percentage at which /var partition is near capacity
Defaults: info (75%), warn (85%), crit (90%)
Thresholds: info (50%), warn (85%), crit (95%)
vshen-llh7eh7-1# isi event thresholds reset 100010001
Are you sure you want to reset info, warn, crit from event 100010001?? (yes/[no]): yes
vshen-llh7eh7-1# isi event thresholds view 100010001
ID: 100010001
ID Name: SYS_DISK_VARFULL
Description: Percentage at which /var partition is near capacity
Defaults: info (75%), warn (85%), crit (90%)
Thresholds: info (75%), warn (85%), crit (90%)
New WebUI for CELOG
In OneFS 9.2.0.0, the user interface (UI) for CELOG has been re-designed to make sure everything is in good order and easy to use. You can easily:
- Show events for
- Today
- This week
- This month
- Custom range/
- All
- Categorize all the events by their status like
- Active
- Ignored
- Resolved
- All
- Filter the event by the severity like
- Emergency
- Critical
- Warning
- Information
- Search for a specific event in the event history
- Resolve a bulk of events
- Ignore a bulk of events
Figure 7 shows a screenshot of the new WebUI for Event group history. You can get to this new UI by clicking Event and alerts under Cluster management in OneFS WebUI. Please click around and let us know if you have any comments or suggestions about it.
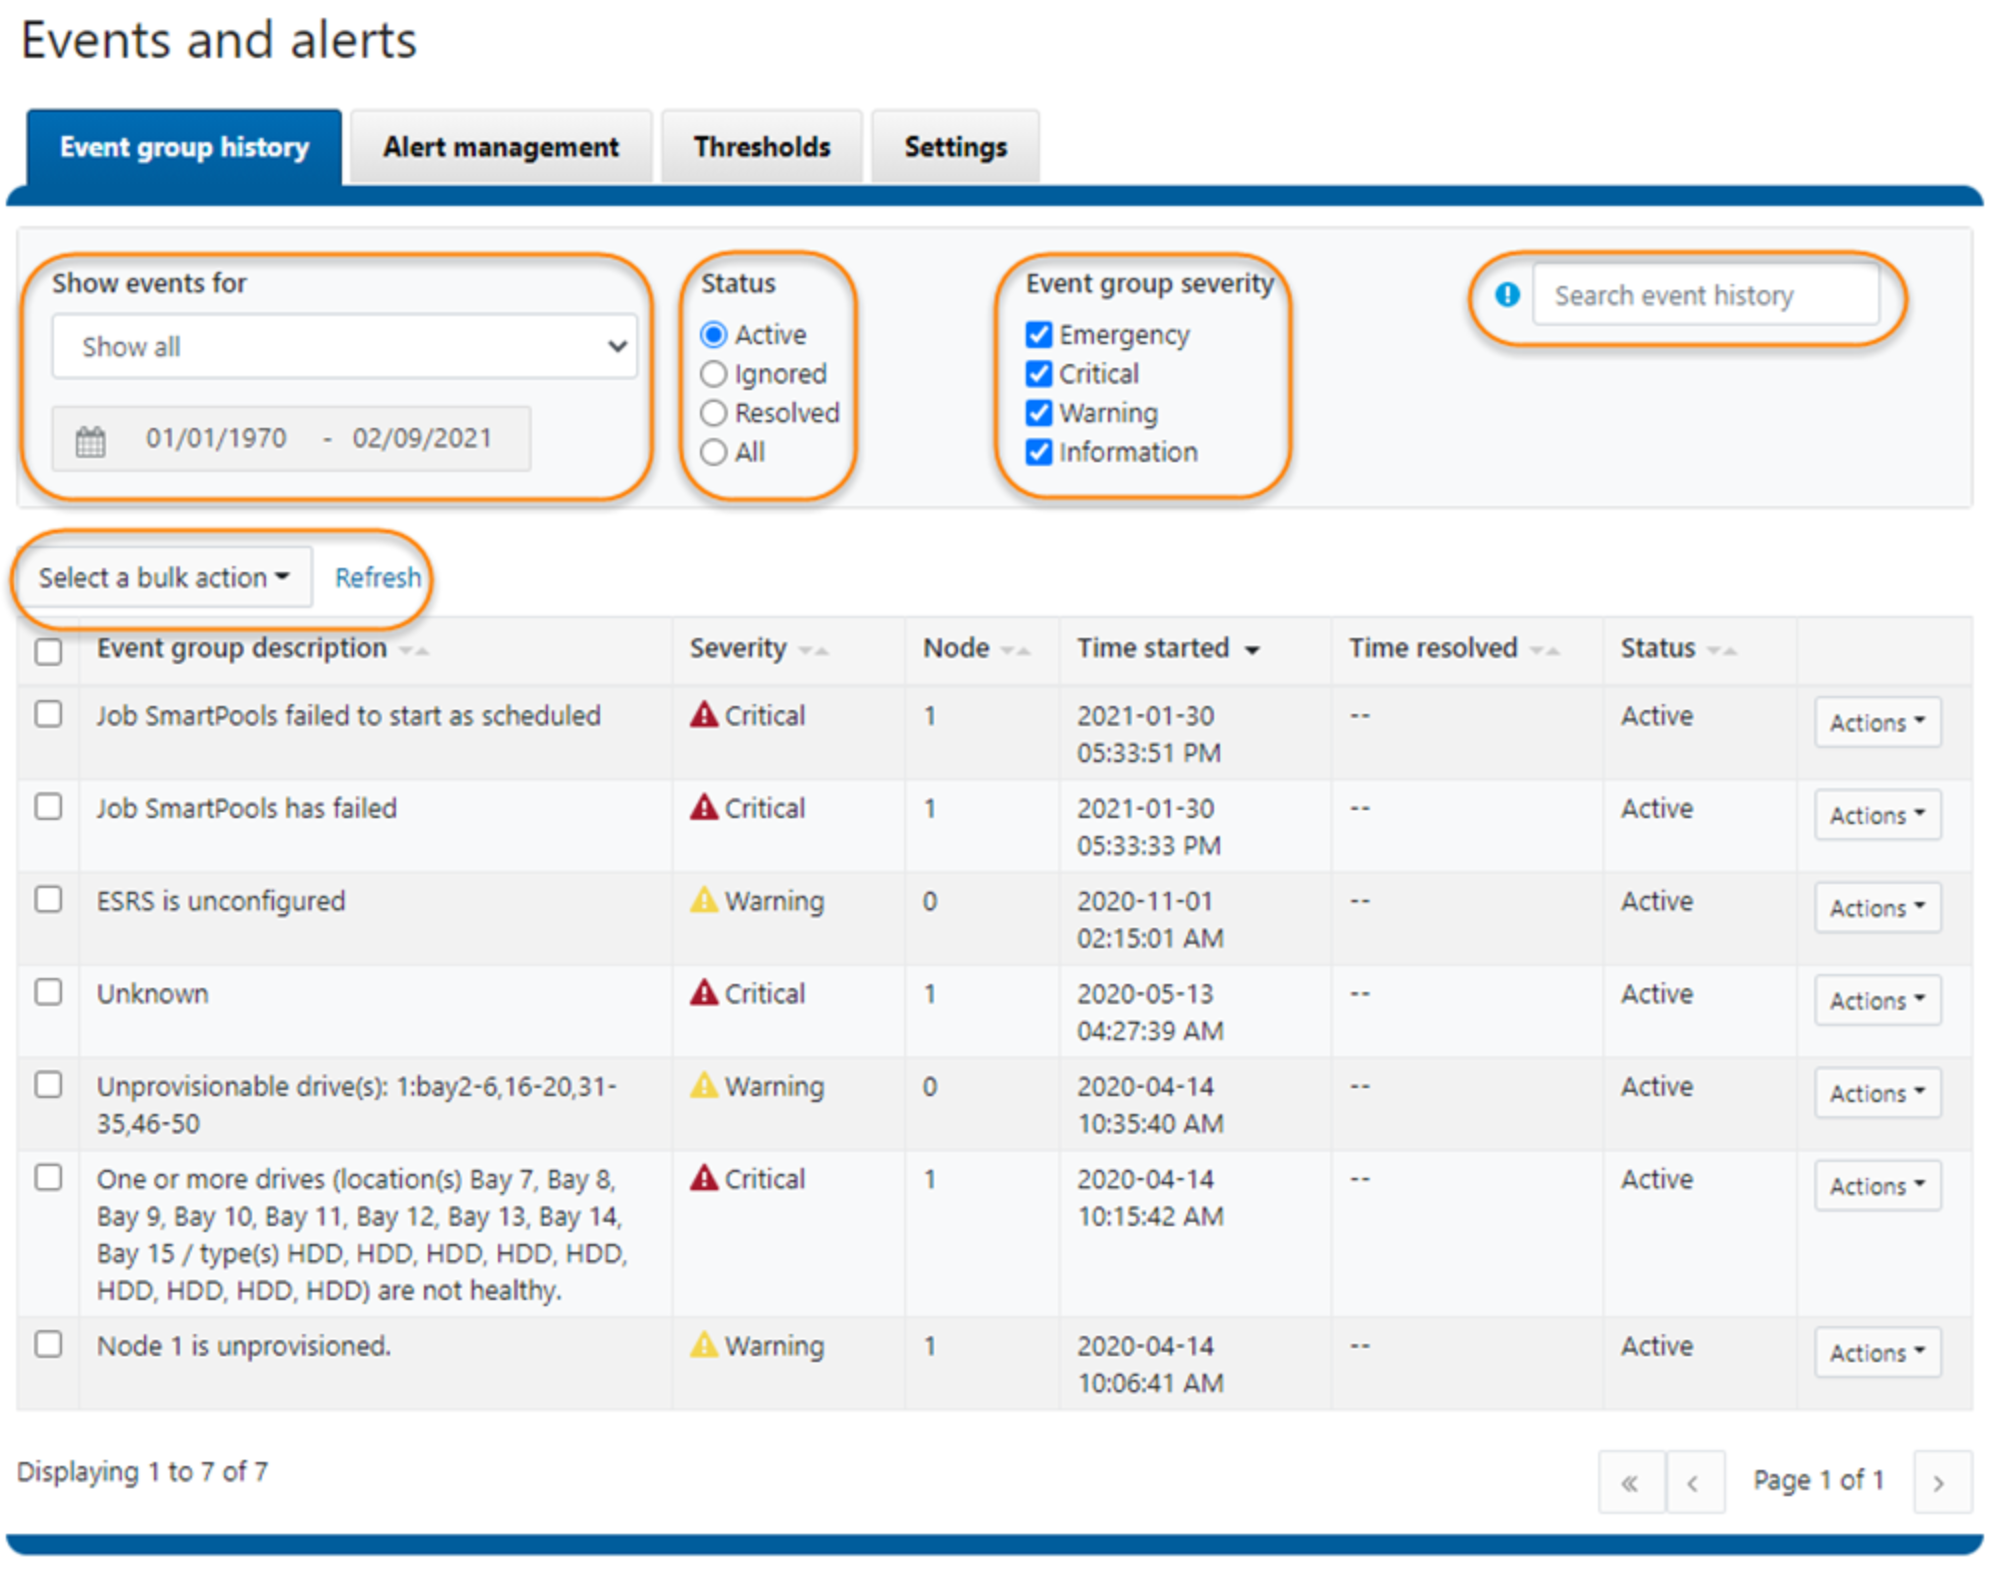
Figure 7. New WebUI for Event group history
CELOG maintenance mode
In OneFS 9.2.0.0, you can manually enable and disable CELOG maintenance mode. During a CELOG maintenance window, the system will continue to log events, but no alerts will be generated. You will have the opportunity to review all events that took place during the maintenance window when disabling maintenance mode. Active event groups will automatically resume generating alerts when the scheduled maintenance period ends.
The following steps will lead you to go through this feature:
- To enable CELOG maintenance mode, in OneFS WebUI, click Event and alerts under Cluster management. Click the Alert management tab, and click Enable CELOG maintenance mode. In the prompt window, click Enable CELOG maintenance mode shown in Figure 8:
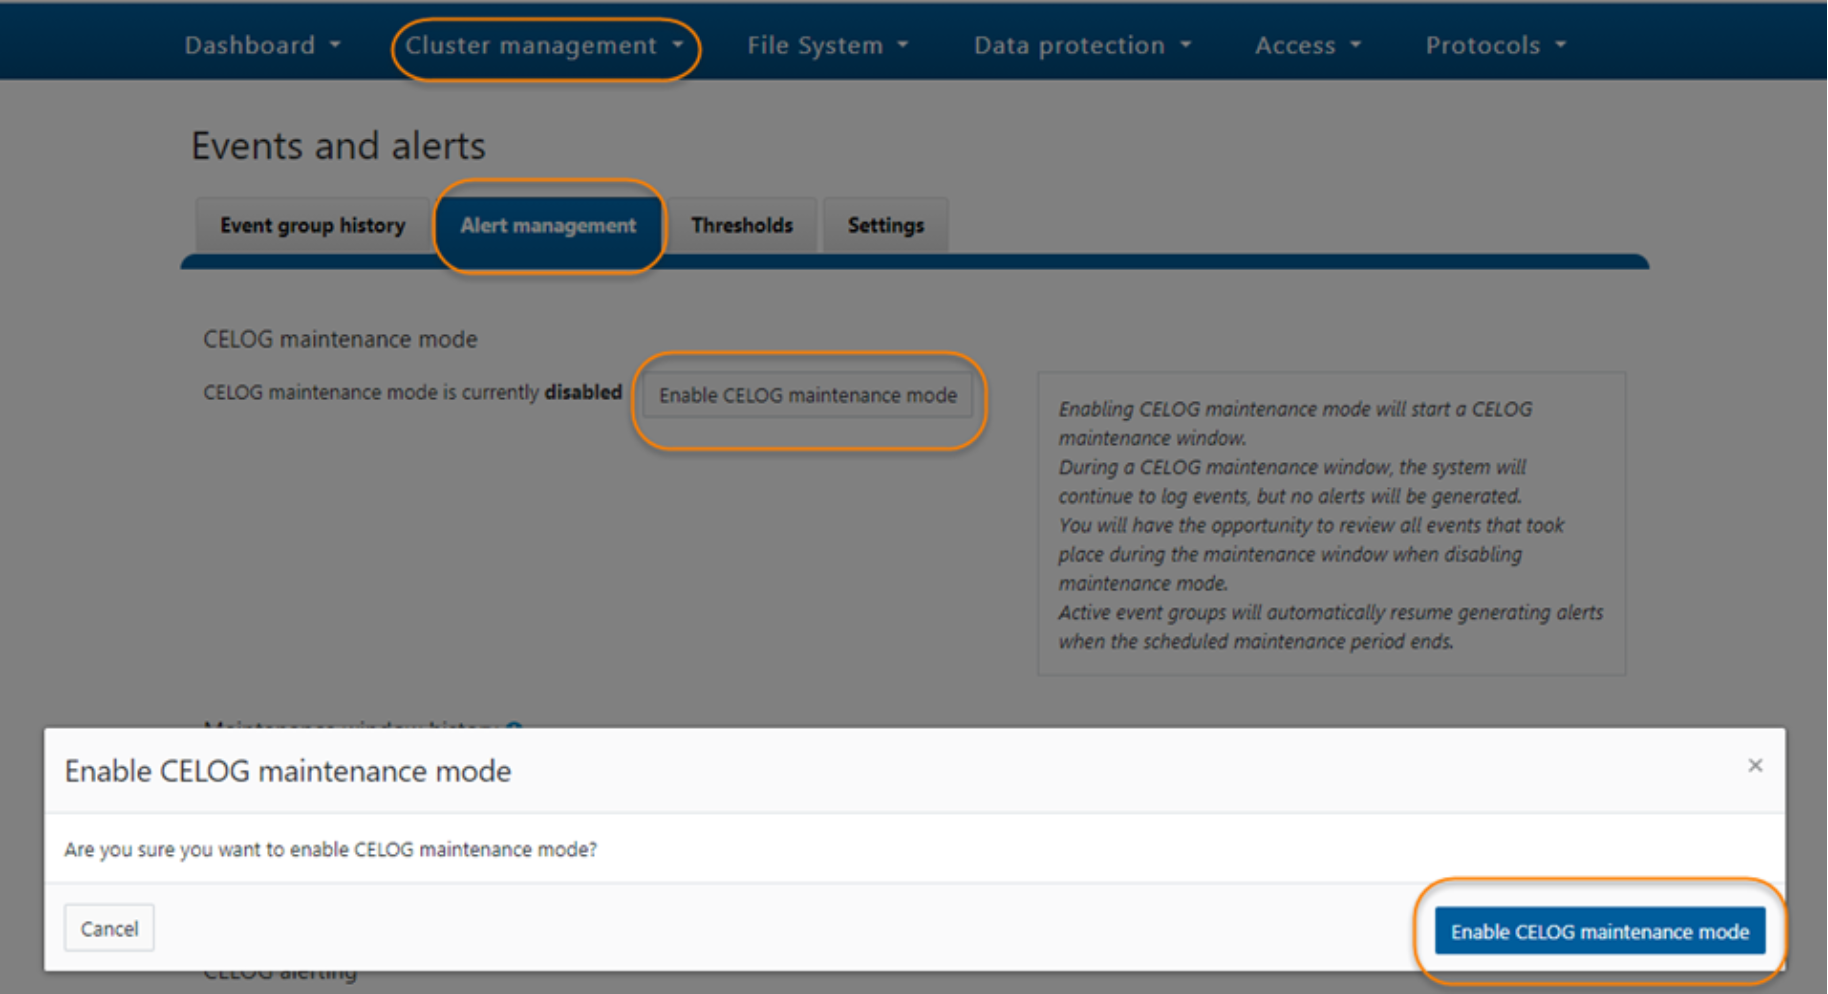
Figure 8. Enable CELOG maintenance mode
- Create an Alert channel for testing. This operation depends on your specific environment, for example, you can either choose SMTP or SNMP channel as what you have pre-configured in your environment. In this example, I create an SMTP channel in the lab. To create a channel, click Create channel under Alert channel in the CELOG alerting section as shown in Figure 9.
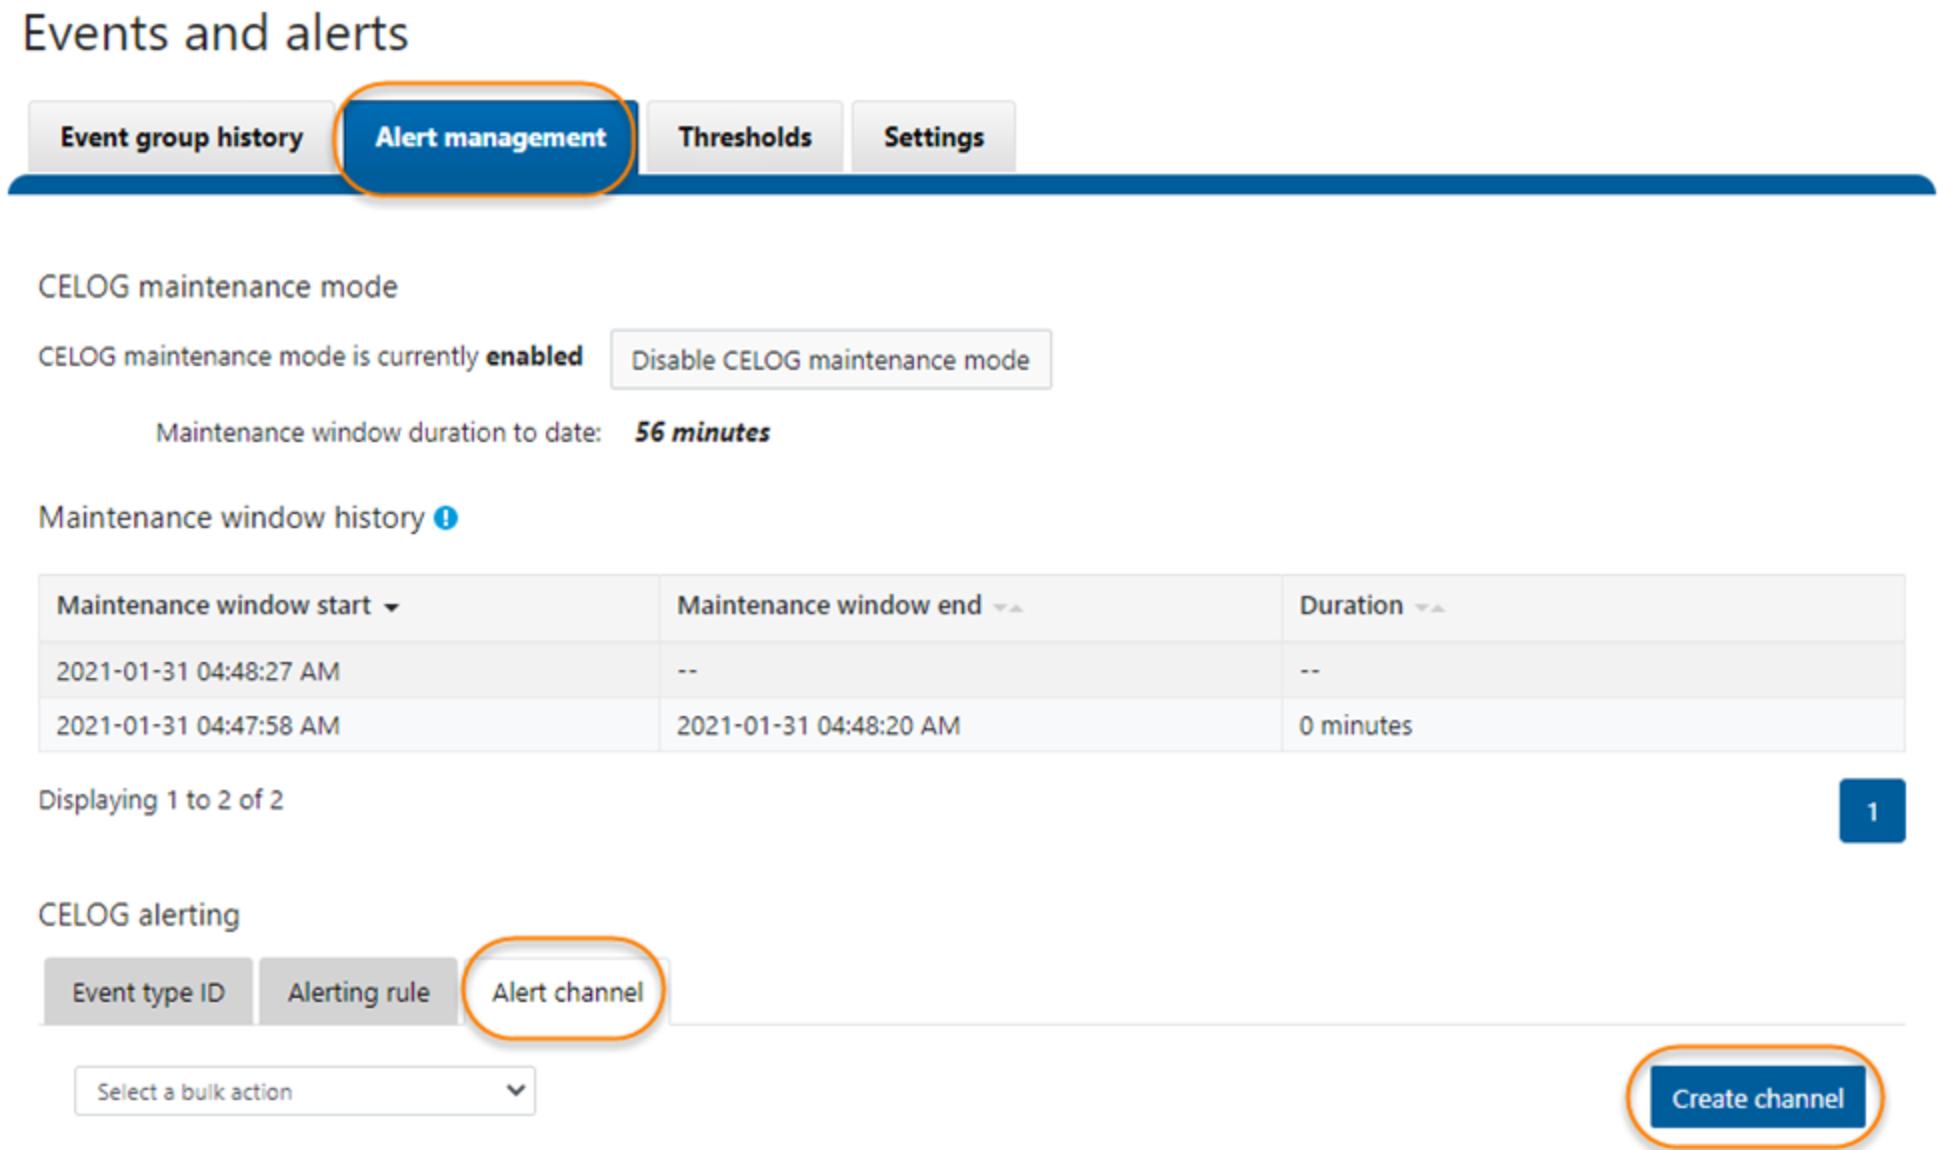
Figure 9. Create channel
- To create an alert rule, click the tab Alerting rule and then click the button Create alert rule
- In the prompt window, fill the Rule name, set the Rule condition to NEW, apply it to all the Alert categories, and attached it to the channel you have just created.
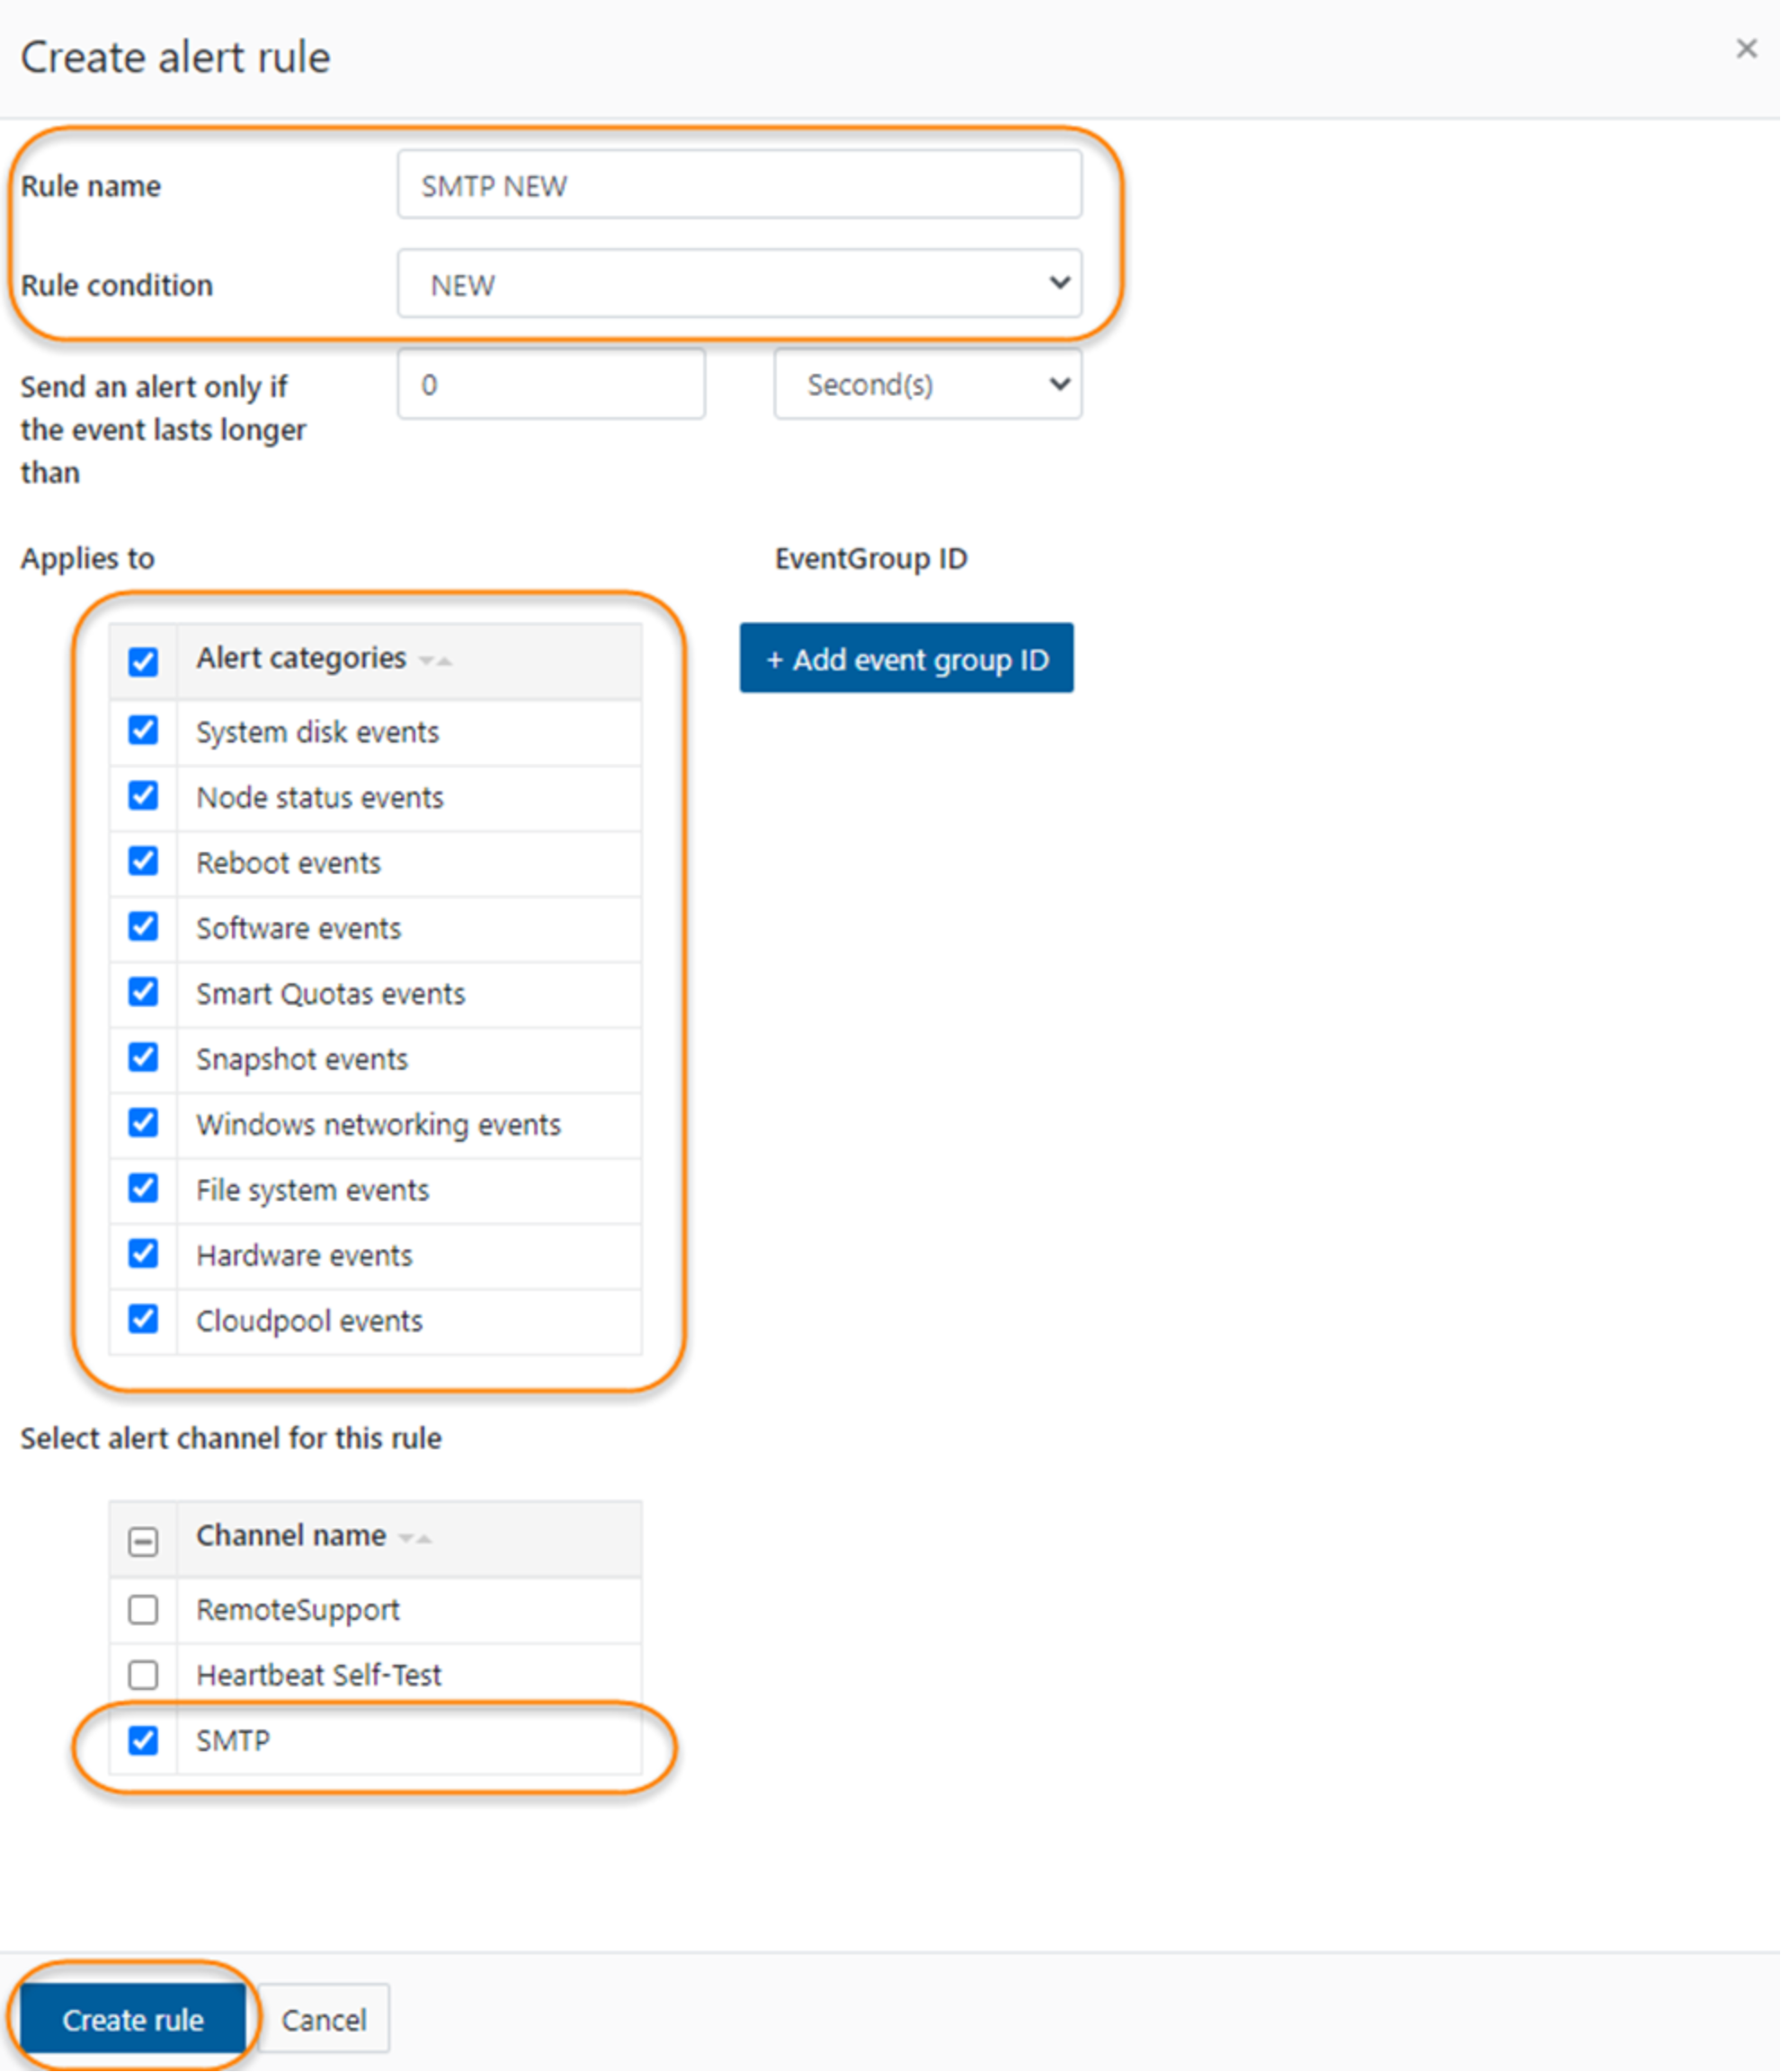
Figure 10. Rule configuration
- Open an SSH connection to any node in the cluster and log in using the root account. Use the following command to create several events:
# /usr/bin/isi_celog/celog_send_events.py -o 940100002
The output is like below:
Heap looptimes: [-1]
running -1 [940100002]
1612871342 :: Sending eventids [940100002] with specifier None
940100002 message is OneFS {version} is currently running on unsupported nodes (devid(s) {devids}). {msg}.
1.195 (70368744177859) corresponds to eventid 940100002
Out of events to run. Exiting.
# /usr/bin/isi_celog/celog_send_events.py -o 940100001
The output is like below:
Heap looptimes: [-1]
running -1 [940100001]
1612872343 :: Sending eventids [940100001] with specifier None
940100001 message is OneFS {version} is currently running and is not supported on this hardware: {msg}.
1.196 (70368744177860) corresponds to eventid 940100001
Out of events to run. Exiting.
- During maintenance mode, OneFS will still show the event but there will be no alert. In this example, there is no SMTP alert email triggered. In the Event group history, this event is shown in Figure 11.
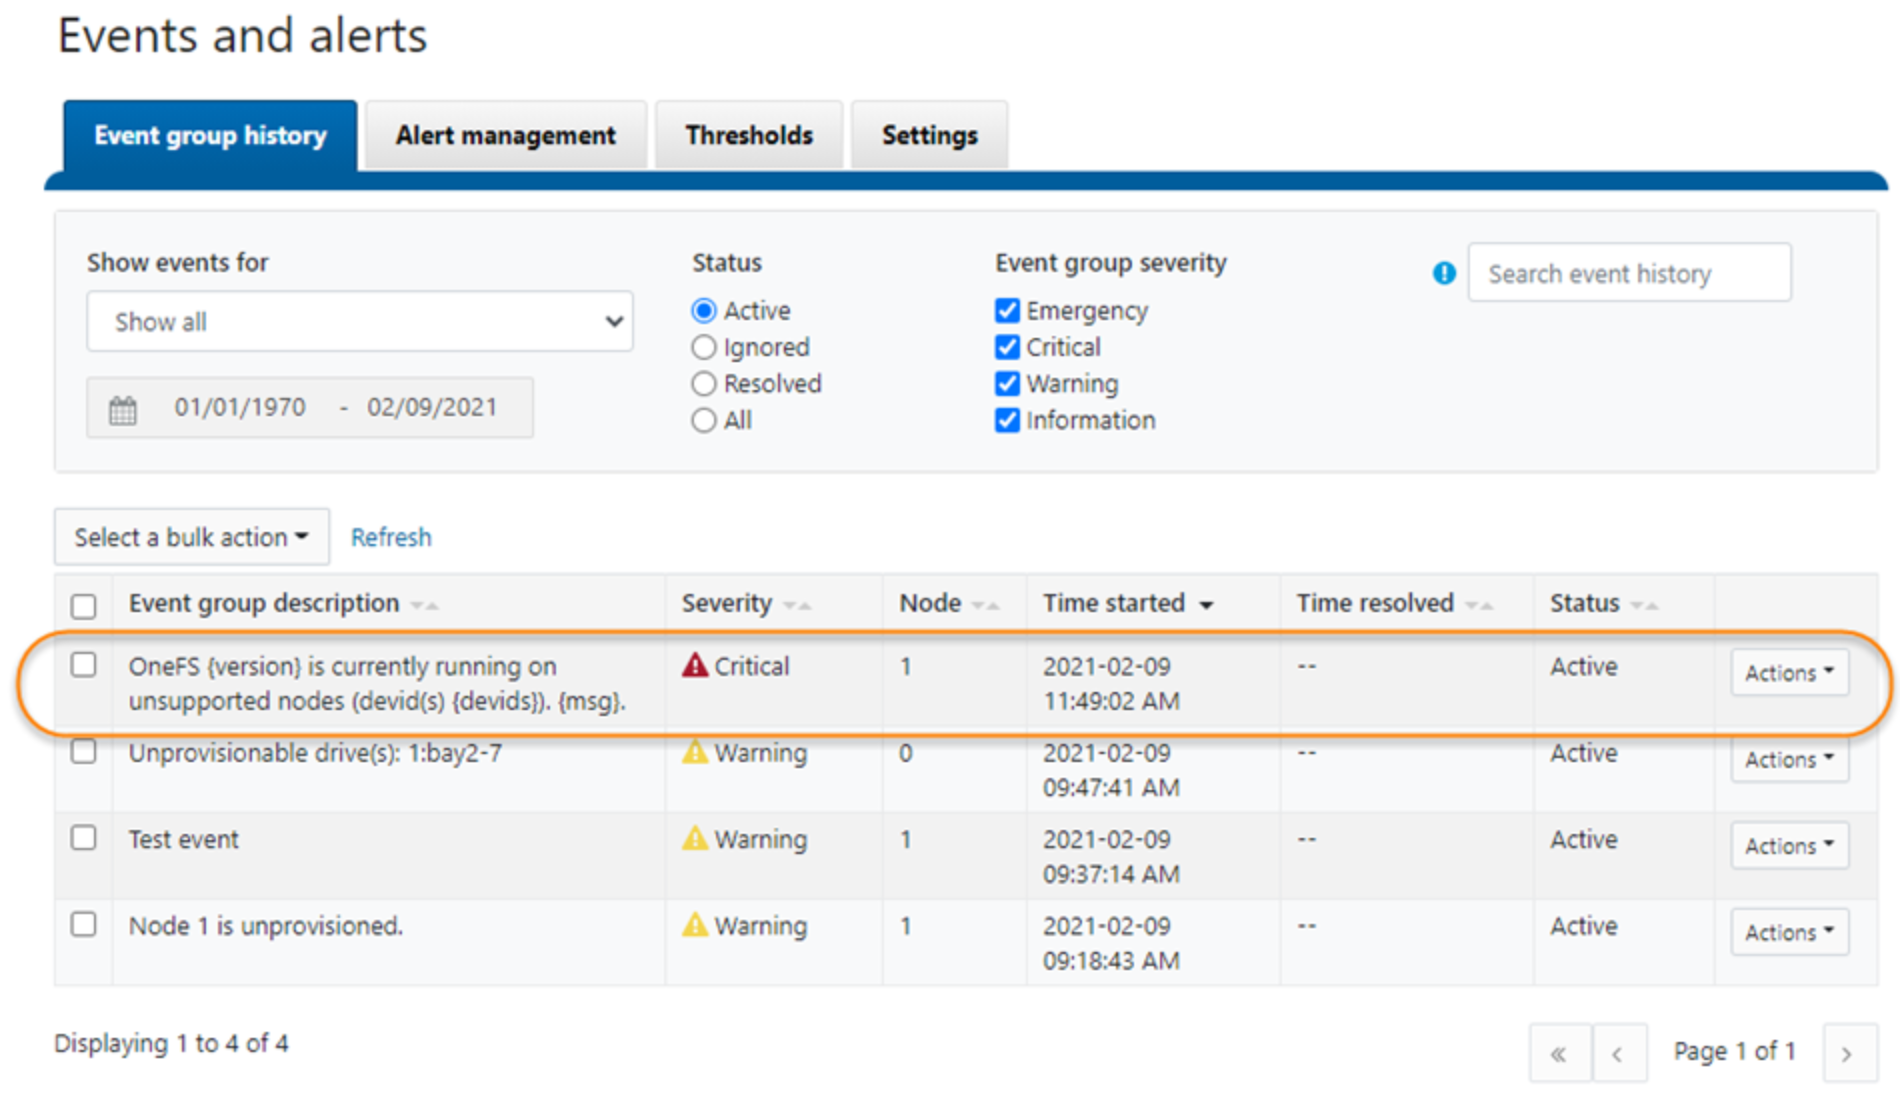
Figure 11. Event in history
You can also use the following command to filter all the events which happened during the CELOG maintenance mode:
# isi event groups list --maintenance-mode=true
The output is like the following:
ID Started Ended Causes Short Lnn Events Severity
------------------------------------------------------------------------------------------
16 02/09 11:49 -- HW_CLUSTER_ONEFS_VERSION_NOT_SUPPORTED 1 1 critical
17 02/09 12:05 02/09 12:19 HW_ONEFS_VERSION_NOT_SUPPORTED 1 1 critical
------------------------------------------------------------------------------------------
- Click the button Disable CELOG maintenance mode. In the following prompt window, it will list all the events during the CELOG maintenance mode and you can:
- View event details
- Ignore event
- Resolve event
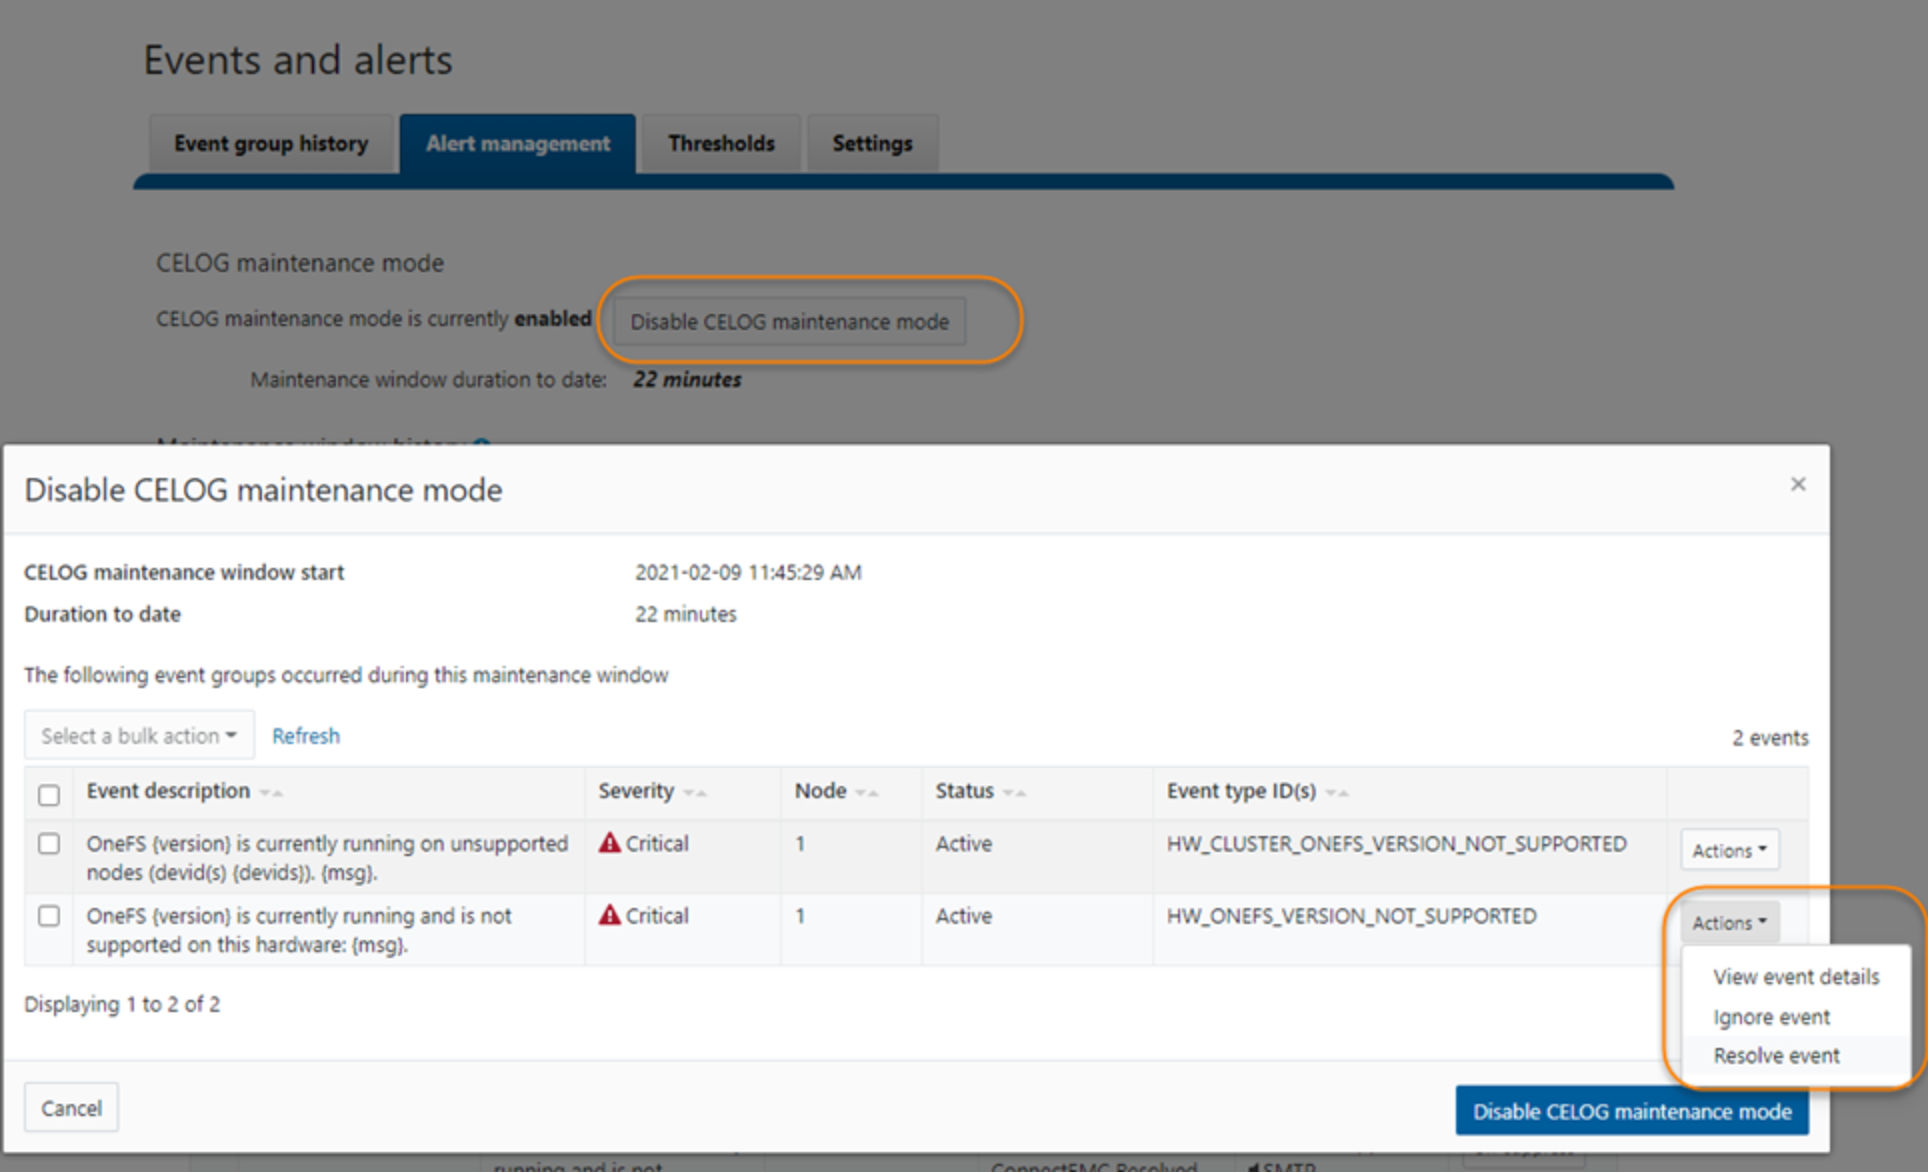
Figure 12. Disable CELOG maintenance mode
In this example, the event HW_ONEFS_VERSION_NOT_SUPPORTED is marked resolved by clicking Action and Resolve event.
After the CELOG maintenance mode is disabled, you will get the email notification only for HW_CLUSTER_ONEFS_VERSION_NOT_SUPPORTED. The event which has been marked resolved will not trigger any notification.
Suppress Event Notification
When an event type is suppressed, it prevents an event from alerting on all configured CELOG channels. But the event will still show in the event group history.
The following steps will lead you to go through this feature:
- To suppress an event type, click the button Suppress for a specific event under the Event type ID tab as shown in Figure 13. In this example, both 930100006 and 930100005 have been suppressed.
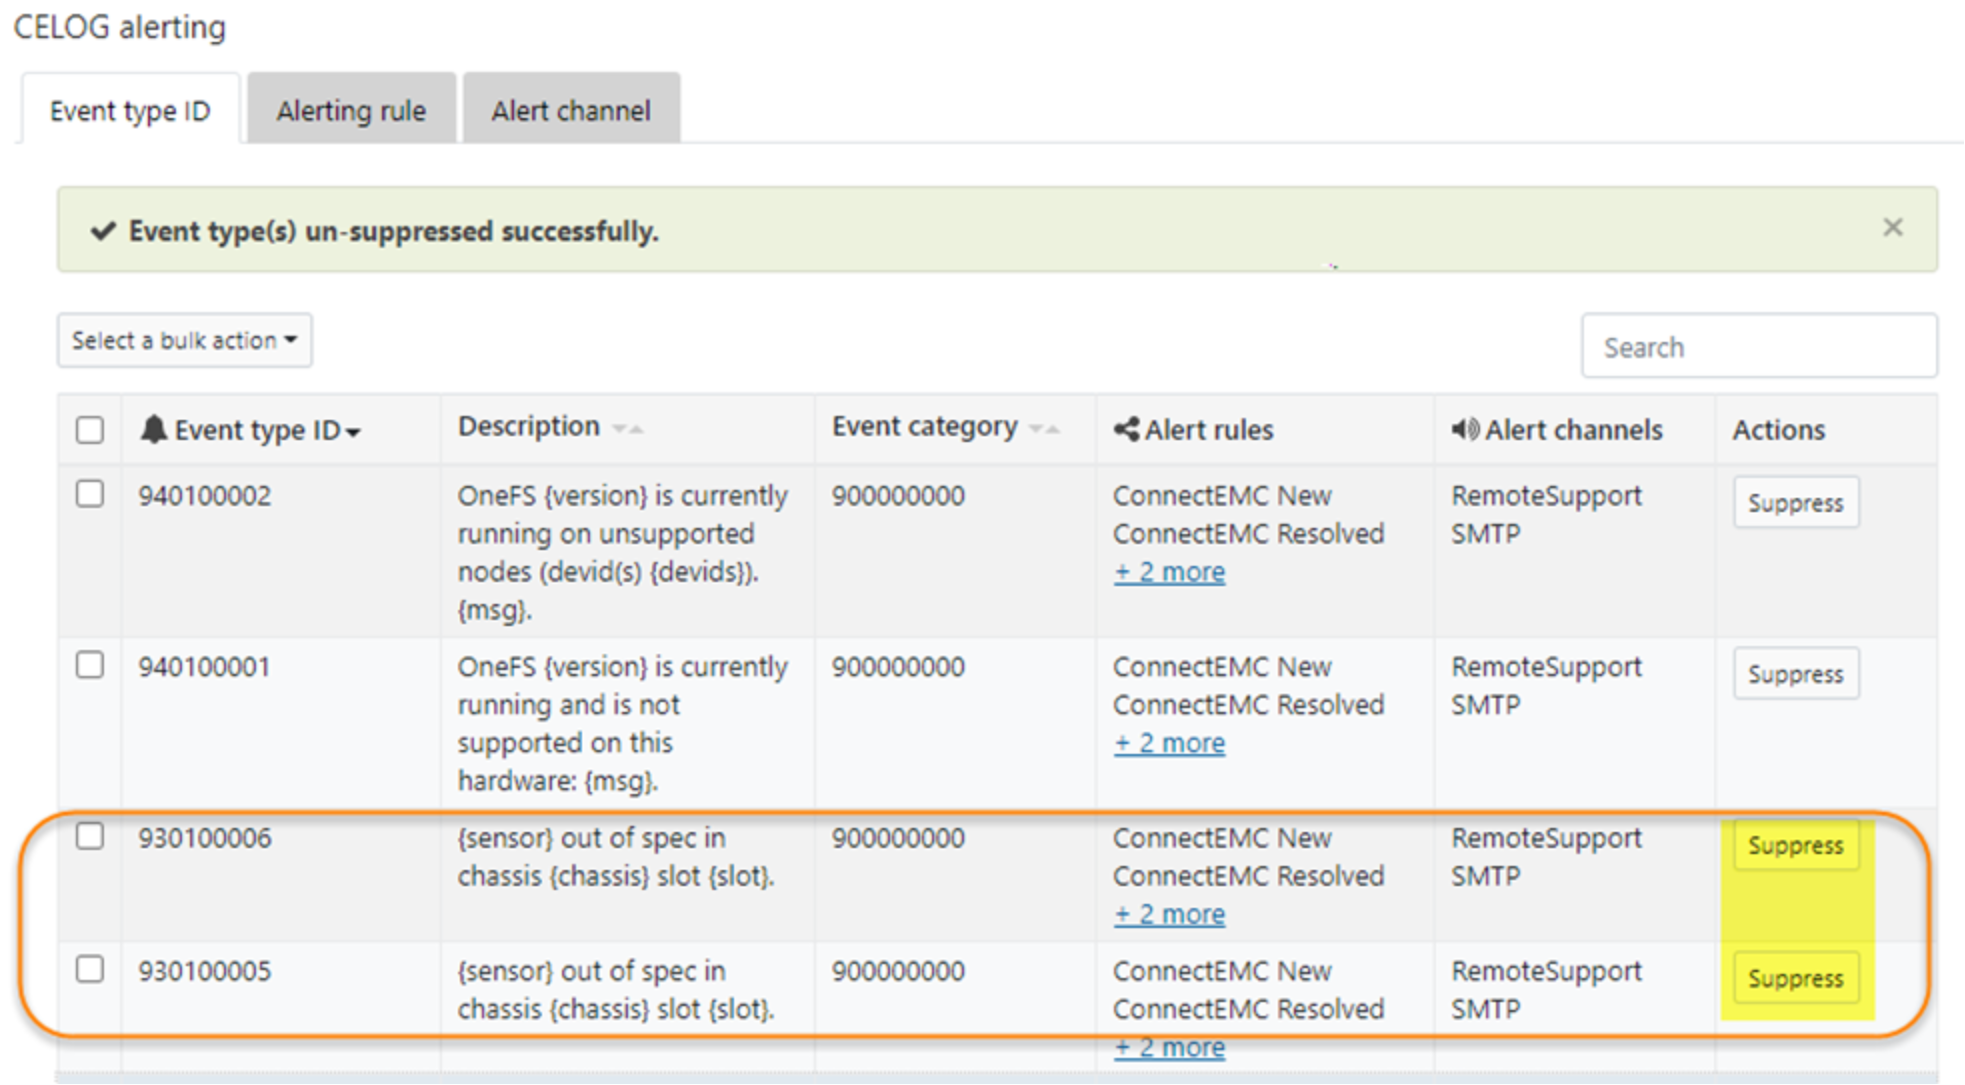
Figure 13. Suppress events
- Open an SSH connection to any node in the cluster and log in using the root account. Use the following command to create several events:
# /usr/bin/isi_celog/celog_send_events.py -o 930100006
The output is:
Heap looptimes: [-1]
running -1 [930100006]
1612873812 :: Sending eventids [930100006] with specifier None
930100006 message is {sensor} out of spec in chassis {chassis} slot {slot}.
1.200 (70368744177864) corresponds to eventid 930100006
Out of events to run. Exiting.
# /usr/bin/isi_celog/celog_send_events.py -o 930100005
The output is:
Heap looptimes: [-1]
running -1 [930100005]
1612873817 :: Sending eventids [930100005] with specifier None
930100005 message is {sensor} out of spec in chassis {chassis} slot {slot}.
1.201 (70368744177865) corresponds to eventid 930100005
Out of events to run. Exiting.
- To list all the events in the suppressed list, use the following command:
# isi event suppress list
The output is:
ID Name
----------------------------
930100005 HWMON_ANY_DISCRETE
930100006 HWMON_ANY_METERS
----------------------------
- These suppressed events will only show in the event history and will not trigger any notification in any channels.
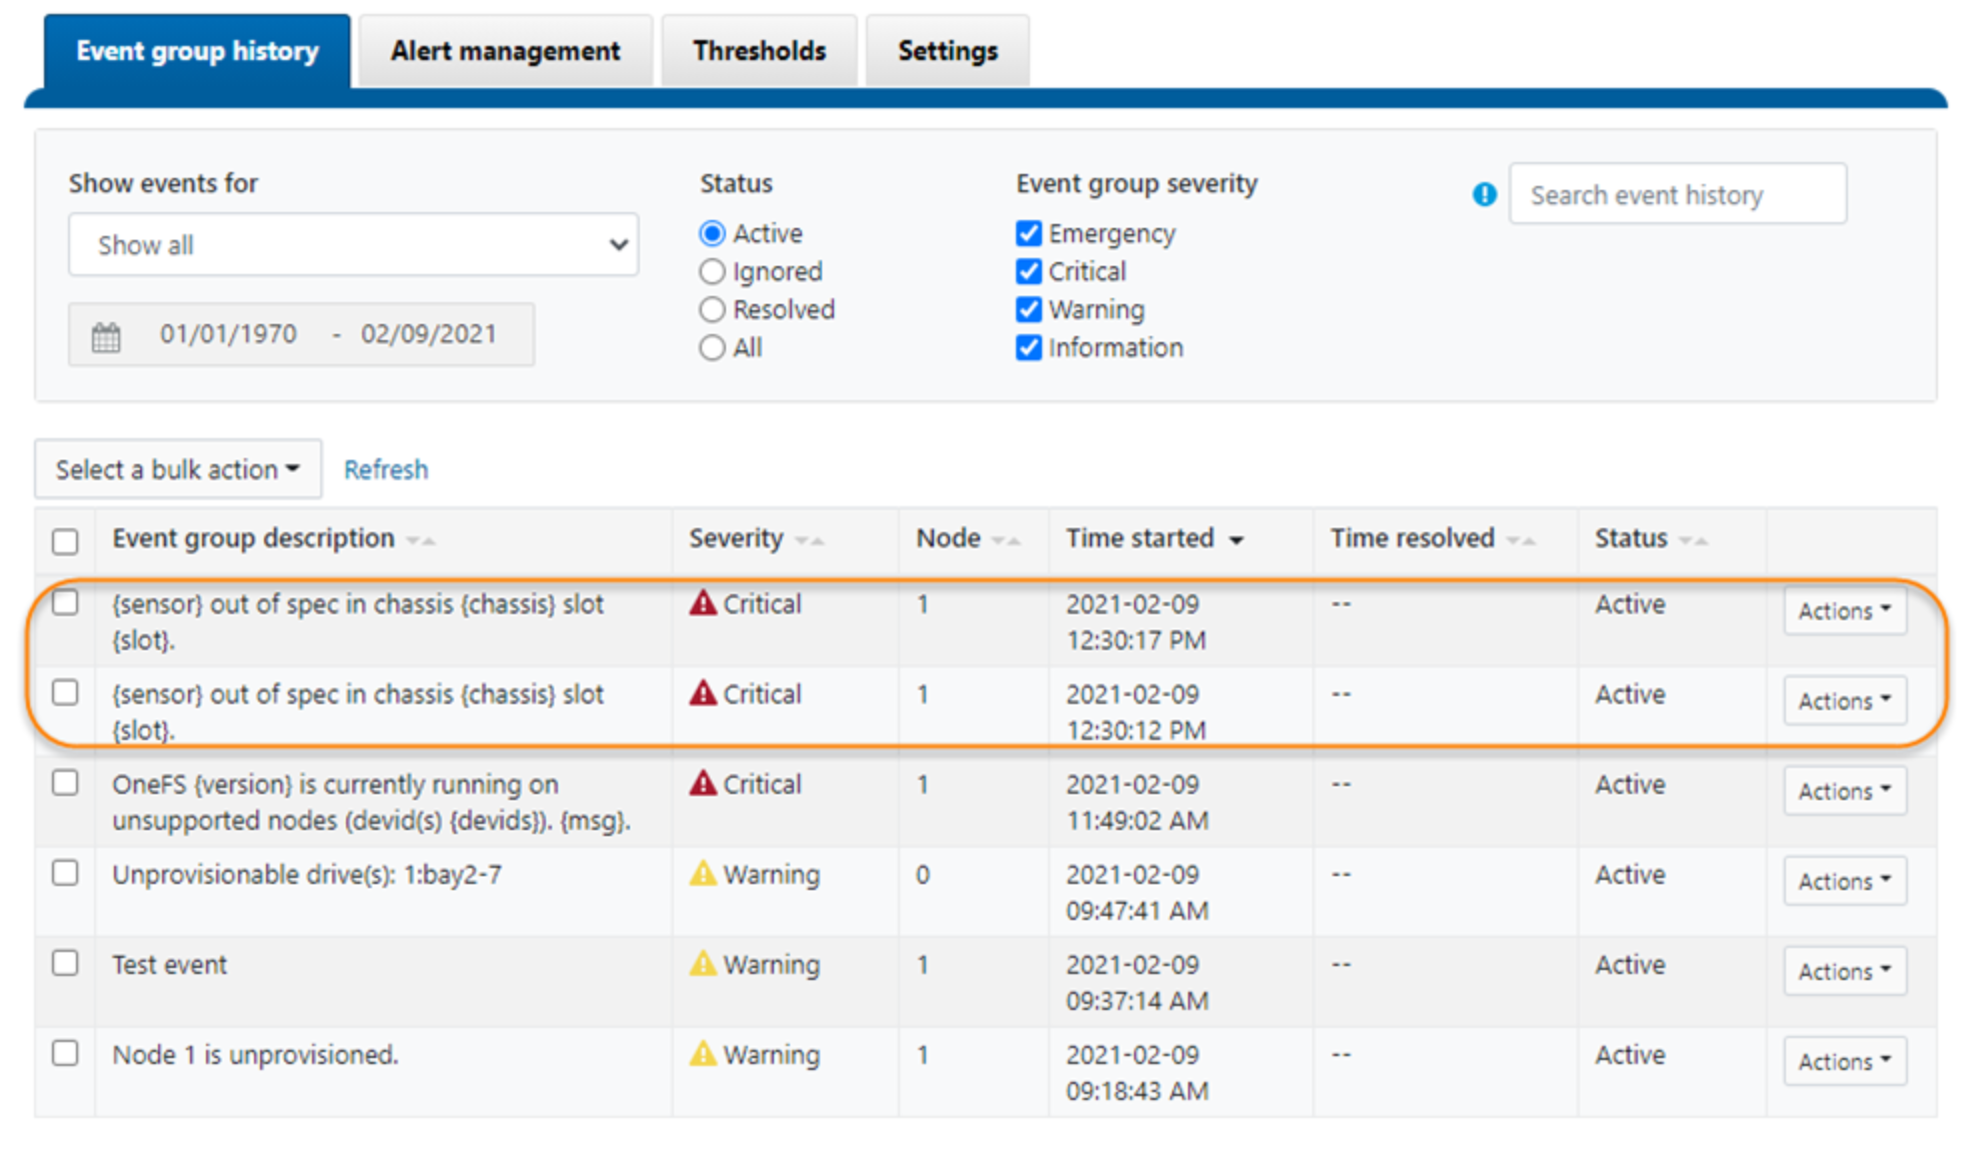
Figure 14. Suppressed events
- Un-suppress the event types by clicking the Un-supress button.
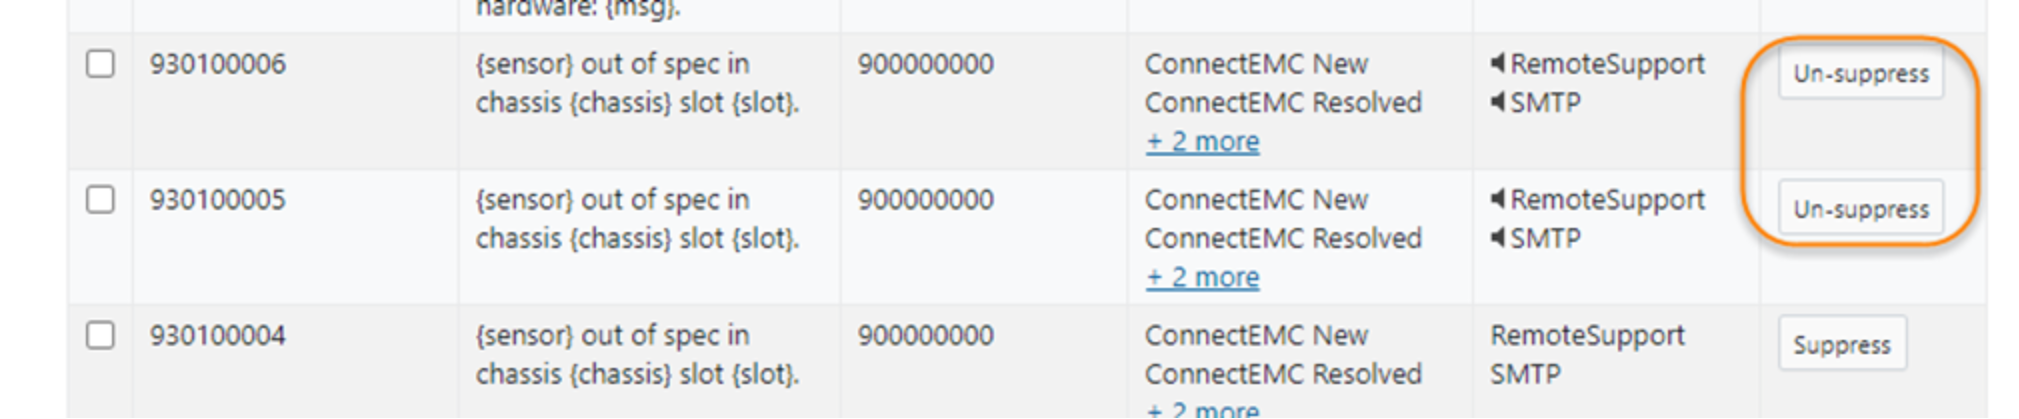
Figure 15. Un-suppress events
Typical alert configuration scenarios
The following sections will demonstrate how to configure alerts based on several typical scenarios, including:
- Alert configurations for SyncIQ
- Alert configurations for disk rebuilds
Alert configurations for SyncIQ
Table 4 lists the key alerts for SyncIQ. Use the following event groups for alert subscription:
Table 4. Event group for SyncIQ
|
Event group ID |
Event group description |
|
synciq |
This event group includes the following event types: 400040002 SyncIQ policy {policy} failure 400040002 SyncIQ policy {policy} failure 400040009 SyncIQ scheduler failed to start policy {policy} 400040010 Error(s) in configuration for SyncIQ policy {policy} 400040011 SyncIQ policy {policy} target version incompatible with source 400040014 SyncIQ failed to contact target cluster for policy {policy} 400040015 SyncIQ failed to take a snapshot for policy {policy} 400040016 SyncIQ policy {policy} detected a modified target file 400040017 SyncIQ filesystem error running policy {policy} 400040018 SyncIQ policy {policy} failed to upgrade 400040019 SyncIQ target association error for policy {policy} |
|
400040012 |
SyncIQ software configuration error |
|
400040020 |
SyncIQ RPO exceeded for policy {policy} |
|
400040021 |
SyncIQ resolved WORM committed file conflicts for policy {policy} |
For detailed information about each event group listed in Table 4, see the OneFS Event Reference.
Use the following command to subscribe to all the SyncIQ related events:
isi event alerts create sync_iq_alert --eventgroup "synciq,400040012,400040020,400040021" NEW mychannel
Alert configurations for disk rebuilds
It is a very common scenario to get notified for each stage during a disk rebuild life cycle: when the disk fails, when the Flex Protect job completes, when the disk is back to a healthy status, and so on.
Table 5 lists the key stages, the corresponding event group id, and the disk state during the disk rebuild life cycle.
Table 5. Event group configuration and disk state during a disk rebuild
|
Event group ID (Status) |
Disk state for the output of “isi devices list” |
|
|
Stage 1: Disk failure and need to be replaced |
100010012 or 100010013 or 100010014 based on the different root cause of the disk failure |
SMARTFAIL |
|
Stage 2: Flex Protect job starts |
NA |
SMARTFAIL |
|
Stage 3: Flex Protect job completes |
100010036 (Resolved) |
REPLACE |
|
Stage 4: Replace the disk |
NA |
NA |
|
Stage 5: Disk format completes |
100010011 (New) |
PREPARING |
|
Stage 6: Disk run prepare job |
NA |
PREPARING |
|
Stage 7: Disk prepare job completes and ready to use |
100010011 (Resolved) |
HEALTHY |
Dell Technologies recommends using the new events as the condition of the alert configuration in order to get all the alert notifications of the entire disk rebuild stage as listed in Table 5. This configuration will ensure that you receive all events notifications including new and resolved for the subscribed event groups.
SMTP alerts
SMTP is the most commonly configured alerting protocol. The following sections will explain how SMTP alerts work in OneFS as well as configuration considerations and best practices.
How SMTP alerts work
Figure 16 shows the high-level architecture of SMTP alerts. As explained in the Alert architecture, OneFS sends an SMTP message when cluster events occur, sending them through configured SMTP channels to the SMTP server configured. The SMTP server will forward the email and attachments to the subscriber email address.
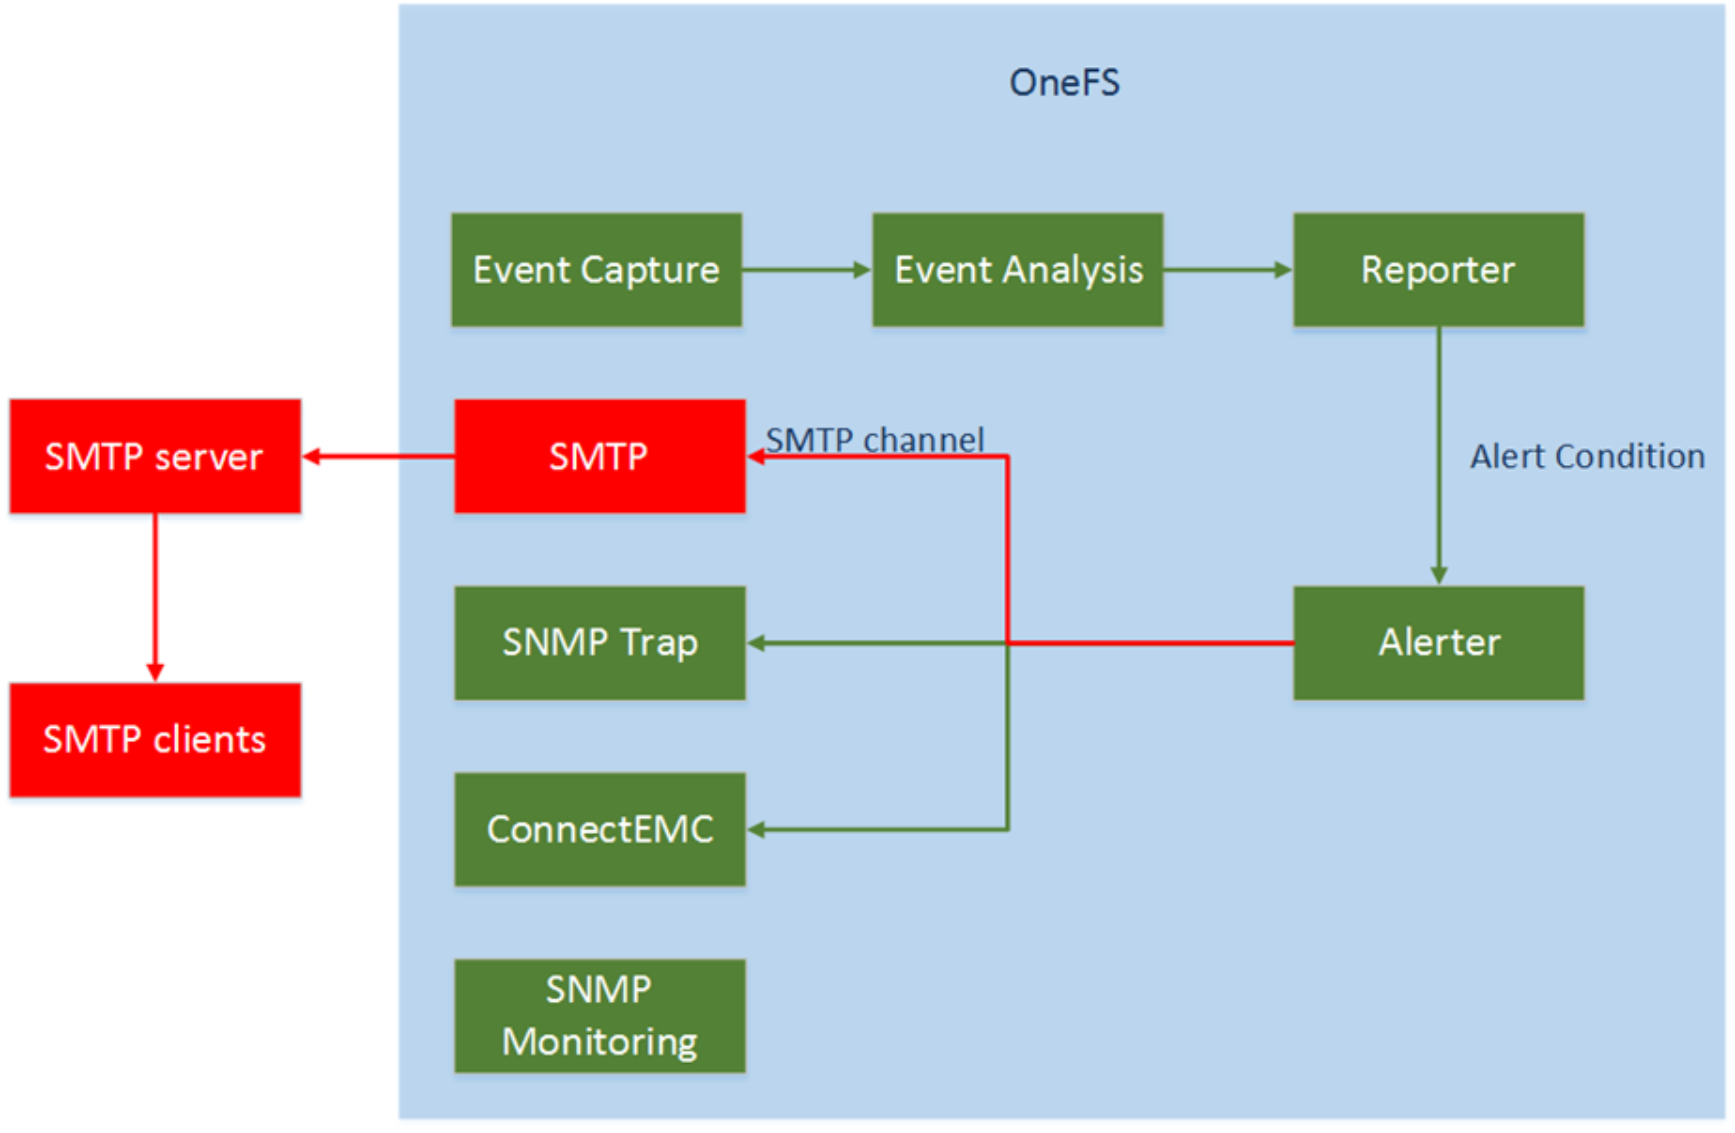
Figure 16. SMTP alerts architecture
In the message body of SMTP Alerts, the following key information will be included as listed in Table 6:
Table 6. Details in the message body of SMTP alerts
|
Information |
Description |
|
Cluster information |
Cluster information includes:
|
|
Node information |
For some events, the problematic node will be listed. It is in the form of devid 1, devid 2 and so on which corresponds to node 1, node 2 and so on. |
|
Event information |
Event information includes:
|
|
Attachment information |
Attachment is used to provide further detailed information about the event. |
Configuration considerations
The general configuration for SMTP alerting requires the end user to provide the following information:
- Send from: The email address that you want your notifications to be sent from. This does not need to be a real account on a mail server unless required by your SMTP relay.
- Subject: This is the base subject that you want your notifications to have. Additional information about the notification will be added to the subject depending on the type of event and severity of the event.
- SMTP Host or relay address: This should be the public IP address or DNS name for the mail server which will accept SMTP relaying from your cluster.
- SMTP relay port: The port that your mail server will accept SMTP relaying over, typically this will be either port 25, or 465 if your mail server supports SSL for SMTP.
- Use SMTP authentication: It is optional to enable SMTP Authentication. Once it is enabled, the user information will be used to authenticate to the mail server.
- Notification batch mode: Enabling this option will group notifications together by severity, category, or you can have it batch all notifications together so that you only receive a single notification per event.
- Notification Email template: Here you can select a notification template file from your OneFS cluster to use for notifications.
PowerScale OneFS supports using public SMTP servers for alert notification, but it does not support multifactor authentication or 2-step authentication. For details, see the knowledge base article: Email notifications not working through smtp.gmail.com.
SMTP alerts support encrypted communication between SMTP servers and PowerScale clusters which is a more secure and recommended way for SMTP alert configuration. However, in some releases of OneFS version 8, when the encryption is configured in the channel, SMTP event notification will fail. We suggest you open a ticket with the support center to resolve this issue. For detailed information, refer to SMTP event notification was failed when configured Alert channel manually with STARTTLS for connection security.
SNMP alerts
SNMP alerts provide a standardized interface to query network devices for information. This can include uptime, descriptions, locations, and device-specific information. For OneFS, the device specific information includes cluster and node data, disk health, and much more.
There are two parts to the OneFS implementation of SNMP as listed below:
- SNMP monitoring: A synchronous way for administrators to query PowerScale information, usually for monitoring purposes.
- SNMP TRAP: An asynchronous way for administrators to subscribe to a subset of events.
This section will only cover SNMP TRAP. The SNMP monitoring will be discussed in section 2.
Note: At the time of writing, any value in the OneFS SNMP TRAP configuration cannot be customized.
How SNMP alerts work
As explained in the Alert architecture section, OneFS sends an SNMP TRAP when CELOG events occur, sending them through configured SNMP TRAP channels. Internally SNMP TRAPs are sent by process snmpinform or snmptrap with appropriate parameters to a third-party SNMP management console on the client side.
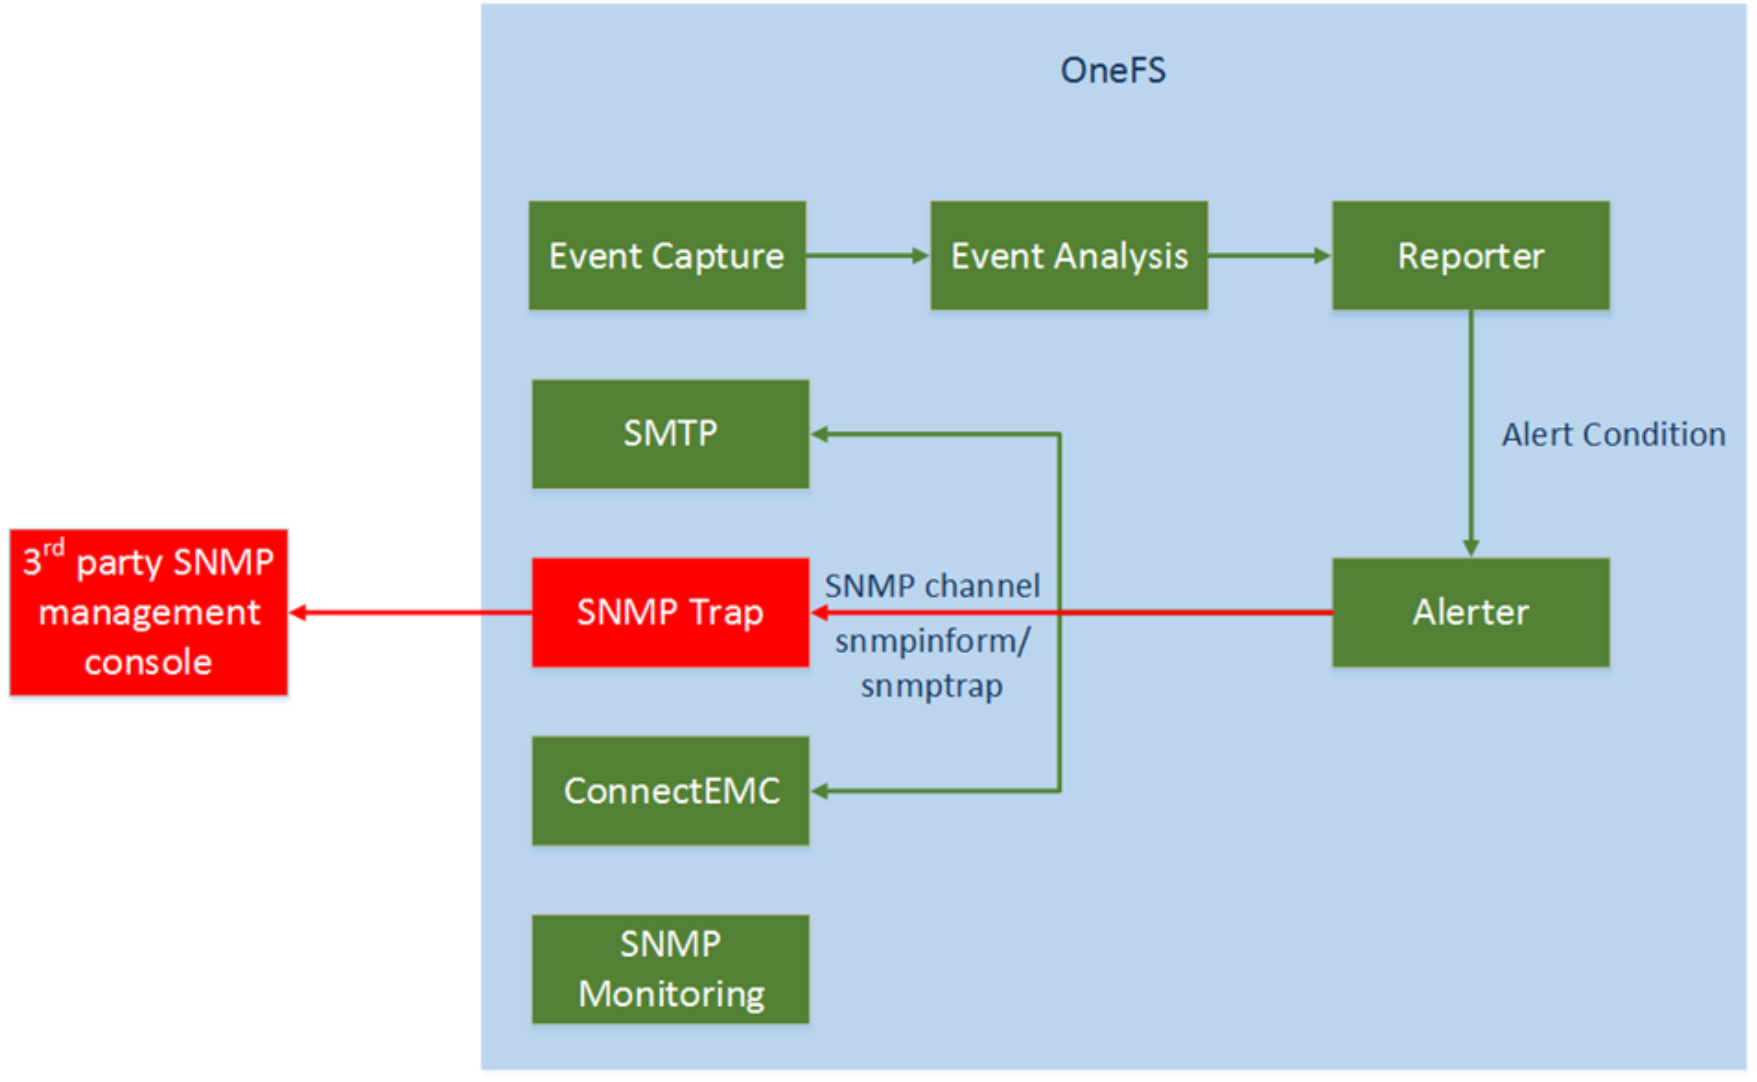
Figure 17. SNMP TRAP architecture
As shown in this figure, either ‘snmpinform’ or ‘snmptrap’ can send the SNMP TRAP notification. The difference is that snmptrap is used to send the unacknowledged SNMP TRAP, which means that this process does not know whether the remote subscriber has received the message. The snmpinform, on the other hand, can send an acknowledged SNMP TRAP, which is also known as SNMP INFORM. For the detailed configuration of snmpinform and snmptrap, see the section Configuration considerations.
OneFS uses a custom management information base (MIB) to define human-readable names for managed SNMP objects and specify their data types and other properties. You can download these PowerScale specific MIBs from aa PowerScale node under /usr/share/snmp/mib/. For detailed information about MIB, see the section SNMP monitoring architecture.
Configuration considerations
SNMPv2c TRAP
Prior to OneFS 8.2.0, PowerScale OneFS only supports SNMPv2c TRAP, which means there is no authentication or encryption feature for SNMP TRAP. For the detailed difference between SNMPv2c and SNMPv3, see the section SNMP monitoring architecture.
To create an SNMP channel using snmptrap to send unacknowledged SNMP TRAP, use the following CLI command:
isi event channels create channel_1 snmp –-use-snmp-trap true
To create an SNMP channel using snmpinform to send acknowledgeable SNMP INFORMs, use the following CLI command:
isi event channels create channel_2 snmp –-use-snmp-trap false
Note: The switch to use snmpinform or snmptrap is only available in the CLI or PAPI (Platform API).
From OneFS version 8.0 onwards, CELOG uses snmpinform by default to send acknowledgeable SNMP TRAPs and sometimes this may not be supported in all customer environments. In these cases, it is recommended to modify the alert channel back to snmptrap. For details, see the KB article Upgrade to 8.0.x changes default SNMP behavior from 'snmptraps' to 'snmpinform'.
When an event channel has been set up to enable the snmptrap settings, changing the channel by the WebUI will lose the value of the snmptrap settings and revert to snmpinform settings. This issue is fixed in OneFS 8.0.0.6 and for the detailed information, see the KB article CELOGv2: Modify SNMP channel via WebUI reset use-snmp-trap.
The general configuration for SNMP alerts requires the end user to provide the following information:
- Community: The community name to subscribe the SNMP alert. The default value is public. The SNMP management software will check the community string extracted from an incoming SNMP TRAP request header to see if it matches the local configuration.
- Host: The host to receive SNMP alert
The following command is an example to create an SNMP channel using snmptrap to the public community on a host with IP address 10.xxx.xxx.xxx
isi event channels create snmpchannel snmp –-use-snmp-trap true –-community public –-host 10.xxx.xxx.xxx
After you have created the SNMP channel, create an alert to use this channel:
isi event alerts modify myalert --channel snmpchannel
It is recommended to test the SNMP alert settings before you configure the third-party SNMP management software. The following example uses snmptrapd to verify the configuration and test the SNMP alert on a remote server.
- Copy ISILON-MIB.txt and ISILON-TRAP-MIB.txt from PowerScale to the directory of /usr/share/snmp/mibs/ in the remote machine.
- Create a configuration file for snmptrapd. In this file, specify the community name as public.
echo "authCommunity log public" > /tmp/traps.cfg
- Set up a minimal SNMP TRAP server using snmptrapd utility from the Net-SNMP toolchain.
snmptrapd -Lf /tmp/snmptrapd_traps.log -C -c /tmp/traps.cfg -p /tmp/at_snmp.pid -m ALL
- Send a test alert and wait several minutes to check if there is a corresponding update in the /tmp/snmptrapd_traps.log file:
NET-SNMP version 5.7.2
2018-05-07 04:56:46 <UNKNOWN> [UDP: [10.yyy.yyy.yyy]:35488->[10.xxx.xxx.xxx]:162]:
DISMAN-EVENT-MIB::sysUpTimeInstance = Timeticks: (873813181) 101 days, 3:15:31.81
SNMPv2-MIB::snmpTrapOID.0 = OID: ISILON-TRAP-MIB::testEventCrit
ISILON-TRAP-MIB::instanceIdentifier = STRING: "2221"
ISILON-MIB::clusterName = STRING: x41040g
ISILON-MIB::nodeName = STRING: x41040g-1
ISILON-MIB::nodeSerialNumber = STRING: SX410-301448-0070
ISILON-TRAP-MIB::eventKbUrl = STRING: "Unavailable."
SNMPv3 TRAP
Starting from OneFS 8.2.0, PowerScale supports SNMPv3 TRAP which provides more security options like authentication and encryption. The detailed security levels supported are listed below:
Table 7. Supported security levels
|
Protocol version |
Security levels |
Description |
|
SNMPv3 |
AuthPriv |
Both authentication and encryption are enabled |
|
AuthNoPriv |
Authentication is enabled but encryption is disabled |
|
|
noAuthNoPriv |
Both authentication and encryption are disabled |
The security level can be configured through the parameter --snmp-security-level under isi event channel modify. Unlike SNMPv2c, which use SNMP community string to identify the subscriber, SNMPv3 use MD5 or SHA encrypted passphrase for this purpose. Based on this, the community string should be left empty when the SNMPv3 channel is created. To set the authentication algorithm, use the parameter --snmp-auth-protocol and at the same time set the passphrase by --snmp-auth-password.
The SNMPv3 channel can only be created or configured through OneFS CLI. The following is an example to walk through all the configurations for this purpose. In this example, we create an SNMPv3 user - traptest whose passphrase is mypassword for both authentication (SHA) and encryption (AES). This user will be used in this SNMPv3 channel for the remote SNMPv3 host 10.7.xxx.xxx to subscribe the SNMPv3 TRAP.
- Use the following CLI to create an SNMPv3 channel
isi event channels create snmpchannel snmp
--host 10.7.xxx.xxx
--use-snmp-trap True
--snmp-use-v3 True
--snmp-auth-protocol SHA
--snmp-auth-password mypassword
--snmp-priv-protocol AES
--snmp-priv-password mypassword
--snmp-security-level authPriv
--snmp-security-name traptest
--snmp-engine-id 0x8000000001020304
- Use the following CLI to create an alert associated with this channel:
isi event alerts modify myalert --channel snmpchannel
It is recommended to test the SNMP alert settings before you configure the third-party SNMP management software. The following example uses snmptrapd to verify the configuration and test the SNMP alert on a remote server.
- Copy ISILON-MIB.txt and ISILON-TRAP-MIB.txt from PowerScale to the directory of /usr/share/snmp/mibs/ in the remote machine.
- Create a configuration file for snmptrapd. In this file, specify the SNMPv3 user information:
echo "createUser -e 0x8000000001020304 traptest SHA mypassword AES mypassword
authuser log traptest" > /tmp/traps.cfg
- Set up a minimal SNMP TRAP server using snmptrapd utility from the Net-SNMP toolchain.
snmptrapd -Lf /tmp/snmptrapd_traps.log -C -c /tmp/traps.cfg -p /tmp/at_snmp.pid -m ALL
- Send a test alert and wait several minutes to check if there is a corresponding update in the /tmp/snmptrapd_traps.log file:
DISMAN-EVENT-MIB::sysUpTimeInstance = Timeticks: (6229647) 17:18:16.47 SNMPv2-MIB::snmpTrapOID.0 = OID: SNMPv2-SMI::enterprises.12124.250.24.6.3 SNMPv2-SMI::enterprises.12124.250.50.15 = STRING: "9"
SNMPv2-SMI::enterprises.12124.1.1.1 = STRING: "vshen-5coqidt"
SNMPv2-SMI::enterprises.12124.2.1.1 = STRING: "vshen-5coqidt-1" SNMPv2-SMI::enterprises.12124.2.1.5 = STRING: "SV200-004EIJ-5XA4" SNMPv2-SMI::enterprises.12124.250.50.19 = STRING: "400150007" SNMPv2-SMI::enterprises.12124.250.50.20 = STRING: "SW_UPGRADE_NODE_NON_RESPONSIVE" SNMPv2-SMI::enterprises.12124.250.50.18 = STRING: http://doc.isilon.com/onefs/8.2/help/en-us/#ifs_r_event_400150007.html
Clear SNMP
Clear SNMP TRAP is introduced in OneFS 8.2.0. When an issue happens and is detected by CELOG, an SNMP TRAP will be sent if the corresponding SNMP channel has been created before. After this issue is fixed and the event is marked resolved, a clear SNMP TRAP will automatically be sent to the SNMP subscriber. The overall workflow is shown in Figure 18.
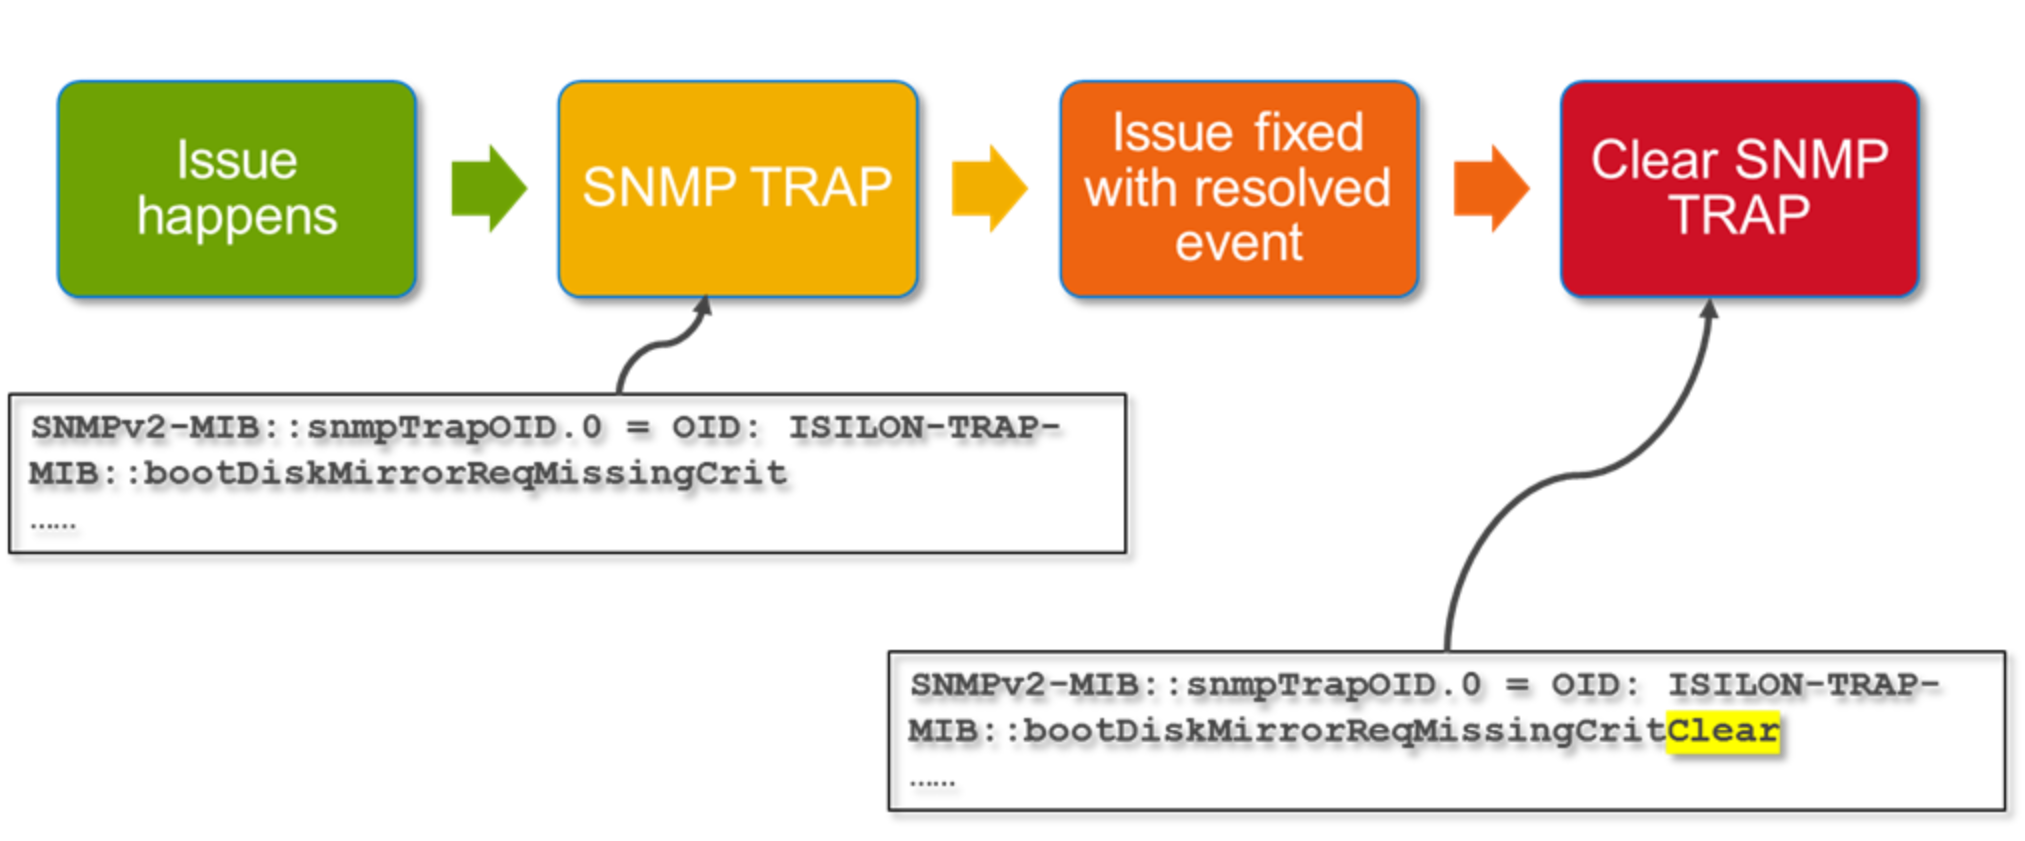
Figure 18. Clear SNMP TRAP
In the example shown in this figure, an issue happens due to the missing mirror boot disk. This issue is detected by the CELOG, and an SNMP TRAP is delivered with OID: bootDiskMirrorReqMissingCrit to the SNMP subscriber. After this issue is fixed and the event group is marked as resolved, a clear SNMP TRAP is delivered automatically to notify to the subscriber. The OID, in this case, is bootDiskMirrorReqMissingCritClear.
Note: From OneFS 8.2.0, all SNMP TRAP should have clear versions.
CELOG and SNMP TRAPS
From OneFS 8.2.0, All the CELOG eventgroups now have associated SNMP TRAP.
SNMP monitoring
Overview
You can use SNMP to remotely monitor the PowerScale cluster hardware components, such as fans, hardware sensors, power supplies, and disks. Use the default Linux® SNMP tools or a UI-based SNMP tool of your choice for this purpose.
Note: SNMP monitoring and SNMP TRAP are two different topics. SNMP monitoring is the query to get the value of the SNMP entities by SNMP GET in a synchronized way. SNMP TRAP is used to subscribe the events by SNMP INFORM/TRAP in an asynchronous way.
SNMP monitoring architecture
OneFS SNMP monitoring feature only supports SNMPv2c and SNMPv3. Compared with SNMPv2c, SNMPv3 adds both authentication and encryption features. Table 8 lists the supportability for OneFS SNMP monitoring.
Table 8. SNMPv2c and SNMPv3 supportability
|
Protocol version |
Configuration |
Configuration description |
Supportability |
Note |
|
SNMPv2c |
N/A |
N/A |
Supported |
By default, SNMPv2c is enabled |
|
SNMPv3 |
AuthPriv |
Both authentication and encryption are enabled |
Not supported |
By default, SNMPv3 is disabled |
|
AuthNoPriv |
Authentication is enabled but encryption is disabled |
Supported (default, if you enable SNMPv3 and it is recommended) |
||
|
noAuthNoPriv |
Both authentication and encryption are disabled |
Supported |
The architecture of the SNMP monitoring feature is shown in Figure 19:
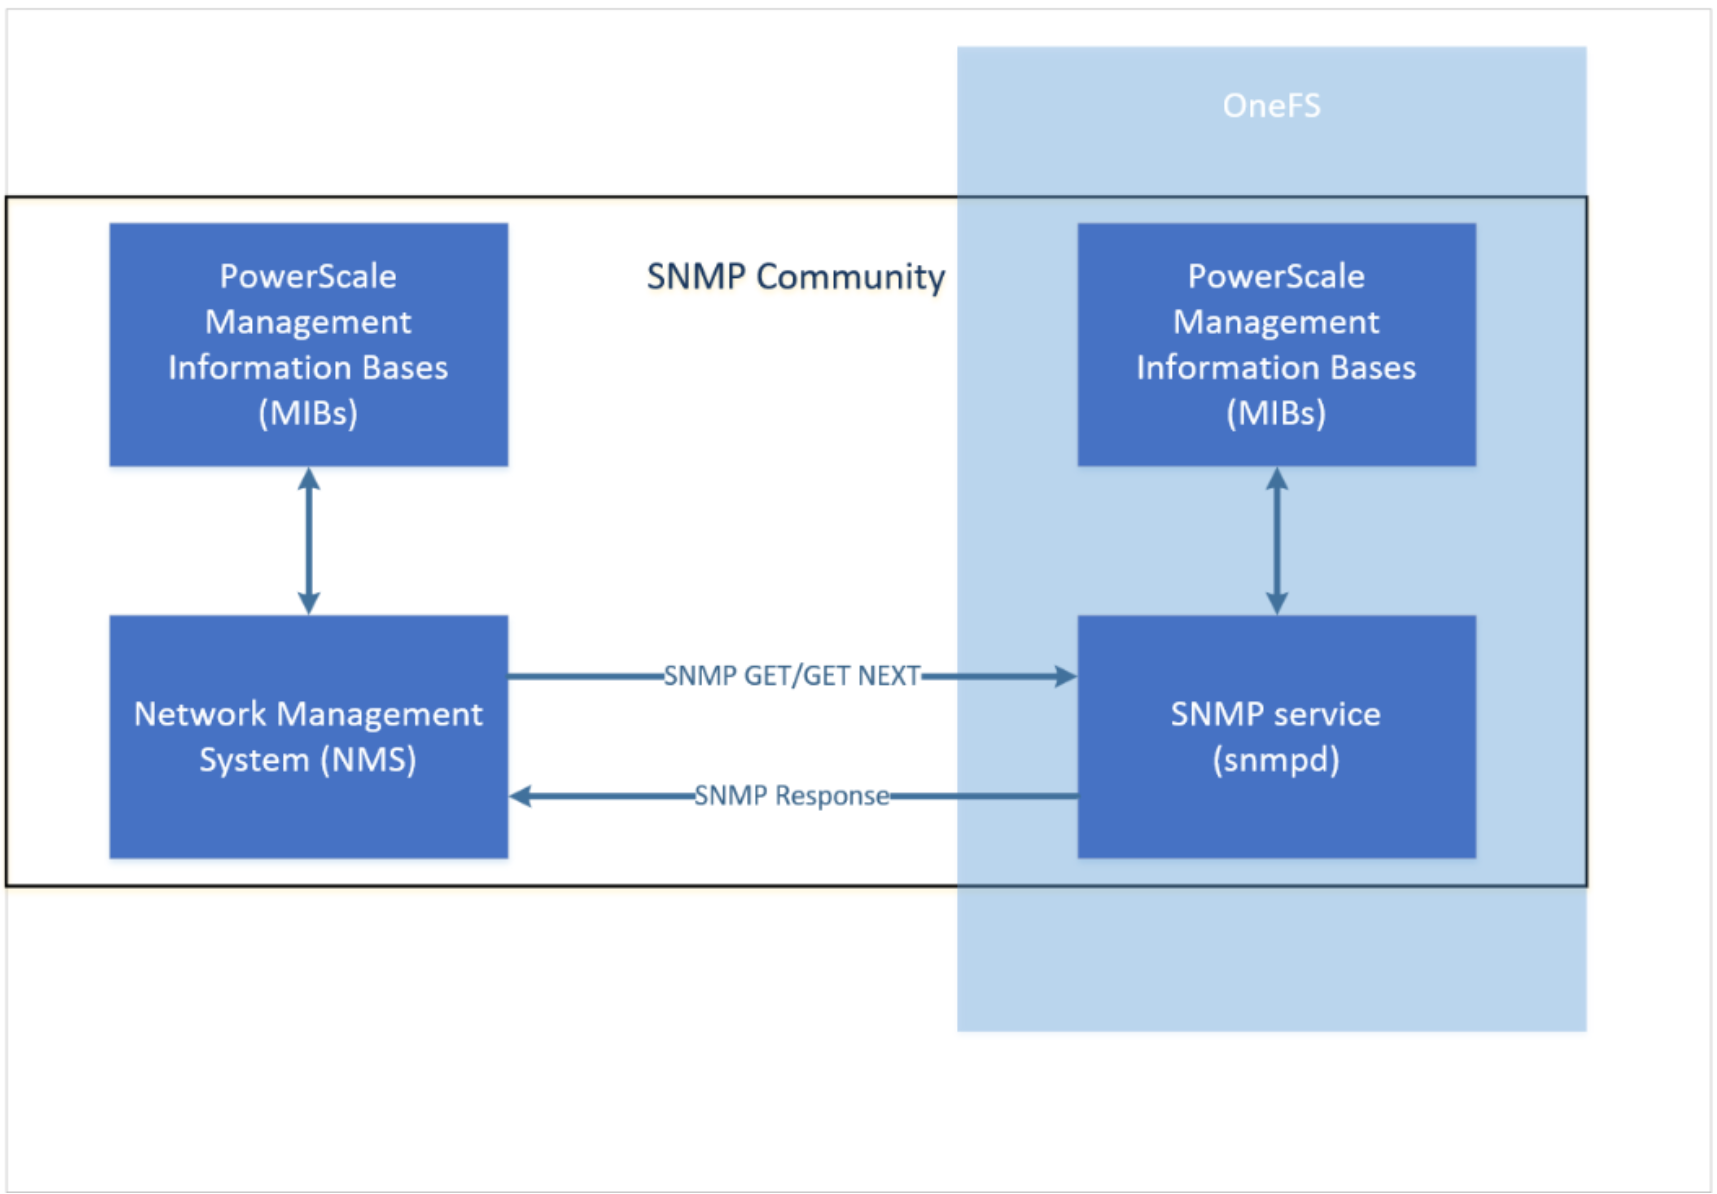
Figure 19. SNMP monitoring architecture
SNMP applications run in a network management system (NMS) and issue queries (SNMP GET/GET NEXT) to the SNMP service on PowerScale to gather information. snmpd – the SNMP daemon on the cluster responds to the queries and sends the corresponding statistics to the SNMP applications. An SNMP community is a logical relationship between the SNMP service on the OneFS side and the NMS on the client side. The community has a name, and the default name for PowerScale OneFS is I$ilonpublic.
Elements in an SNMP hierarchy are arranged in a tree structure, similar to a directory tree. As with directories, identifiers move from general to specific as the string progresses from left to right. Unlike a file hierarchy, each element is not only named, but also numbered.
For example, the SNMP entity .iso.org.dod.internet.private.enterprises.isilon.oneFSss.ssLocalNodeId maps to the object id (OID) .1.3.6.1.4.1.12124.3.2 as shown in Figure 20. The part of the name that refers to the OneFS SNMP namespace is the 12124.3 element. Anything further to the right of that number is related to OneFS specific monitoring.
Management Information Base (MIB) documents define human-readable names for managed objects and specify their data types and other properties. You can download MIBs that are created for SNMP monitoring of aa PowerScale cluster from the OneFS web administration interface or manage them using CLI. MIBs are stored in /usr/share/snmp/mibs/ on a OneFS node. The OneFS MIBs serve two purposes:
- Provide automatic name to OID mapping
- Provide OneFS specific information that is unavailable in standard MIBs
A PowerScale cluster has two separate MIBs:
- ISILON-MIB is used for the SNMP monitoring feature.
- ISILON-TRAP-MIB is used for the SNMP TRAP feature.
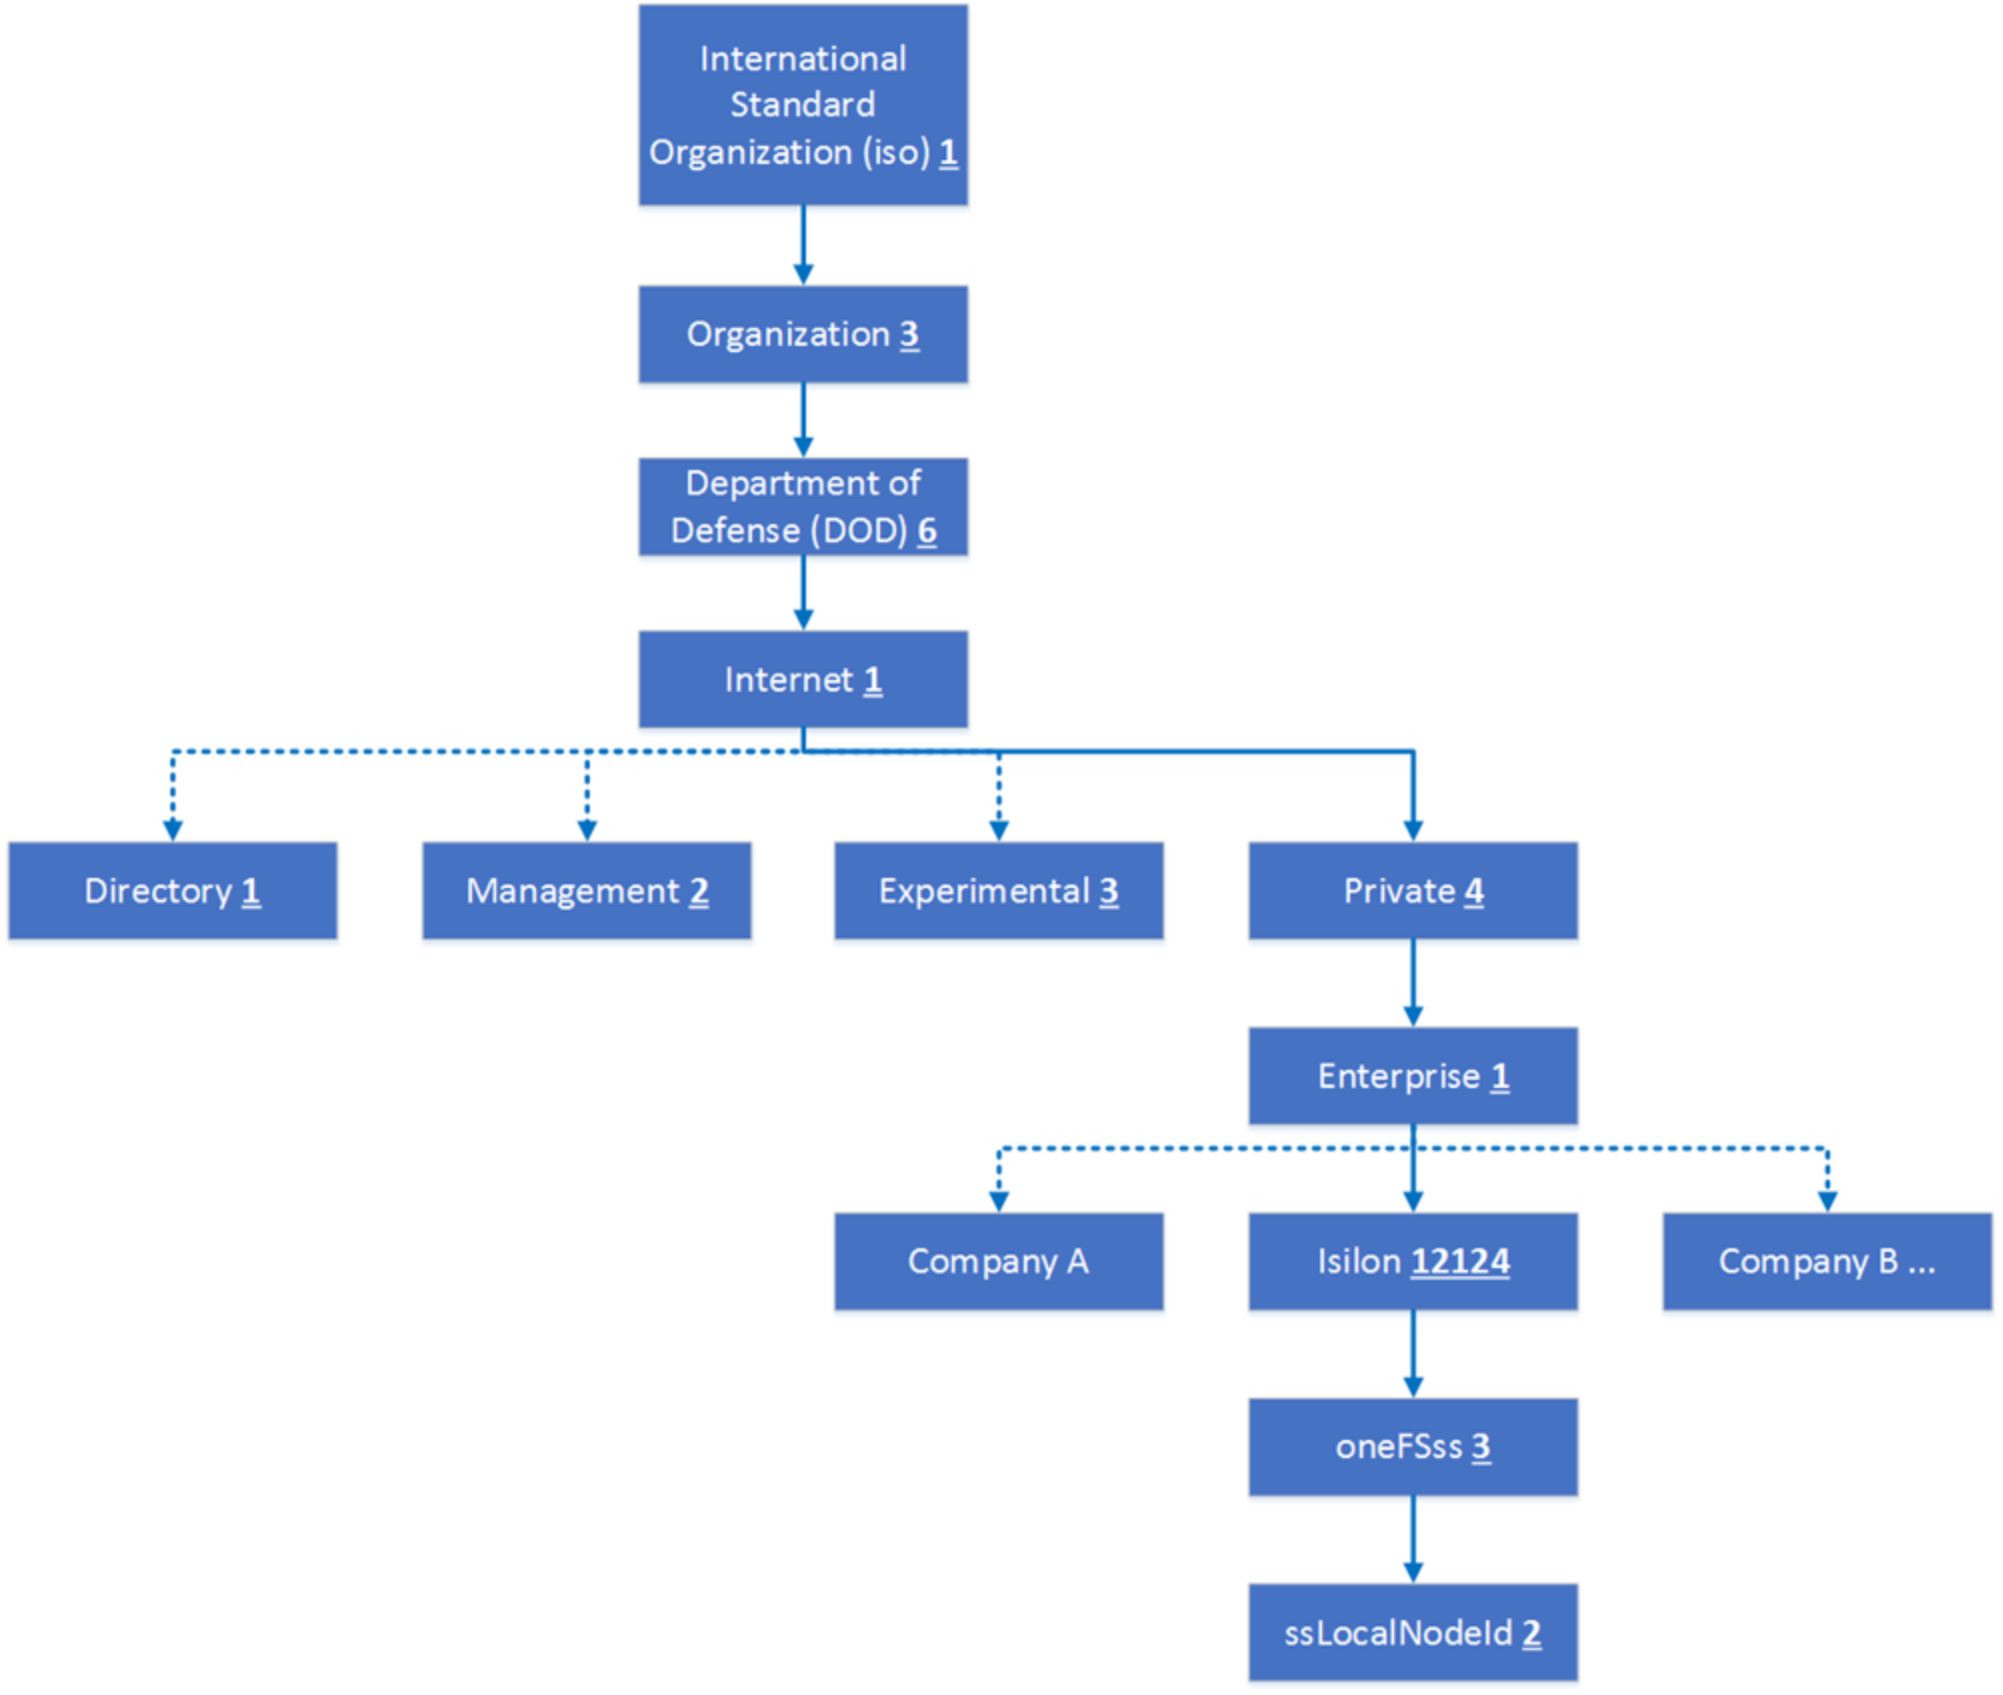
Figure 20. PowerScale MIB example
Configuration considerations
The following two sections will provide some guidelines and configuration considerations on the SNMP monitoring feature in OneFS.
- General considerations: Introduction and step-by-step procedure on how to configure SNMP monitoring
- Security considerations: Introduction of security best practices dealing with SNMP monitoring
General considerations
By default, the SNMP monitoring feature is enabled and can be configured from both the CLI (isi snmp settings modify) and the web UI (SNMP Monitoring under General Settings of Cluster Management). You can enable or disable SNMP monitoring, allow SNMP access by version, and configure other settings, some of which are optional. All SNMP access is read-only.
There is one major difference between the CLI and the web UI. In CLI, it allows you to send the passphrase for encryption through the parameter –set-snmp-v3-priv-password, meanwhile there is no such option in the web UI. The recommendation is to not modify this passphrase. In case you modified this and met with an error, open a service request with Dell Support.
For step-by-step configuration details for the SNMP monitoring feature, see the CLI Administration Guide.
After the configuration is completed, you can use snmpwalk to validate if the configuration is good or not. This tool can be run either on a remote host or on a PowerScale node itself.
Note: This tool is pre-installed on the PowerScale system.
For SNMPv2c, the following is an example of using local snmpwalk running on the PowerScale to validate the configuration.
f800eth-1# snmpwalk -v2c -c I\$ilonpublic -m all localhost ifsFilesystem
ISILON-MIB::ifsTotalBytes.0 = Counter64: 189940499251200
ISILON-MIB::ifsUsedBytes.0 = Counter64: 22635765792768
ISILON-MIB::ifsAvailableBytes.0 = Counter64: 160600454995968
ISILON-MIB::ifsFreeBytes.0 = Counter64: 167304733458432
ISILON-MIB::ifsFilesystem.5.0 = INTEGER: 0
ISILON-MIB::ifsFilesystem.6.0 = Gauge32: 86400000
For SNMPv3, use the following example to validate the configuration.
snmpwalk -m all -c I\$ilonpublic -v 3 -l authnopriv -u general -a md5 -A 'password' localhost ifsFilesystem
ISILON-MIB::ifsTotalBytes.0 = Counter64: 400611948904448
ISILON-MIB::ifsUsedBytes.0 = Counter64: 10623134490624
ISILON-MIB::ifsAvailableBytes.0 = Counter64: 381578066165760
ISILON-MIB::ifsFreeBytes.0 = Counter64: 389988814413824
ISILON-MIB::ifsFilesystem.5.0 = INTEGER: 0
ISILON-MIB::ifsFilesystem.6.0 = Gauge32: 86400000
For details on how to use snmpwalk, see the section snmpwalk.
Security considerations
If you plan to monitor cluster statistics, SNMPv3 is recommended. When SNMPv3 is used, OneFS requires the SNMP-specific security level of AuthNoPriv as the default value when querying the PowerScale cluster. At the same time, it is recommended to disable SNMPv1 and SNMPv2c access.
Note: OneFS does not support SNMPv1. Although an option for –snmp-v1-v2c-access exists in the OneFS CLI command. If you turn on that parameter, OneFS will only monitor through SNMPv2c.
To do this, use the following CLI command line:
- Enable SNMPv3 access:
isi snmp settings modify –snmp-v3-access=yes
- Disable SNMPv1 and SNMPv2c access
isi snmp settings modify –snmp-v1-v2c-access=no
For security, it is recommended to disable the SNMP service if SNMP monitoring is not required. Disabling SNMP on the cluster does not affect the sending of SNMP TRAP alerts from the cluster to an SNMP management server.
To disable the SNMP monitoring feature in OneFS, use the following CLI command line:
isi services snmp disable
Tools and CLIs
Tools and CLIs
This section describes tools which can be used to validate SNMP TRAP or SNMP monitoring configurations. Also, there are some useful OneFS CLI commands which will be discussed in this section. The common CLI commands to create and configure alerts and channels will not be covered in this section. For that part, see the OneFS CLI Administration Guide.
snmpwalk
snmpwalk is the tool in the Net-SNMP tool chain to retrieve or query the SNMP entities using SNMP GET request. This tool is also pre-installed on the cluster, making it easy to use if you want to validate the SNMP monitoring configuration locally instead of on a different host. snmpwalk supports both SNMPv2c and SNMPv3.
For SNMPv2c, use the following example to validate the configuration.
f800eth-1# snmpwalk -v2c -c I\$ilonpublic -m all localhost ifsFilesystem
ISILON-MIB::ifsTotalBytes.0 = Counter64: 189940499251200
ISILON-MIB::ifsUsedBytes.0 = Counter64: 22635765792768
ISILON-MIB::ifsAvailableBytes.0 = Counter64: 160600454995968
ISILON-MIB::ifsFreeBytes.0 = Counter64: 167304733458432
ISILON-MIB::ifsFilesystem.5.0 = INTEGER: 0
ISILON-MIB::ifsFilesystem.6.0 = Gauge32: 86400000
The above command means to query the SNMP entity – “ifsFilesystem” on this PowerScale node under the community of “I\$ilonpublic” using SNMPv2c protocol.
For SNMPv3, use the following example to validate the configuration.
snmpwalk -m all -c I\$ilonpublic -v 3 -l authnopriv -u general -a md5 -A 'password' localhost ifsFilesystem
ISILON-MIB::ifsTotalBytes.0 = Counter64: 400611948904448
ISILON-MIB::ifsUsedBytes.0 = Counter64: 10623134490624
ISILON-MIB::ifsAvailableBytes.0 = Counter64: 381578066165760
ISILON-MIB::ifsFreeBytes.0 = Counter64: 389988814413824
ISILON-MIB::ifsFilesystem.5.0 = INTEGER: 0
ISILON-MIB::ifsFilesystem.6.0 = Gauge32: 86400000
snmptrapd
snmptrapd is the tool in the Net-SNMP tool chain that receives and logs SNMP TRAP messages. By default, it listens on UDP port 162 on all IPv4 interfaces. Since port 162 is a privileged port, snmptrapd must be run as root.
To set up a minimal SNMP TRAP server to validate the OneFS SNMP TRAP settings, use the following CLI commands.
- Create a temporary configuration file for snmptrapd to log messages for the public community. The community string should be aligned with the configuration in the SNMP channel. For snmptrapd configuration file details, see the snmptrapd.conf(5) - Linux man page.
echo "authCommunity log public" > /tmp/traps.cfg
- Start the snmptrapd daemon services to receive the SNMP TRAP. The parameter “-Lf /tmp/snmptrapd_traps.log” means to log all incoming messages to a specific file under /tmp. The parameter “-C -c /tmp/traps.cfg” means not to read the default configuration files, but to read the file which was created in the first step for configuration. For snmptrapd details, see SNMPTRAPD.
snmptrapd -Lf /tmp/snmptrapd_traps.log -C -c /tmp/traps.cfg -m ALL
- Set up the SNMP channel and alert in OneFS and send a test alert.
Wait for several minutes, then check to see if there is a corresponding entry in the /tmp/snmptrapd_traps.log file.
NET-SNMP version 5.7.2
2018-05-07 04:56:46 <UNKNOWN> [UDP: [10.yyy.yyy.yyy]:35488->[10.xxx.xxx.xxx]:162]:
DISMAN-EVENT-MIB::sysUpTimeInstance = Timeticks: (873813181) 101 days, 3:15:31.81
SNMPv2-MIB::snmpTrapOID.0 = OID: ISILON-TRAP-MIB::testEventCrit
ISILON-TRAP-MIB::instanceIdentifier = STRING: "2221"
ISILON-MIB::clusterName = STRING: x41040g
ISILON-MIB::nodeName = STRING: x41040g-1
ISILON-MIB::nodeSerialNumber = STRING: SX410-301448-0070
ISILON-TRAP-MIB::eventKbUrl = STRING: "Unavailable."
To validate the OneFS SNMP TRAP configuration in a Windows environment, see the KB article How to install 'Net-SNMP' tools in Windows and use snmptrapd/snmpwalk to test receive/send SNMP trap information.
Useful CLI commands
This section lists some useful CLI commands to configure alerts in OneFS:
Check SNMP monitoring service
Use the following CLI command to check if SNMP monitoring service is enabled on the PowerScale node:
isi services -a snmp
To check this service for all the PowerScale nodes, use the following script:
isi_for_array -sX 'pgrep snmpd | wc -l'
If the service is enabled on all the PowerScale nodes, the output will look like this:
f800eth-1: 1
f800eth-2: 1
f800eth-3: 1
f800eth-4: 1
Check port connectivity
OneFS SNMP monitoring service and SNMP TRAP use dedicated ports for external communications as listed in Table 9.
Table 9. SNMP monitoring and SNMP TRAP connectivity
|
Port |
Protocol |
Description |
Enable or disable on installation |
|
|
snmp |
161 |
UDP |
SNMP monitoring |
Enabled |
|
snmptrapd snmpinfo |
162 |
UDP |
SNMP TRAP |
Enabled |
Use the following command to query the port connectivity for snmp or snmptrap on a dedicated PowerScale node
x41040g-1# nc -u -z localhost 161
Connection to localhost 161 port [udp/snmp] succeeded!
x41040g-1# nc -u -z localhost 162
Connection to localhost 162 port [udp/snmptrap] succeeded!
To check the port connectivity for all the PowerScale nodes, use the following script:
isi_for_array -sX 'nc -u -z localhost 161'
If the port is reachable on all the PowerScale nodes, the output will look like this:
x41040g-1: Connection to localhost 161 port [udp/snmp] succeeded!
x41040g-2: Connection to localhost 161 port [udp/snmp] succeeded!
x41040g-3: Connection to localhost 161 port [udp/snmp] succeeded!
isi event types
From OneFS 8.0.0.5 onwards, the CLI – isi event types is introduced and will list all the supported event types for SMTP alert which can be configured in the OneFS alert configuration. This is useful in a scenario such as disabling certain event types for alert configuration. For details, see the section Alert configuration by the deny list.
To list all the supported event types in csv format, use the following CLI command:
isi event types list –format=csv
Note: For all event groups which can be subscribed through SNMP, refer to appendix A.
Appendix A: SNMP monitoring list
Table 10 lists all the ISILON-MIB details for the SNMP monitoring feature.
Table 10. SNMP monitoring and SNMP TRAP connectivity
|
SNMP MIB category |
Name |
Description |
Example |
|
clusterStatus |
clusterName |
The name of the cluster. |
# snmpwalk -v2c -c I\$ilonpublic -m all localhost clusterStatus ISILON-MIB::clusterName.0 = STRING: x41040g ISILON-MIB::clusterHealth.0 = INTEGER: attn(1) ISILON-MIB::clusterGUID.0 = STRING: 001e67a82234a6c66a5a9a0d7148fec3c6d2 ISILON-MIB::nodeCount.0 = INTEGER: 3 ISILON-MIB::configuredNodes.0 = STRING: 1,2,3 ISILON-MIB::onlineNodes.0 = STRING: 1,2,3 ISILON-MIB::offlineNodes.0 = STRING: |
|
clusterHealth |
The overall health of the cluster. The result should be one of the following: ok(0), attn(1), down(2), invalid(3) |
||
|
clusterGUID |
The globally unique identifier for the cluster. |
||
|
nodeCount |
Total number of nodes in the cluster. |
||
|
configuredNodes |
List of configured nodes by logical node number. The list of numbers is delimited by a single comma. |
||
|
onlineNodes |
List of online nodes by logical node number. The list of numbers is delimited by a single comma. |
||
|
offlineNodes |
List of offline nodes by logical node number. The list of number is delimited by a single comma. |
||
|
clusterIfsPerf |
clusterIfsInBytes |
Total number of bytes written to the /ifs filesystem. |
# snmpwalk -v2c -c I\$ilonpublic -m all localhost clusterIfsPerf ISILON-MIB::clusterIfsInBytes.0 = Counter64: 0 ISILON-MIB::clusterIfsInBitsPerSecond.0 = Counter64: 58635 ISILON-MIB::clusterIfsOutBytes.0 = Counter64: 0 ISILON-MIB::clusterIfsOutBitsPerSecond.0 = Counter64: 2458645 |
|
clusterIfsInBitsPerSecond |
Throughput rate into the /ifs filesystem. |
||
|
clusterIfsOutBytes |
Total number of bytes read from the /ifs filesystem. |
||
|
clusterIfsOutBitsPerSecond |
Throughput rate out of the /ifs filesystem. |
||
|
clusterNetworkPerf |
clusterNetworkInBytes |
Total bytes into all external interfaces for all nodes. Obsolete |
# snmpwalk -v2c -c I\$ilonpublic -m all localhost clusterNetworkPerf ISILON-MIB::clusterNetworkInBytes.0 = Counter64: 0 ISILON-MIB::clusterNetworkInBitsPerSecond.0 = Counter64: 37606 ISILON-MIB::clusterNetworkOutBytes.0 = Counter64: 0 ISILON-MIB::clusterNetworkOutBitsPerSecond.0 = Counter64: 21171 |
|
clusterNetworkInBitsPerSecond |
The cumulative input rate (bits per second) for all external interfaces. |
||
|
clusterNetworkOutBytes |
The cumulative output bytes for all external interfaces. Obsolete. |
||
|
clusterNetworkOutBitsPerSecond |
The cumulative output rate (bits per second) for all external interfaces. |
||
|
clusterCPUPerf |
clusterCPUUser.0 |
Average amount of CPU time (per mil) used by user processes averaged for all nodes over the last 5 seconds. |
# snmpwalk -v2c -c I\$ilonpublic -m all localhost clusterCPUPerf ISILON-MIB::clusterCPUUser.0 = Gauge32: 5 ISILON-MIB::clusterCPUNice.0 = Gauge32: 0 ISILON-MIB::clusterCPUSystem.0 = Gauge32: 6 ISILON-MIB::clusterCPUInterrupt.0 = Gauge32: 0 ISILON-MIB::clusterCPUIdlePct.0 = Gauge32: 990 |
|
clusterCPUNice.0 |
Average amount of CPU time (per mil) used by nice processes averaged for all nodes over the last 5 seconds. |
||
|
clusterCPUSystem.0 |
Average amount of CPU time (per mil) used by system processes averaged for all nodes over the last 5 seconds. |
||
|
clusterCPUInterrupt.0 |
Average amount of CPU time (per mil) used by interrupts averaged for all nodes over the last 5 seconds. |
||
|
clusterCPUIdlePct.0 |
Average amount of idle CPU time (per mil) averaged for all nodes averaged for all nodes over the last 5 seconds. |
||
|
ifsFilesystem |
ifsTotalBytes.0 |
Total cluster capacity of the /ifs filesystem in bytes. |
# snmpwalk -v2c -c I\$ilonpublic -m all localhost ifsFilesystem ISILON-MIB::ifsTotalBytes.0 = Counter64: 400611948904448 ISILON-MIB::ifsUsedBytes.0 = Counter64: 10623783337984 ISILON-MIB::ifsAvailableBytes.0 = Counter64: 381577417318400 ISILON-MIB::ifsFreeBytes.0 = Counter64: 389988165566464 ISILON-MIB::ifsFilesystem.5.0 = INTEGER: 0 ISILON-MIB::ifsFilesystem.6.0 = Gauge32: 86400000 |
|
ifsUsedBytes.0 |
The number of bytes consumed by user data in the /ifs filesystem. |
||
|
ifsAvailableBytes.0 |
The number of bytes available to store data in the /ifs filesystem. |
||
|
ifsFreeBytes.0 |
The number of bytes free in the /ifs filesystem (includes Virtual Hot Spare). |
||
|
accessTimeEnabled |
Indicates if access time tracking is enabled for files store on the /ifs filesystem. |
||
|
accessTimeGracePeriod |
Indicates the minimum amount of time (in milliseconds) between updates to a file's last access time. |
||
|
licenses |
licenseTable |
Licensing information for OneFS software modules. |
"licenseIndex","licenseModuleName","licenseStatus","licenseExpirationDate","Index Value" "1","SMARTQUOTAS","inactive","","1" "2","SNAPSHOTIQ","inactive","","2" |
|
snapshotSettings |
snapshotScheduledCreateEnabled.0 |
Indicates if the scheduled (automatic) creation of snapshots should occur. |
# snmpwalk -v2c -c I\$ilonpublic -m all localhost snapshotSettings ISILON-MIB::snapshotScheduledCreateEnabled.0 = INTEGER: yes(1) ISILON-MIB::snapshotScheduledDeleteEnabled.0 = INTEGER: yes(1) ISILON-MIB::snapshotReservedPct.0 = INTEGER: 0 ISILON-MIB::snapshotRootVisibilityNFS.0 = INTEGER: yes(1) ISILON-MIB::snapshotRootAccessNFS.0 = INTEGER: yes(1) ISILON-MIB::snapshotSubdirAccessNFS.0 = INTEGER: yes(1) ISILON-MIB::snapshotRootVisibilityCIFS.0 = INTEGER: yes(1) ISILON-MIB::snapshotRootAccessCIFS.0 = INTEGER: yes(1) ISILON-MIB::snapshotSubdirAccessCIFS.0 = INTEGER: yes(1) ISILON-MIB::snapshotRootVisibilityLocal.0 = INTEGER: yes(1) ISILON-MIB::snapshotRootAccessLocal.0 = INTEGER: yes(1) ISILON-MIB::snapshotSubdirAccessLocal.0 = INTEGER: yes(1) |
|
snapshotScheduledDeleteEnabled.0 |
Indicates if scheduled (automatic) deletion of snapshots should occur. |
||
|
snapshotReservedPct.0 |
The percent of storage space reserved for snapshots. The value report is a percentage of total cluster storage capacity. |
||
|
snapshotRootVisibilityNFS.0 |
Indicates if the /ifs/.snapshot directory is visible to NFS clients |
||
|
snapshotRootAccessNFS.0 |
Indicates if the /ifs/.snapshot directory is accessible to NFS clients. |
||
|
snapshotSubdirAccessNFS.0 |
Indicates if .snapshot directories in subdirectories of /ifs are visible to NFS clients. |
||
|
snapshotRootVisibilityCIFS.0 |
Indicates if the /ifs/.snapshot directory is visible to CIFS clients. |
||
|
snapshotRootAccessCIFS.0 |
Indicates if the /ifs/.snapshot directory is accessible to CIFS clients. |
||
|
snapshotSubdirAccessCIFS.0 |
Indicates if .snapshot directories in subdirectories of /ifs are visible to CIFS clients. |
||
|
snapshotRootVisibilityLocal.0 |
Indicates if .snapshot directories in subdirectories of /ifs are visible to local users. |
||
|
snapshotRootAccessLocal.0 |
Indicates if the /ifs/.snapshot directory is visible to local users. |
||
|
snapshotSubdirAccessLocal.0 |
Indicates if the /ifs/.snapshot directory is accessible to local users. |
||
|
snapshotTable |
snapshotName |
The name of the snapshot. |
# snmpwalk -v2c -c I\$ilonpublic -m all localhost snapshotTable ISILON-MIB::snapshotName.1 = STRING: ISILON-MIB::snapshotCreated.1 = Gauge32: 1516948368 ISILON-MIB::snapshotExpires.1 = Gauge32: 0 ISILON-MIB::snapshotSize.1 = Counter64: 33792 ISILON-MIB::snapshotPath.1 = STRING: ISILON-MIB::snapshotAliasFor.1 = STRING: ISILON-MIB::snapshotLocked.1 = INTEGER: no(0) |
|
snapshotCreated |
The UNIX epoch time at which the snapshot was created. |
||
|
snapshotExpires |
The UNIX epoch time that the snapshot expires in seconds. |
||
|
snapshotSize |
The amount of storage space consumed by the snapshot in bytes. |
||
|
snapshotPath |
The path covered by the snapshot. |
||
|
snapshotAliasFor |
An alternate name for the snapshot. |
||
|
snapshotLocked |
Indicates if the snapshot is locked. |
||
|
nodeStatus |
Similar to the clusterStatus but only node wide |
|
|
|
nodeIfsPerf |
Similar to the clusterIfsPerf but only node wide |
|
|
|
nodeNetworkPerf |
Similar to the clusterNetworkPerf but only node wide |
|
|
|
nodeCPUPerf |
Similar to the clusterCPUPerf but only node wide |
|
|
|
nodeCPUPerfTable |
nodePerCPUUser |
Amount of CPU (per mil) used by user processes within the last 5 seconds for the CPU. |
ISILON-MIB::nodePerCPUUser.1 = Gauge32: 7 ISILON-MIB::nodePerCPUUser.2 = Gauge32: 44 ISILON-MIB::nodePerCPUUser.3 = Gauge32: 41 ISILON-MIB::nodePerCPUUser.4 = Gauge32: 19 ISILON-MIB::nodePerCPUUser.5 = Gauge32: 11 ISILON-MIB::nodePerCPUUser.6 = Gauge32: 43 ISILON-MIB::nodePerCPUUser.7 = Gauge32: 55 ISILON-MIB::nodePerCPUUser.8 = Gauge32: 3 ISILON-MIB::nodePerCPUUser.9 = Gauge32: 19 …… |
|
nodePerCPUNice |
Amount of CPU (per mil) used by nice processes within the last 5 seconds for the CPU. |
||
|
nodePerCPUSystem |
Amount of CPU (per mil) used by system processes within the last 5 seconds for the CPU. |
||
|
nodePerCPUInterrupt |
Amount of CPU (per mil) used by interrupts within the last 5 seconds for the CPU. |
||
|
nodePerCPUIdle |
Amount of CPU (per mil) used by idle processes within the last 5 seconds for the CPU. |
||
|
nodePerCPUID |
ID of the CPU. |
||
|
nodeProtocolPerfTable |
protocolName |
The name of the protocol. |
# snmpwalk -v2c -c I\$ilonpublic -m all localhost nodeProtocolPerfTable ISILON-MIB::protocolName.'.ftp' = STRING: ftp ISILON-MIB::protocolName.'.nlm' = STRING: nlm ISILON-MIB::protocolName.'.http' = STRING: http ISILON-MIB::protocolName.'.nfs3' = STRING: nfs3 ISILON-MIB::protocolName.'.nfs4' = STRING: nfs4 ISILON-MIB::protocolName.'.smb1' = STRING: smb1 ISILON-MIB::protocolName.'.smb2' = STRING: smb2 ISILON-MIB::protocolName.'.synciq' = STRING: synciq ISILON-MIB::protocolOpCount.'.ftp' = Gauge32: 0 ISILON-MIB::protocolOpCount.'.nlm' = Gauge32: 0 ISILON-MIB::protocolOpCount.'.http' = Gauge32: 0 ISILON-MIB::protocolOpCount.'.nfs3' = Gauge32: 0 ISILON-MIB::protocolOpCount.'.nfs4' = Gauge32: 0 ISILON-MIB::protocolOpCount.'.smb1' = Gauge32: 0 ISILON-MIB::protocolOpCount.'.smb2' = Gauge32: 0 ISILON-MIB::protocolOpCount.'.synciq' = Gauge32: 1 …… |
|
protocolOpCount |
The total number of operations for the protocol. |
||
|
protocolOpsPerSecond |
The number of operations per second for the last 5 second. |
||
|
inMinBytes |
The smallest input size in bytes of all operations for the protocol. |
||
|
inMaxBytes |
The largest input size in bytes of all operations for the protocol. |
||
|
inAvgBytes |
The average input size in bytes for all operations for the protocol. |
||
|
inStdDevBytes |
The standard deviation input size in bytes for all operations for the protocol. |
||
|
inBitsPerSecond |
The input rate (bits per second) for the protocol. |
||
|
outMinBytes |
The smallest output size in bytes of all operations for the protocol. |
||
|
outMaxBytes |
The largest output size in bytes of all operations for the protocol. |
||
|
outAvgBytes |
The average output size in bytes for all operations for the protocol. |
||
|
outStdDevBytes |
The standard deviation output size in bytes for all operations for the protocol. |
||
|
outBitsPerSecond |
The output rate (bits per second) for the protocol. |
||
|
latencyMin |
The minimum latency in microseconds for all operations for the protocol. |
||
|
latencyMax |
The maximum latency in microseconds for all operations for the protocol. |
||
|
latencyAverage |
The average latency in microseconds for all operations for the protocol. |
||
|
latencyStdDev |
The latency standard deviation in microseconds for all operations for the protocol. |
||
|
diskPerfTable |
diskPerfBay |
The bay that contains the disk. |
# snmpwalk -v2c -c I\$ilonpublic -m all localhost diskPerfTable ISILON-MIB::diskPerfBay.1 = INTEGER: 1 ISILON-MIB::diskPerfBay.2 = INTEGER: 2 ISILON-MIB::diskPerfBay.3 = INTEGER: 3 ISILON-MIB::diskPerfBay.4 = INTEGER: 4 ISILON-MIB::diskPerfBay.5 = INTEGER: 5 …… |
|
diskPerfDeviceName |
The device name for this disk. This value corresponds to the diskBay column in the diskTable. |
||
|
diskPerfOpsPerSecond |
The number of disk operations per second. |
||
|
diskPerfInBitsPerSecond |
The input rate (bits per second) into this disk. |
||
|
diskPerfOutBytesPerSecond |
The output rate (bits per second) from this disk. |
||
|
chassisTable |
chassisNumber |
A logical chassis number. |
# snmpwalk -v2c -c I\$ilonpublic -m all localhost chassisTable ISILON-MIB::chassisNumber.1 = INTEGER: 1 ISILON-MIB::chassisConfigNumber.1 = STRING: 400-0049-03 ISILON-MIB::chassisSerialNumber.1 = STRING: SX410-301448-0070 ISILON-MIB::chassisModel.1 = STRING: X410-4U-Dual-256GB-2x1GE-2x40GE SFP+-136TB-1638GB SSD ISILON-MIB::chassisUnitIDLEDOn.1 = INTEGER: na(-1) |
|
chassisConfigNumber |
The chassis configuration number. |
||
|
chassisSerialNumber |
The chassis serial number. |
||
|
chassisModel |
The chassis model name. |
||
|
chassisUnitIDLEDOn |
Indicates if the unit ID light on the chassis is lighted. This is the blue service light on the back of the chassis. A value of NA indicates that no Unit ID LED exists on the chassis. |
||
|
diskTable |
diskBay |
The bay that contains the disk. |
# snmpwalk -v2c -c I\$ilonpublic -m all localhost diskPerfTable ISILON-MIB::diskPerfBay.1 = INTEGER: 1 ISILON-MIB::diskPerfBay.2 = INTEGER: 2 ISILON-MIB::diskPerfBay.3 = INTEGER: 3 ISILON-MIB::diskPerfBay.4 = INTEGER: 4 ISILON-MIB::diskPerfBay.5 = INTEGER: 5 ISILON-MIB::diskPerfBay.6 = INTEGER: 6 ISILON-MIB::diskPerfBay.7 = INTEGER: 7 ISILON-MIB::diskPerfBay.8 = INTEGER: 8 ISILON-MIB::diskPerfBay.9 = INTEGER: 9 ISILON-MIB::diskPerfBay.10 = INTEGER: 10 ISILON-MIB::diskPerfBay.11 = INTEGER: 11 ISILON-MIB::diskPerfBay.12 = INTEGER: 12 ISILON-MIB::diskPerfBay.13 = INTEGER: 13 ISILON-MIB::diskPerfBay.14 = INTEGER: 14 ISILON-MIB::diskPerfBay.15 = INTEGER: 15 …… |
|
diskLogicalNumber |
The disk logical identification number. |
||
|
diskChassisNumber |
The chassis which contains the disk. |
||
|
diskDeviceName |
The device name for this disk. |
||
|
diskStatus |
The operational status of the disk. Gone drives are considered not part of /ifs. Commonly returned values include (but not limited to): HEALTHY - Drive is healthy L3 - Drive is being used for L3 caching DEAD - Drive is dead SMARTFAIL - Drive is smartfailed |
||
|
diskModel |
The manufacture and model name of the disk. |
||
|
diskSerialNumber |
The serial number of the disk. |
||
|
diskFirmwareVersion |
The firmware version installed on the disk. |
||
|
diskSizeBytes |
he size of the disk in bytes. |
||
|
fanTable |
fanNumber |
The unique identifer of the fan on this node. Note:Numbers may correspond to different fans on different hardware. |
# snmpwalk -v2c -c I\$ilonpublic -m all localhost fanTable ISILON-MIB::fanNumber.1 = INTEGER: 1 ISILON-MIB::fanNumber.2 = INTEGER: 2 ISILON-MIB::fanNumber.3 = INTEGER: 3 ISILON-MIB::fanNumber.4 = INTEGER: 4 …… |
|
fanName |
The name of the fan. |
||
|
fanDescription |
The description of the fan. |
||
|
fanSpeed |
The current speed of the fan in revolutions per minute. |
||
|
tempSensorTable |
tempSensorNumber |
The unique identifier of the sensor on this node. |
# snmpwalk -v2c -c I\$ilonpublic -m all localhost tempSensorTable ISILON-MIB::tempSensorNumber.1 = INTEGER: 1 ISILON-MIB::tempSensorNumber.2 = INTEGER: 2 …… |
|
tempSensorName |
The name of the temperature sensor. |
||
|
tempSensorDescription |
Description of the temperature sensor. |
||
|
tempSensorValue |
The current reading of the temperature sensor in degrees Celsius. |
||
|
powerSensorTable |
powerSensorNumber |
The unique identifier of the sensor on this node. |
# snmpwalk -v2c -c I\$ilonpublic -m all localhost powerSensorTable ISILON-MIB::powerSensorNumber.1 = INTEGER: 1 …… |
|
powerSensorName |
The name of the sensor. |
||
|
powerSensorDescription |
The description of the sensor. |
||
|
powerSensorValue |
The current reading of the sensor in volts or amps. |
Appendix B: Full list of SRS brevity
Table 11. Full list of SRS brevity
|
Event ID |
Event Description |
|
100010005 |
A SAS PHY topology problem or change was detected on {chas}, location {location} |
|
100010011 |
One or more drives (location(s) {location} / type(s) {media_type}) are not healthy. |
|
100010012 |
Drive Stall: Node {devid}, Location {location}, Type {media_type}, LNUM {disk}. OneFS is evaluating the drive's health. |
|
100010013 |
Disk sector error: {device} block {lba} |
|
100010025 |
Drive SMART status threshold exceeded. Location: {location}. |
|
100010032 |
A used drive from another cluster was inserted as a replacement. Node {devid}, Location {location}, Type {media_type}, LNUM {disk}. Follow the instructions in the {marketing_name} Drive Replacement Guide to resolve this issue. |
|
100010033 |
A used drive from another node (devid {other devid}) in this cluster was inserted as a replacement on this node (devid {devid}). Node {devid}, location {location}, type {media_type}. Follow the instructions in the {marketing_name} Drive Replacement Guide to resolve this issue. |
|
100010034 |
A FlexProtect job is in progress for the following drive. Node {devid}, location {location}, type {media_type}, LNUM {disk}. Preparing to add the drive to the filesystem. |
|
100010038 |
FlexProtect job in progress. The following drive was inserted into a bay that contained another drive that is smartfailing. Node {devid}, location {location}, type {media_type}, LNUM {disk}. Reinsert the drive that is smartfailing, or wait for the FlexProtect job to complete before inserting a new drive. |
|
100010041 |
Device {device} located at {location} is not a supported boot disk. Replace with a supported boot disk immediately. |
|
100010045 |
Excessive boot flash drive writing detected ({rate} GB/Day) |
|
100010050 |
Disk Repair Completed: The following sled contains a smartfailed drive. Chassis Serial Number {chassis_tla}, Node {devid}, Sled {bay_group}, Slot {slot}, Type {media_type}, LNUM {disk}. Do not remove the sled until notified by OneFS. |
|
100010056 |
The write-cache for the drive in the following location is enabled: Chassis Serial Number {chassis_tla}, Node {devid}, Sled {bay_group}, Slot {slot}, Type {media_type}, LNUM {disk}, Serial {drive_serial}. OneFS disabled the write-cache to comply with recommended drive settings. Replace the drive according to the instructions in the {marketing_name} Drive Replacement Guide. |
|
100020062 |
A fault was detected in sled {bay_group} of node {devid}. Something is wrong with the sled, and it must be replaced. Contact PowerScale Technical Support for assistance. |
|
200020012 |
Management Ethernet link {ifname} running below capacity |
|
200020025 |
backend network non-connectivity detected: {desc} |
|
400040002 |
SyncIQ policy {policy} failure |
|
400040005 |
SyncIQv1 unreplicated files in policy {policy} |
|
400040008 |
SyncIQv1 Error |
|
400040009 |
SyncIQ scheduler failed to start policy {policy} |
|
400040010 |
Error(s) in configuration for SyncIQ policy {policy} |
|
400040011 |
SyncIQ policy {policy} target version incompatible with source |
|
400040012 |
SyncIQ software configuration error |
|
400040014 |
SyncIQ failed to contact target cluster for policy {policy} |
|
400040015 |
SyncIQ failed to take a snapshot for policy {policy} |
|
400040016 |
SyncIQ policy {policy} detected a modified target file |
|
400040017 |
SyncIQ filesystem error running policy {policy} |
|
400040019 |
SyncIQ target association error for policy {policy} |
|
400040020 |
SyncIQ RPO exceeded for policy {policy} |
|
400040021 |
SyncIQ resolved WORM committed file conflicts for policy {policy} |
|
400040022 |
SyncIQ policy {policy} failed to establish an encrypted connection with target {target} |
|
400040023 |
SyncIQ service replication policy {policy} encountered an error while exporting service {service}: {message} |
|
400040024 |
SyncIQ detected unsupported WORM settings on the target for policy {policy} |
|
400040025 |
SyncIQ policy {policy} waiting for Cloudpools preparation of a stubbed LIN. |
|
400040026 |
Maximum file name length support differs between SynqIQ source and target cluster. |
|
400050004 |
Heartbeat Event |
|
400060004 |
AVScan Infected File Found |
|
400060101 |
No configured CEE/CAVA anti-virus servers |
|
400060108 |
File {filename} has been found infected by server {serv} |
|
400060109 |
The antivirus access zone is missing |
|
400060110 |
The antivirus IP Pool is missing or misconfigured: {reason} |
|
400070004 |
{license_type} Software license(s) will expire in {days_to_expiry} on {exp_date} |
|
400070005 |
{license_type} Software license(s) expired {days_since_expiry} ago on {exp_date} |
|
400090001 |
Monthly status |
|
400090003 |
ESRS is unconfigured |
|
400090004 |
ESRS is disconnected from the gateway |
|
400100001 |
Job state |
|
400100002 |
Job phase begins |
|
400100003 |
Job phase ends |
|
400100005 |
Job policy |
|
400100006 |
Job {job_type} failed to start as scheduled |
|
400100009 |
Job {job_type}[{job_id}]: One or more devids have been excluded from participating in this job: {excluded_participants} |
|
400100010 |
Job {job_type}[{job_id}]: Nodes which do not exist have been excluded from participating in this job: {missing_excluded_devids} |
|
400110001 |
Pid {pid} ({name}) was killed to free pages |
|
400130001 |
Mount request from {client} for {path} failed with error: {error} |
|
400130002 |
Mountd host lookup failed for {host} |
|
400140001 |
NFS identity query failed for {type}={name} |
|
400140002 |
NFS client {clientaddr} may have an inaccurate view of directory {dir} due to limitations of legacy 32-bit conversion. No way to safely translate readdirplus cookie {cookie} to 32bits. |
|
400140003 |
To use the NFSv3-over-RDMA feature, the cluster must have an RDMA-capable front-end Network Interface Card. |
|
400150010 |
Upgrade Drain Alert - unable to reboot node without potential client disruption |
|
400150011 |
Upgrade Drain Alert - expiry of timeout while waiting for clients to drain |
|
400160001 |
Audit CEE server {server} is unreachable. |
|
400170001 |
X.509 certificate {certid} is nearing expiration: {notafter}. |
|
400170002 |
X.509 certificate {certid} has expired. |
|
400180001 |
Inline dedupe allocation failed on node {lnn}, occurrence {occurrence} |
|
400180003 |
Inline dedupe allocation not supported on node {lnn}, occurrence {occurrence} |
|
400180004 |
Inline dedupe running degraded with smaller index on node {lnn}, occurrence {occurrence} |
|
400180005 |
Inline dedupe index has non standard layout on node {lnn}, occurrence {occurrence} |
|
400190001 |
Invalid dedupe directory {path} |
|
400240001 |
S3 identity query failed {type}={id} to name status={status}. |
|
400240002 |
S3 name query failed {type}={name} to name status={status}. |
|
400250000 |
Non-compatible user-specified patch {patch} found and ignored. |
|
500010001 |
SmartQuotas threshold violation in domain '{domain}': {enforcement}-{name} |
|
500010002 |
SmartQuotas notification for quota {name} for user {username} failed |
|
500010003 |
A SmartQuotas configuration error occurred in config file {file} |
|
500010004 |
A SmartQuotas internal error occurred |
|
500010005 |
SmartQuotas report generation failed for {quotareport} |
|
600010001 |
The snapshot daemon failed to create scheduled snapshot '{name}': error number {err} |
|
600010004 |
Snapshot daemon schedule policy config error: {err} |
|
700010001 |
The current time differs from the Windows Active Directory server by over {thresh} minutes. Authentication services may be affected. |
|
700010003 |
Windows time server {serv} could not be contacted. Cluster time not synchronized. |
|
700020001 |
Windows UID map range [{min}, {max}] is full with high-water mark {hwm} in access zone with ID {zid}. Authentication may fail until the range is increased. |
|
700020002 |
Windows GID map range [{min}, {max}] is full with high-water mark {hwm} in access zone with ID {zid}. Authentication may fail until the range is increased. |
|
700020003 |
Failed to parse user mapping rules in access zone with ID {zid} |
|
700030001 |
AD machine account missing |
|
700030002 |
The Active Directory domain {domain} is offline. Authentication services may be interrupted. |
|
700030003 |
Authentication Provider initialization failure |
|
700030004 |
Authentication Service unavailable |
|
700030005 |
AD server missing needed SPN(s) {spn}; try 'isi auth ads spn check {domain}' |
|
700030006 |
AD machine account invalid |
|
700040001 |
LDAP servers are offline. Authentication services may be interrupted. |
|
700050001 |
NIS servers are offline. Authentication services may be interrupted. |
|
700100001 |
Lwio Parameter Invalid |
|
900010000 |
Hardware Test Event: {id} {msg} |
|
900030023 |
CPU Throttling in chassis {chassis} slot {slot} |
|
900040035 |
CPU Throttling in chassis {chassis} slot {slot} |
|
900060026 |
CPU Throttling in chassis {chassis} slot {slot} |
|
900080035 |
CPU Throttling in chassis {chassis} slot {slot} |
|
900090025 |
CPU Throttling in chassis {chassis} slot {slot} |
|
900100010 |
NVRAM SoC firmware detected DMA execution failure in chassis {chassis} slot {slot} |
|
900100011 |
NVRAM SoC firmware detected DMA fetch failure in chassis {chassis} slot {slot} |
|
900100012 |
NVRAM interrupt (MSI) initialization failure in chassis {chassis} slot {slot} |
|
900100013 |
NVRAM DMA ring initialization failure in chassis {chassis} slot {slot} |
|
900100014 |
NVRAM DMA state machine entered error state in chassis {chassis} slot {slot} |
|
900100015 |
NVRAM DMA state machine entered readonly state in chassis {chassis} slot {slot} |
|
900100016 |
NVRAM DMA timeout failure in chassis {chassis} slot {slot} |
|
900100017 |
NVRAM SRAM correctable (single-bit) ECC error in chassis {chassis} slot {slot} |
|
900100026 |
NVRAM msi-x resources failure in chassis {chassis} slot {slot} |
|
900100027 |
NVRAM SoC PCIe link speed negotiation failure in chassis {chassis} slot {slot} |
|
900100029 |
NVDIMM has regained persistence in the chassis ({chassis}). The node will reboot to re-arm NVDIMM. |
|
900110001 |
CPU Throttling in chassis {chassis} slot {slot} |
|
900120001 |
CPU Throttling in chassis {chassis} slot {slot} |
|
900130001 |
CPU Throttling in chassis {chassis} slot {slot} |
|
900140001 |
{sensor} out of spec in chassis {chassis} slot {slot}. |
|
900140002 |
{sensor} out of spec in chassis {chassis} slot {slot}. |
|
900140003 |
{sensor} out of spec in chassis {chassis} slot {slot}. |
|
900140004 |
{sensor} out of spec in chassis {chassis} slot {slot}. |
|
900140005 |
{sensor} out of spec in chassis {chassis} slot {slot}. |
|
900160005 |
Adaptive cooling event detected |
|
900160020 |
Corrected Hardware Error |
|
900160024 |
A delayed reboot event has occurred in chassis {chassis} slot {slot}. The node may reset itself. Setting the node to read-only to protect the journal |
|
900160102 |
A (de)compression network interface card (NIC) reset has occurred in chassis {chassis} slot {slot} |
|
900170001 |
The IP address assigned to the BMC LAN interface by the DHCP server overlaps with a subnet already in use by the cluster's external network. The BMC LAN IP address will not be tracked and used in validation for the external interfaces. {msg} |
|
900170002 |
The system requires the following minimum firmware levels to support remote IPMI management. {msg} |
|
910100001 |
{sensor} out of spec in chassis {chassis} slot {slot}. |
|
910100003 |
{sensor} out of spec in chassis {chassis} slot {slot}. |
|
910100007 |
{sensor} out of spec in chassis {chassis} slot {slot}. |
|
920100000 |
{sensor} out of spec in chassis {chassis} slot {slot}. |
|
920100002 |
{sensor} out of spec in chassis {chassis} slot {slot}. |
|
920100003 |
{sensor} out of spec in chassis {chassis} slot {slot}. |
|
920100005 |
{sensor} out of spec in chassis {chassis} slot {slot}. |
|
920100006 |
{sensor} out of spec in chassis {chassis} slot {slot}. |
|
920100007 |
{sensor} out of spec in chassis {chassis} slot {slot}. |
|
920100008 |
{sensor} out of spec in chassis {chassis} slot {slot}. |
|
920100009 |
{sensor} out of spec in chassis {chassis} slot {slot}. |
|
930100000 |
{sensor} out of spec in chassis {chassis} slot {slot}. |
|
930100001 |
{sensor} out of spec in chassis {chassis} slot {slot}. |
|
930100002 |
{sensor} out of spec in chassis {chassis} slot {slot}. |
|
930100003 |
{sensor} out of spec in chassis {chassis} slot {slot}. |
|
930100004 |
{sensor} out of spec in chassis {chassis} slot {slot}. |
|
930100005 |
{sensor} out of spec in chassis {chassis} slot {slot}. |
|
930100006 |
{sensor} out of spec in chassis {chassis} slot {slot}. |
|
940100001 |
OneFS {version} is currently running and is not supported on this hardware: {msg}. |
|
940100002 |
OneFS {version} is currently running on unsupported nodes (devid(s) {devids}). {msg}. |
|
1100000001 |
Network connection failed. provider: {provider} devid: {devid} msg: {msg} |
|
1100000002 |
Authentication failure. provider: {provider} account: {account} msg: {msg} |
|
1100000003 |
Authorization failure. provider: {provider} account: {account} entitypath: {entitypath} file: {filename} offset: {offset} msg: {msg} |
|
1100000004 |
Bucket not found. provider: {provider} account: {account} entitypath: {entitypath} msg: {msg} |
|
1100000005 |
Object not found. provider: {provider} account: {account} entitypath: {entitypath} file: {file} offset: {offset} msg: {msg} |
|
1100000007 |
CloudPools no usable account found policyid:{policyid} cloudpoolid:{cloudpoolid} cloudpoolname:{cloudpoolname} clusterid:{clusterid} |
References
Dell Technologies documentation
The following Dell Technologies documentation provides other information related to this document. Access to these documents depends on your login credentials. If you do not have access to a document, contact your Dell Technologies representative.