Openshift Event Code: 1030NODE0001
Oversigt: Sustained high CPU utilization on a single control plane node, more CPU pressure is likely to cause a failover; increase available CPU.
Denne artikel gælder for
Denne artikel gælder ikke for
Denne artikel er ikke knyttet til et bestemt produkt.
Det er ikke alle produktversioner, der er identificeret i denne artikel.
Symptomer
Extreme CPU pressure can cause slow serialization and poor performance from the kube-apiserver and etcd. When this happens, there is a risk of clients seeing non-responsive API requests which are issued again causing even more CPU pressure.
It can also cause failing liveness probes due to slow etcd responsiveness on the backend. If one kube-apiserver fails under this condition, chances are you will experience a cascade as the remaining kube-apiservers are also under-provisioned.
It can also cause failing liveness probes due to slow etcd responsiveness on the backend. If one kube-apiserver fails under this condition, chances are you will experience a cascade as the remaining kube-apiservers are also under-provisioned.
Årsag
This alert is triggered when there is a sustained high CPU utilization on a single control plane node.
The urgency of this alert is determined by how long the node is sustaining high CPU usage:
The urgency of this alert is determined by how long CPU utilization across all three control plane nodes is higher than two control plane nodes can sustain.
The urgency of this alert is determined by how long the node is sustaining high CPU usage:
- Critical
- when CPU usage on an individual control plane node is greater than 90% for more than 1h.
- Warning
- when CPU usage on an individual control plane node is greater than 90% for more than 5m.
The urgency of this alert is determined by how long CPU utilization across all three control plane nodes is higher than two control plane nodes can sustain.
- Warning
- when CPU utilization across all three control plane nodes is higher than two control plane nodes can sustain for more than 10m.
Løsning
Diagnosis:
Execute the following PromQL queries on the OCP web console for the help of diagnosis (Observe → Metrics → Run queries).Top 5 of containers with the most CPU utilization on a particular node:
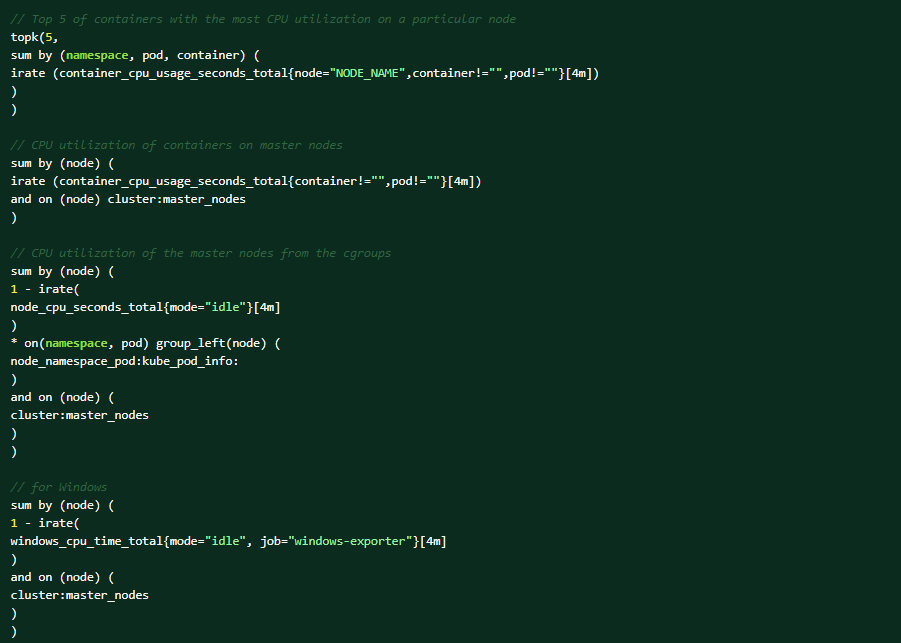
These are the conditions that could trigger the alert:
- there is a new workload that is generating more calls to the apiserver and causing high CPU usage. In this case, increase the CPU and memory on your control plane nodes.
- the alert is triggered based on the node metrics, so it could be that a component on the node is causing the high CPU usage.
- apiserver/etcd is processing more requests due to client retries that is being caused by an underlying condition.
- uneven distribution of requests to the apiserver instance(s) due to http2 (it multiplexes requests over a single TCP connection). The load balancers are not at application layer, and so does not understand http2.
Mitigation:
- if a workload is generating load to the apiserver that is causing high CPU usage, then increase the CPU and memory on your control plane nodes.
- If the sustained high CPU usage is due to a cluster degradation:
- find out the root cause of the degradation, and then determine the next steps accordingly.
Support:
If all the above steps cannot resolve the issue, contact the Dell EMC technical support for further investigation.
Flere oplysninger
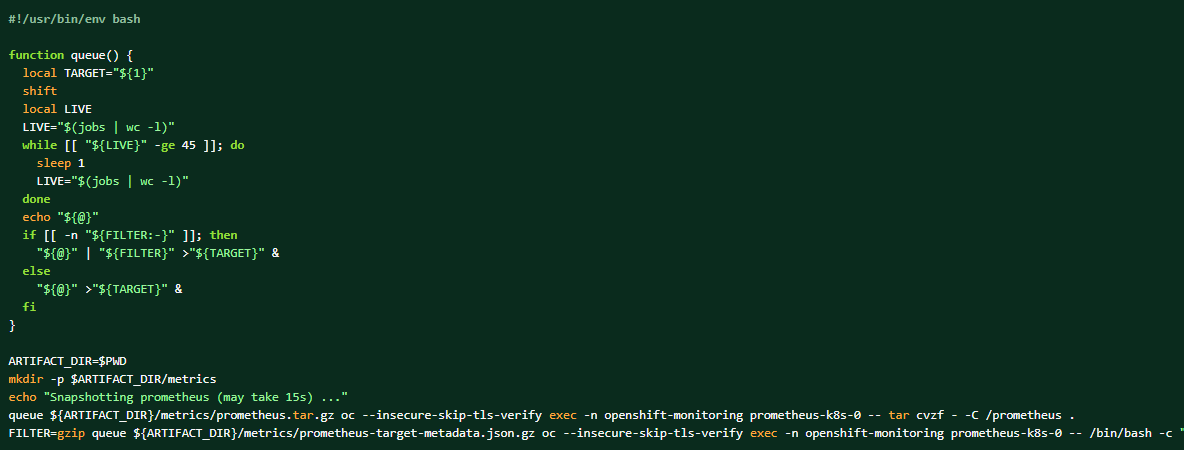
If the log bundle is collected, the Prometheus data can also be dumped as the complementing materials.
How to take a dump of the cluster prometheus data:
Berørte produkter
APEX Cloud Platform for Red Hat OpenShiftArtikelegenskaber
Artikelnummer: 000217405
Artikeltype: Solution
Senest ændret: 13 feb. 2026
Version: 3
Find svar på dine spørgsmål fra andre Dell-brugere
Supportservices
Kontrollér, om din enhed er dækket af supportservices.