PowerFlex 4.x Performance Charts Missing On Dashboard
Summary: The performance charts in PowerFlex Manager Platform (PFMP) are missing on the Dashboard.
Symptoms
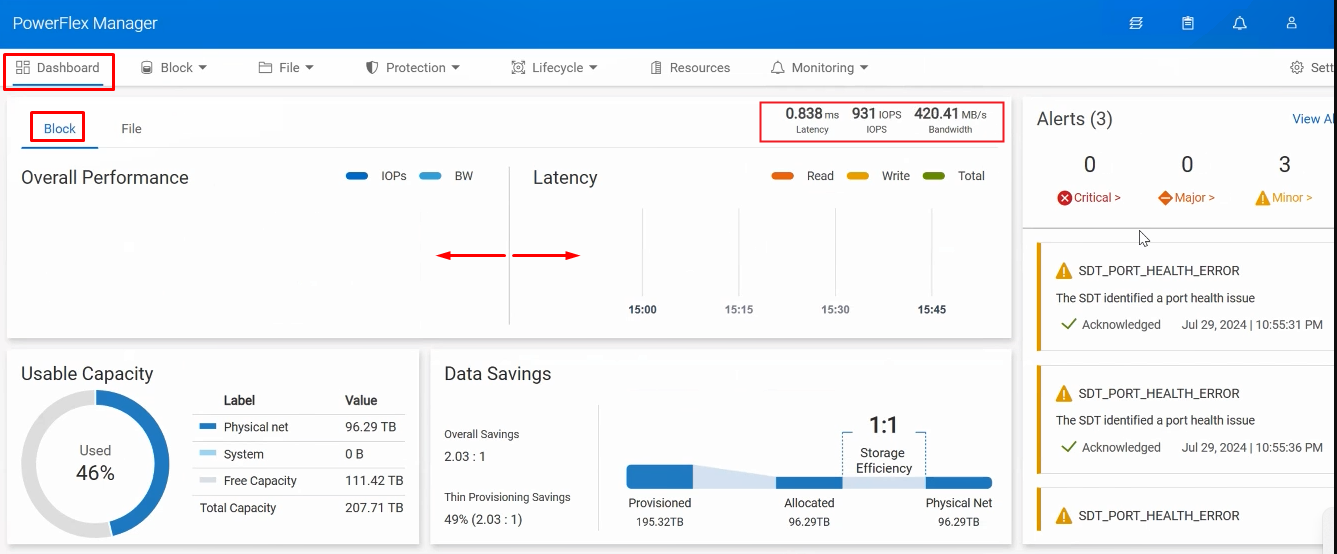
The Dashboard's 'Overall Performance' and 'Latency' are not getting populated. However, the Latency, IOPS, and Bandwidth values are populated with current details:
Impact
Performance metrics are not visible on the Dashboard, which prevents administrators from monitoring and analyzing system performance in real-time.
Cause
The PFMP UI logs events, transactions, and other data points (in the web browser) with timestamps based on the OS's time zone. If the time zone is incorrect, timestamps may appear as if they happened in the future or the past, even though they were logged in real-time. This can lead to inconsistencies in data accuracy, particularly in chronological reports or history logs that rely on accurate timing.
See similar issue in the following KB - https://www.dell.com/support/kbdoc/000247171
Resolution
- On the web browser, click F12 to open Chrome's web developer tools screen.
- Click the console tab and run the following command:
Date.now()
- Next, search for an epoch time converter online, such as https://www.epochconverter.com, and convert the timestamp into GMT:
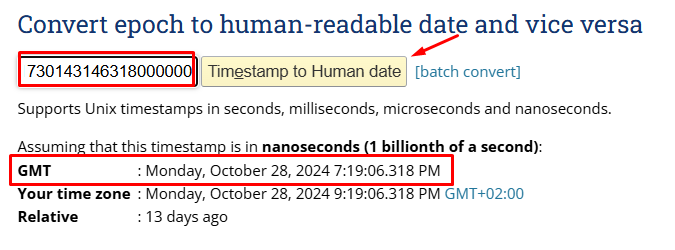
- Compare the converted GMT time to the time on the OS host. It is expected to vary.
- The time on the OS must be corrected, and then the UI is supposed to populate the charts as expected.
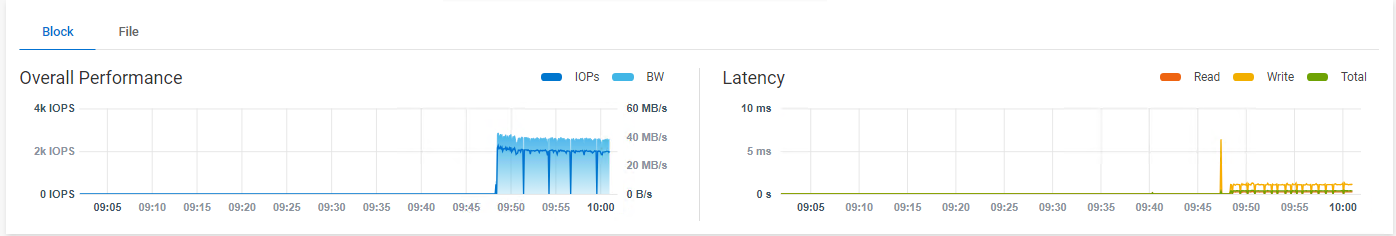
Below is an example of how the expected performance metrics should appear on the dashboard:
Impacted Version
PFMP 4.x
Fixed In Version
N/A - Working as expected