VPLEX: Troubleshooting VPLEX Performance Monitor VM (VPM) deployment and use
摘要: Information to help in troubleshooting the deployment and configuration of the VPLEX Performance Monitor tool.
本文适用于
本文不适用于
本文并非针对某种特定的产品。
本文并非包含所有产品版本。
说明
Note: The Virtual Performance Monitor (VPM) tool is only supported at 5.5.x code versions. VPM is no longer being actively developed. The replacement is the free EMC M&R product (a.k.a. ViPR SRM Suite lite): https://www.dell.com/support/home/en-us/product-support/product/emc-storage-monitoring-and-reporting/overview
VPLEX Performance Monitor is a virtual appliance which can be downloaded from support.emc.com and deployed in a customers VMware environment in order to collect performance stats from a VPLEX instance.
It comes in the form of an OVA file which can be imported into a VMware environment as a virtual appliance (vm).
Once installed on an ESXi host, you can log in to the VM using the following accounts:
SSH and CLI login accounts:
root with password root
appadmin with password appadmin
VPLEX Performance Monitor Web login account:
admin with password admin (you will be prompted to change the password on the first login using the admin account)
If you are unsuccessful in getting access to the url (https://ip address of vm), you can do the following:
-
From Vcenter, you can connect to the VM console and verify that it has acquired an IP address
The login screen looks like this:
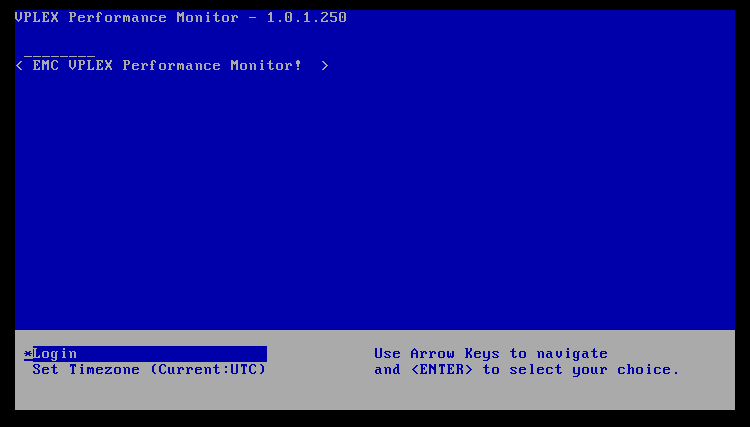
-
Press ENTER to choose to log in. Enter root or appadmin account details to log in.
-
Run the following command to check IP address
/sbin/ifconfig
localhost:~ # /sbin/ifconfig
eth0      Link encap:Ethernet  HWaddr 00:0C:29:92:DC:76
          inet addr:99.99.88.88  Bcast:99.99.99.255  Mask:255.255.254.0
          inet6 addr: fegg::20c:29ff:fexx:dcyy/64 Scope:Link
          UP BROADCAST RUNNING MULTICAST  MTU:1500  Metric:1
          RX packets:26686 errors:0 dropped:0 overruns:0 frame:0
          TX packets:3855 errors:0 dropped:0 overruns:0 carrier:0
          collisions:0 txqueuelen:1000
          RX bytes:2619404 (2.4 Mb)  TX bytes:2583355 (2.4 Mb)
The output should show that eth0 has a valid IP address assigned.
-
You should now be able to ping and SSH to the vm IP address from your VPLEX management server.
If you cannot do this, you must engage your network team to determine why there is no route available between the relevant subnets.
If you can ping the vm but are still unable to connect to the web interface over "https://ip address," ensure that port 8443 is accessible. -
On the VPLEX Performance Monitor vm (over Vcenter or you can ssh to the vm IP address) command line, you can run the following command:
netstat -apn | grep 8443
You should see Tcp process's "Listening" for incoming connections on port 8443localhost:~ # netstat -apn |grep 8443 tcp 0 0 0.0.0.0:8443 0.0.0.0:* LISTEN 2448/node
If you do not see any listening process's, try to reboot the VM using the command
/sbin/shutdown -r now
If a reboot does not resolve the issue, it may be necessary to remove the vm and redeploy it using the OVA file. -
On the VPLEX management server you can run the following command to check the availability of tcp port 8443:
telnet 99.99.88.88 8443
Trying 99.99.99.72...
Connected to 99.99.88.88.
Escape character is '^]'.
If tcp port 8443 is open, it shows a connected status.
If you get the response "Connection refused," it means that there is something on the network blocking the tcp port (for example, a firewall)
The customer must check with their own network team to determine what might be blocking the port.
The VPLEX Performance Monitor tool has the following VPLEX GeoSynchrony requirements:
VPLEX GeoSynchrony version on the VPLEX, to be monitored, should be at least 5.5.
The Management Server (SMS2) version must be a minimum of D27.0.0.17.0.
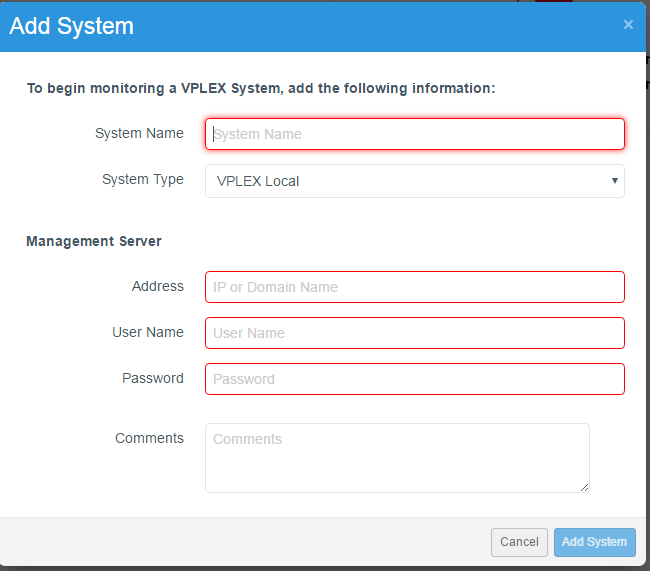
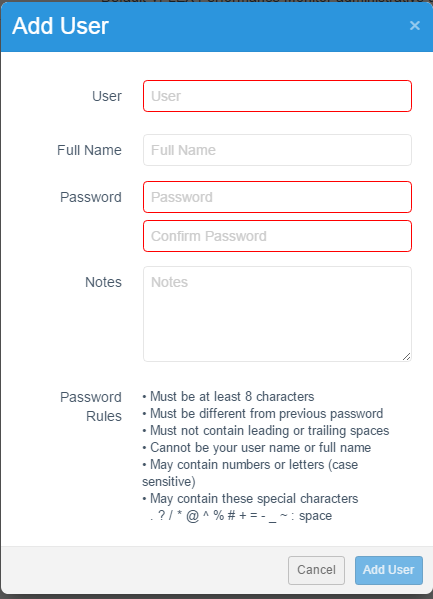
Once connectivity has been established over a browser, you can then configure additional login accounts and add the systems that you want the VPLEX Performance Monitor (VPM) to monitor.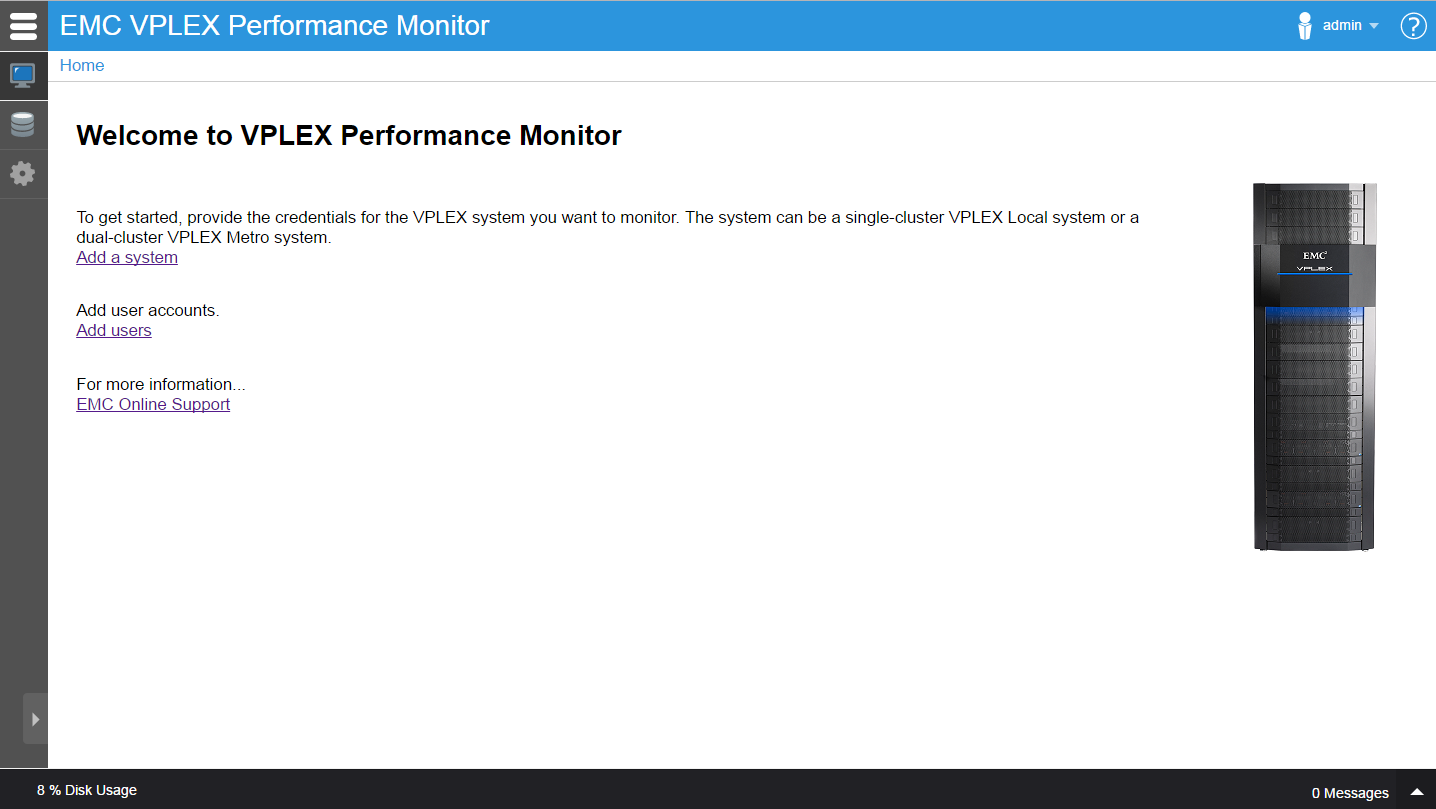
其他信息
See the relevant release notes for additional information.
受影响的产品
VPLEX文章属性
文章编号: 000018938
文章类型: How To
上次修改时间: 29 7月 2025
版本: 4
从其他戴尔用户那里查找问题的答案
支持服务
检查您的设备是否在支持服务涵盖的范围内。