Break Through Workload Performance Boundaries with Microsoft Azure Stack HCI
Overview
Business challenge
Solution overview
Audience
We value your feedback
Sizing an Azure Stack HCI solution
Sizing process
Before exploring the lab environment and performance testing results, we will first review the process of selecting and sizing an optimized cluster configuration. Dell Integrated System for Microsoft Azure Stack HCI offers a broad range of validated AX node and network topologies to meet the requirements of nearly any use case and workload. Example scenarios include the following:
- For small Remote Branch Offices (ROBO), we may recommend a cluster with two AX nodes using lower core count processors, modest amounts of RAM, all-flash storage, and a switchless storage network topology.
- For applications with significant storage capacity and expansion requirements, we may suggest a two-tier, hybrid storage configuration, and scalable networking topology.
- For the most demanding workloads in the industry, we often select processors with the highest number of cores and fastest clock speeds, large memory footprints, NVMe drives, and 100 GbE RDMA networking.
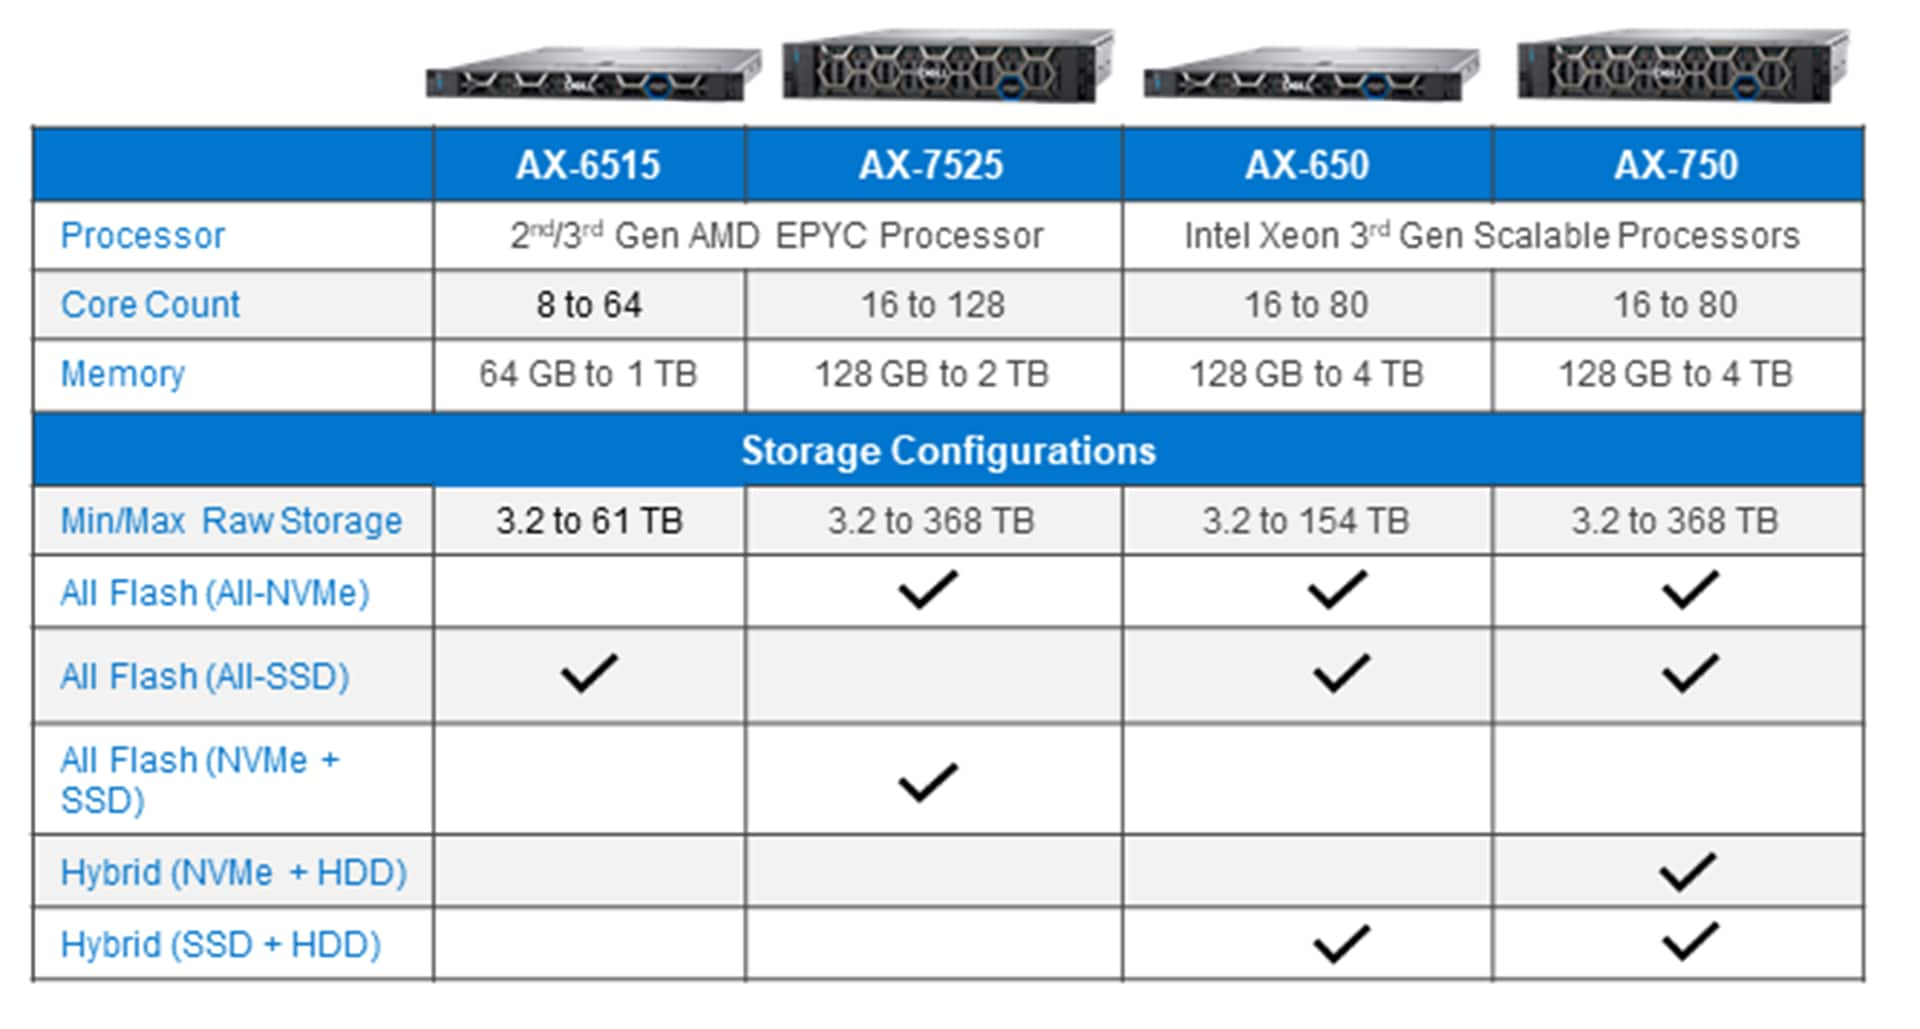
The following figure illustrates our specification sheet at a glance. It depicts the component combinations in our four AX node models.
Live Optics
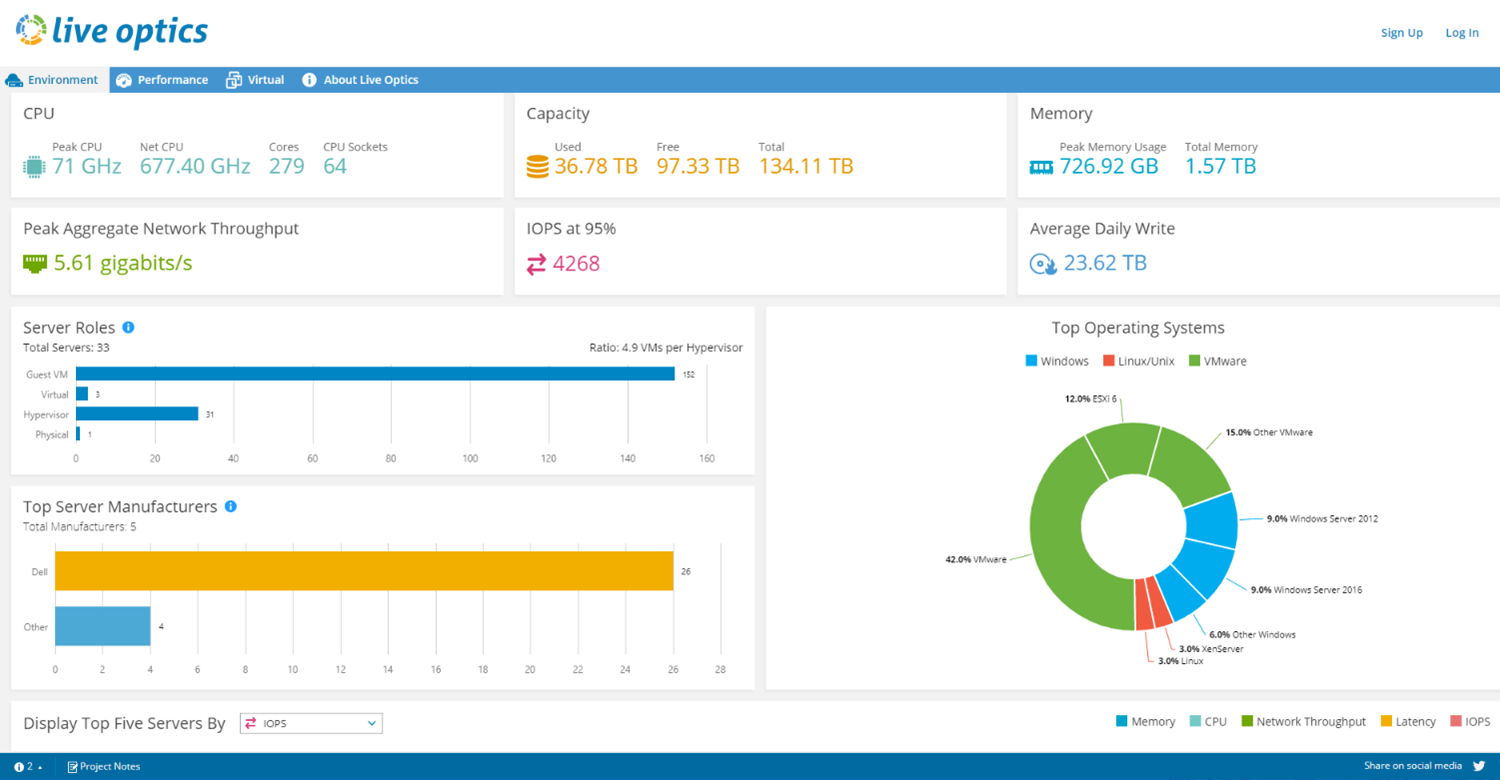
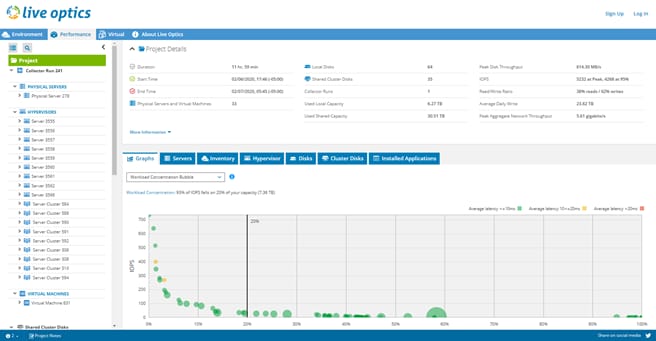
Dell Technologies follows a consultative and systematic approach to helping IT professionals modernize their infrastructure. Before recommending any configurations like those mentioned above, we begin with a thorough analysis of currently running workloads. Dell Live Optics is an industry-standard method of impartially documenting server and storage configuration and performance. By recording and exploring the current state of IT environments, we can help accelerate informed decisions and reduce the risk of under or overprovisioning the infrastructure.
An in-depth discussion of Live Optics is beyond the scope of this white paper. From a high-level, customers first engage with their Dell Technologies account team to have an account created on the Live Optics portal. Then they download and run the Optical Prime data collector software to capture inventory and performance insights from current hosts and VMs. Collectors can run from four hours to seven days, in offline or online mode, to create a local file of the results or stream the data securely to the associated online viewer profile. When data collection is complete, Live Optics visualizes the data using various rich reports available in the portal, such as the examples depicted in the following figures.
Azure Stack HCI Sizer Tool
Lab performance testing results
Testing results overview
Test lab setup
Figure 4 shows the cluster's physical networking as built in the lab. We set up a scalable, fully converged network topology with management, VM, and RDMA storage traffic traversing two 100 GbE Mellanox CX-6 adapter ports. With this topology, Data Center Bridging (DCB) configuration was required on the S5232F-ON ToR switches. We also required Quality of Service (QoS) configuration in the host operating system. Figure 5 shows the virtual network configuration on the host operating system using Switch Embedded Teaming (SET).
Ancillary services that are required for cluster operations such as Active Directory, DNS, and a file server or cloud-based witness are outside the scope of this white paper. For information about all the steps that are required to deploy this cluster, see our Deployment Guide and Network Integration and Host Network Configuration Options Guide.
Note: Out of band (OOB) connections from the iDRACs to a management switch are not in the figure.
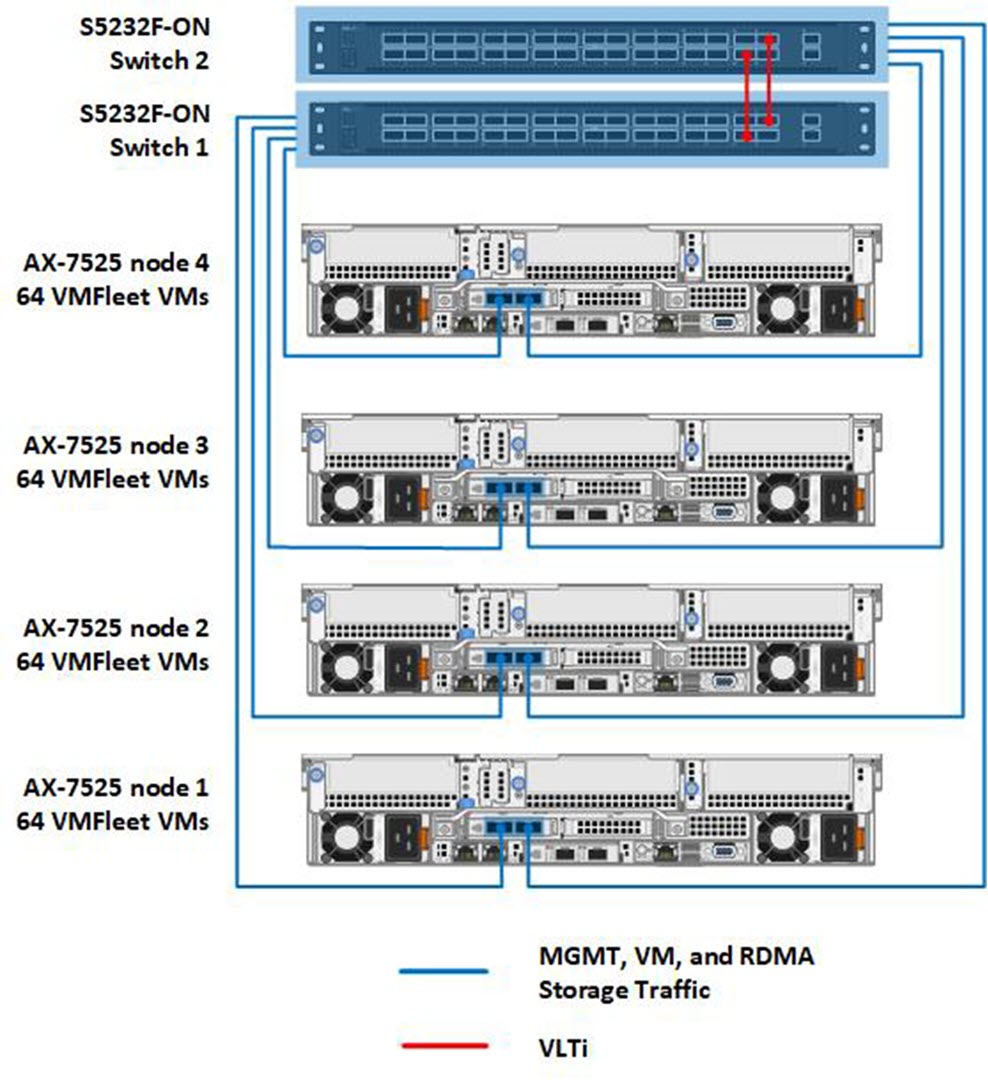
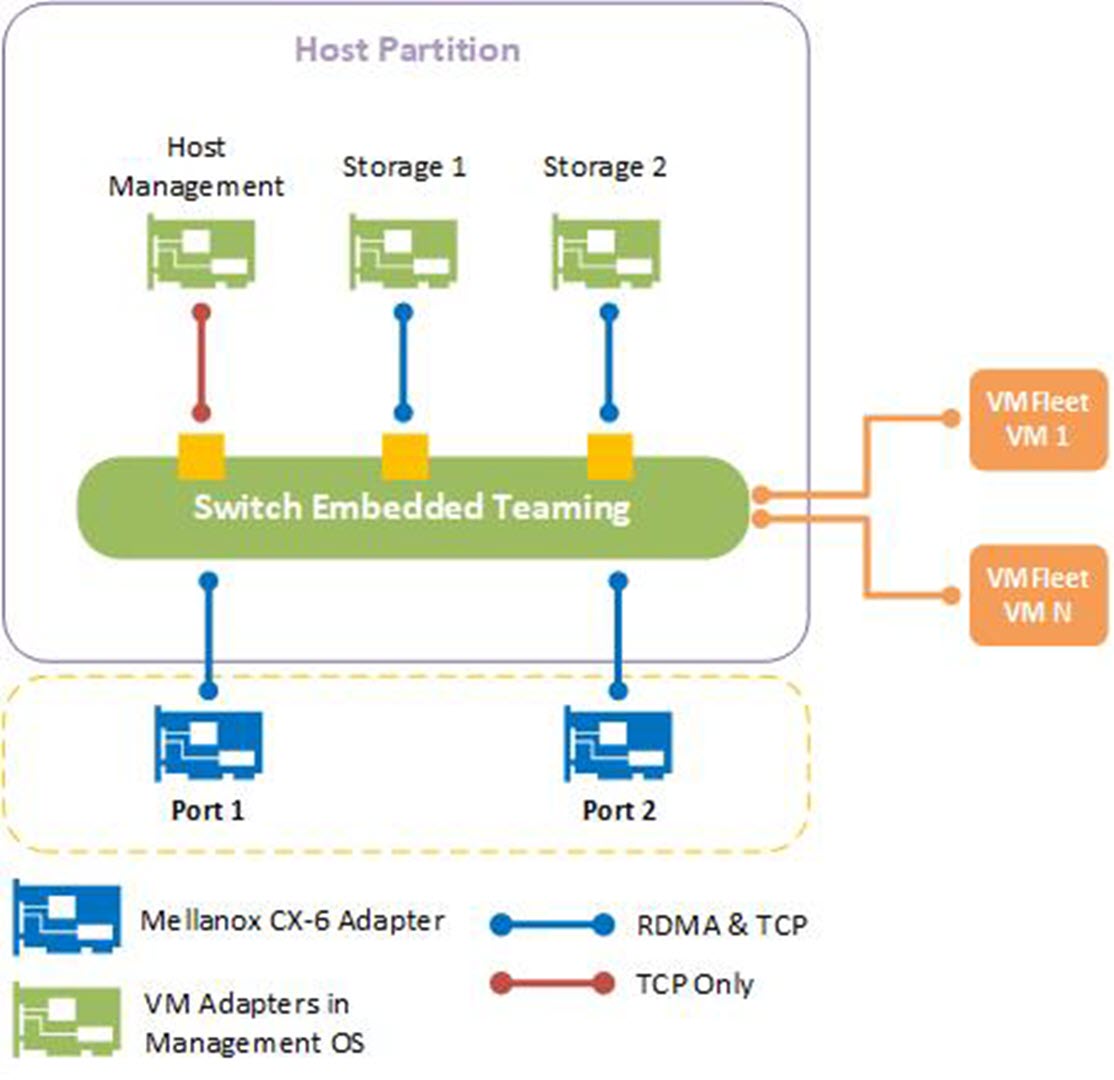
The following two tables provide additional detail about the cluster configuration and AX-7525 specifications as built in the lab. We chose the three-way mirror resiliency type for the volumes we created with VMFleet because of its superior performance compared to erasure coding options in Storage Spaces Direct. The raw storage capacity of the cluster was a little over 150 TB. This resulted in just under 50 TB of usable storage capacity due to three-way mirroring's capacity efficiency of 33 percent. Microsoft and Dell Technologies also recommend leaving reserve capacity equivalent to the capacity of one drive per server.
| Cluster design elements | Description |
| Cluster node model | AX-7525 |
| Number of cluster nodes | 4 |
| Network switch model | Dell PowerSwitch S5232F-ON featuring 32 x 100 GbE QSFP28 ports |
| Number of ToR network switches | 2 |
| Network topology | Fully converged network configuration |
| Volume resiliency | Three-way mirror |
| Usable storage capacity | Approximately 50 TB |
| Resources per cluster node | Description |
| CPU | Dual-socket AMD EPYC 7742 64-Core Processor |
| Memory | 1 TB 3200 MHz DDR4 RAM |
| Storage controller for operating system | BOSS-S1 adapter card |
| Physical drives for operating system | 2 x M.2 480 GB SATA drives configured as RAID 1 |
| Physical drives for Storage Spaces Direct | 24 NVMe drives (PCIe Gen 4) |
| Network adapter for management, VM, and storage traffic | 1 x Mellanox ConnectX-6 DX Dual Port 40/100 GbE QSFP56 Adapter |
| Operating system | Microsoft Azure Stack HCI, version 20H2 |
VMFleet testing results
We ran the VMFleet tests under the following conditions:
- Healthy cluster running 64 VMs per node
- Healthy cluster running 32 VMs per node
- Degraded cluster with one node failed
- Degraded cluster with two nodes failed
Healthy cluster running 64 VMs per node
The following table presents the range of VMFleet and DISKSPD parameters that were used during our testing of the cluster in optimal health and running 64 VMFleet VMs per node.
| VMFleet and DISKSPD parameters | Values |
| Number of VMs running per node | 64 |
| vCPUs per VM | 2 |
| Memory per VM | 4 GB |
| VHDX size per VM | 40 GB |
| VM operating system | Windows Server 2019 |
| Data file size used in DISKSPD | 10 GB |
| Cluster Shared Volume (CSV) in-memory read cache size | 0 |
| Block sizes | 4-512 KB |
| Thread counts | 1-2 |
| Outstanding I/Os | 2-32 |
| Write percentages | 0-100 |
| I/O patterns | Random, Sequential |
We first selected DISKSPD I/O profiles that are aimed at identifying the maximum IOPS and throughput thresholds of the cluster. By pushing the limits of the storage subsystem, we confirmed that the networking, compute, operating systems, and virtualization layer were configured correctly according to our Deployment Guide and Network Integration and Host Network Configuration Options guide. This also ensured that no misconfiguration occurred during initial deployment that could skew the results of I/O profiles that are more representative of real-world workloads. Our results are depicted in the following table.
| I/O profile | Parameter values explained | Performance metrics |
| B4-T2-O32-W0-PR | Block size: 4k
Thread count: 2 Write percentage: 0% |
IOPS: 5,727,985
Read latency: 1.3 milliseconds |
| B4-T2-O16-W100-PR | Block size: 4k
Thread count: 2 |
IOPS: 700,256
Write latency: 9 milliseconds |
| B512-T1-O8-W0-PSI | Block size: 512k
Thread count: 1 |
Throughput: 105 GB/s |
| B512-T1-O1-W100-PSI | Block size: 512k
Thread count: 1 |
Throughput: 8 GB/s |
Healthy cluster running 32 VMs per node
To prepare for the other three test scenarios, we redeployed VMFleet with 32 VMs running per node. We then stressed the storage subsystem using I/O profiles more reflective of the types of demanding workloads that are found in the modern enterprise. These applications had smaller block sizes, random I/O patterns, and various read/write ratios.
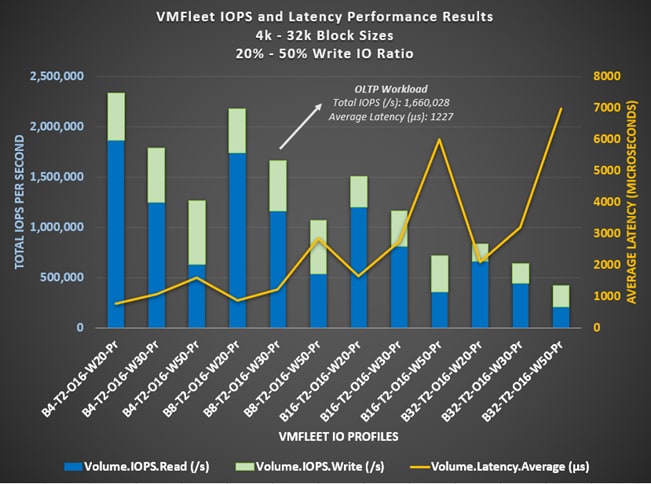
The 8 KB block size and 30 percent random write I/O profile is typical of an Online Transactional Processing (OLTP) workload. We observed VMFleet driving over 1.6 million IOPS at slightly over 1-millisecond average latency with this I/O profile, indicating that the cluster has the potential to accelerate OLTP workloads and improve end-user response time to database applications. Even increasing the block size to 32 KB and increasing the write I/O to 50 percent produces over 400,000 IOPS at under 7-millisecond latency.
The following figure depicts the results of this workload testing.
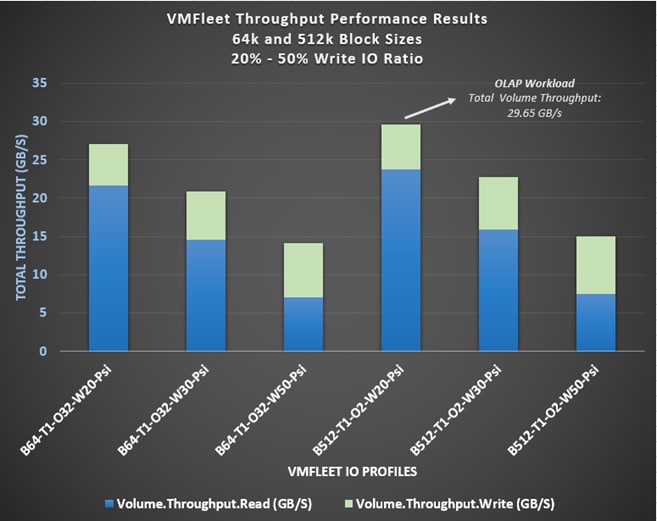
Online Analytical Processing (OLAP) workloads focus on retrieval and analysis of large datasets. We selected larger block sizes and sequential I/O patterns to test workloads in this category. Throughput became the key performance indicator to analyze. The results that are shown in the following figure indicate an impressive sustained throughput that can greatly benefit this category of OLAP workloads. Other types of IT services that could benefit include file and application backups and streaming video.
Testing results on a degraded cluster
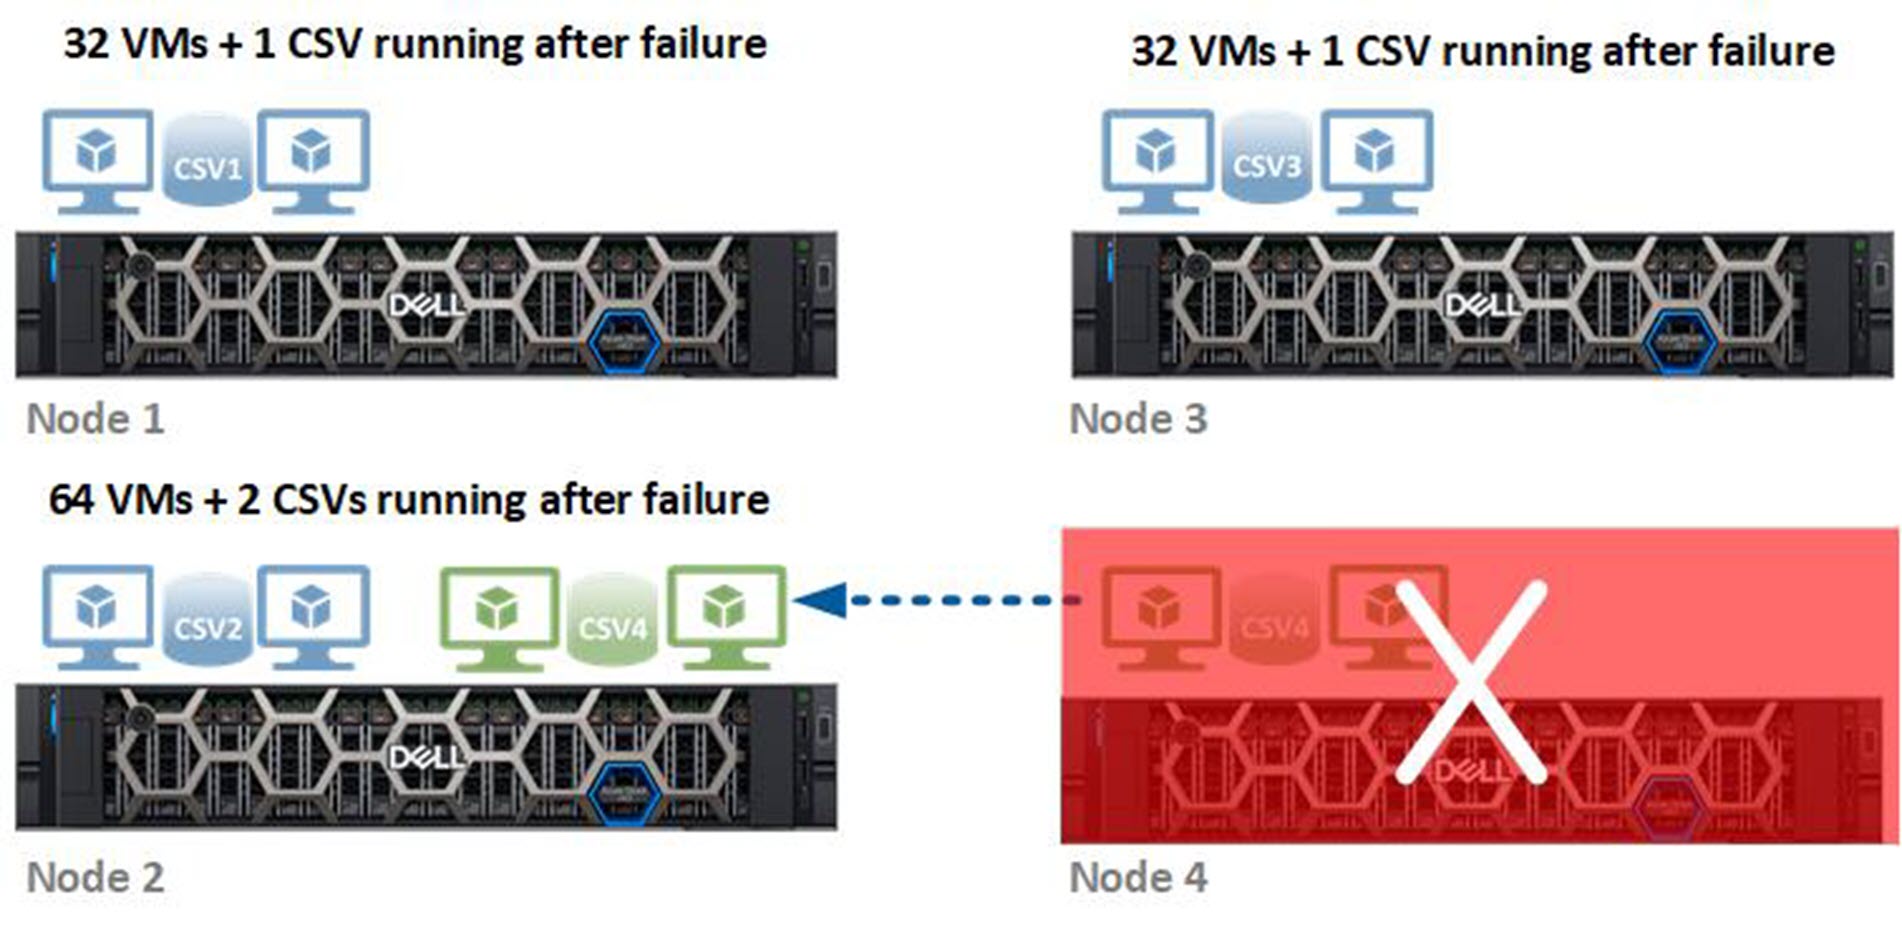
We simulated two different failure scenarios on the healthy cluster running 32 VMs per node. In the first scenario, which is depicted in the following figure, we shut down one node, which had the following impact:
- The cluster moved the CSV owned by Node 4 to Node 2. Node 2 became the new owner of that CSV.
- We live-migrated the failed VMs to Node 2 to ensure they were running on the same host that owned the CSV containing their virtual disks.
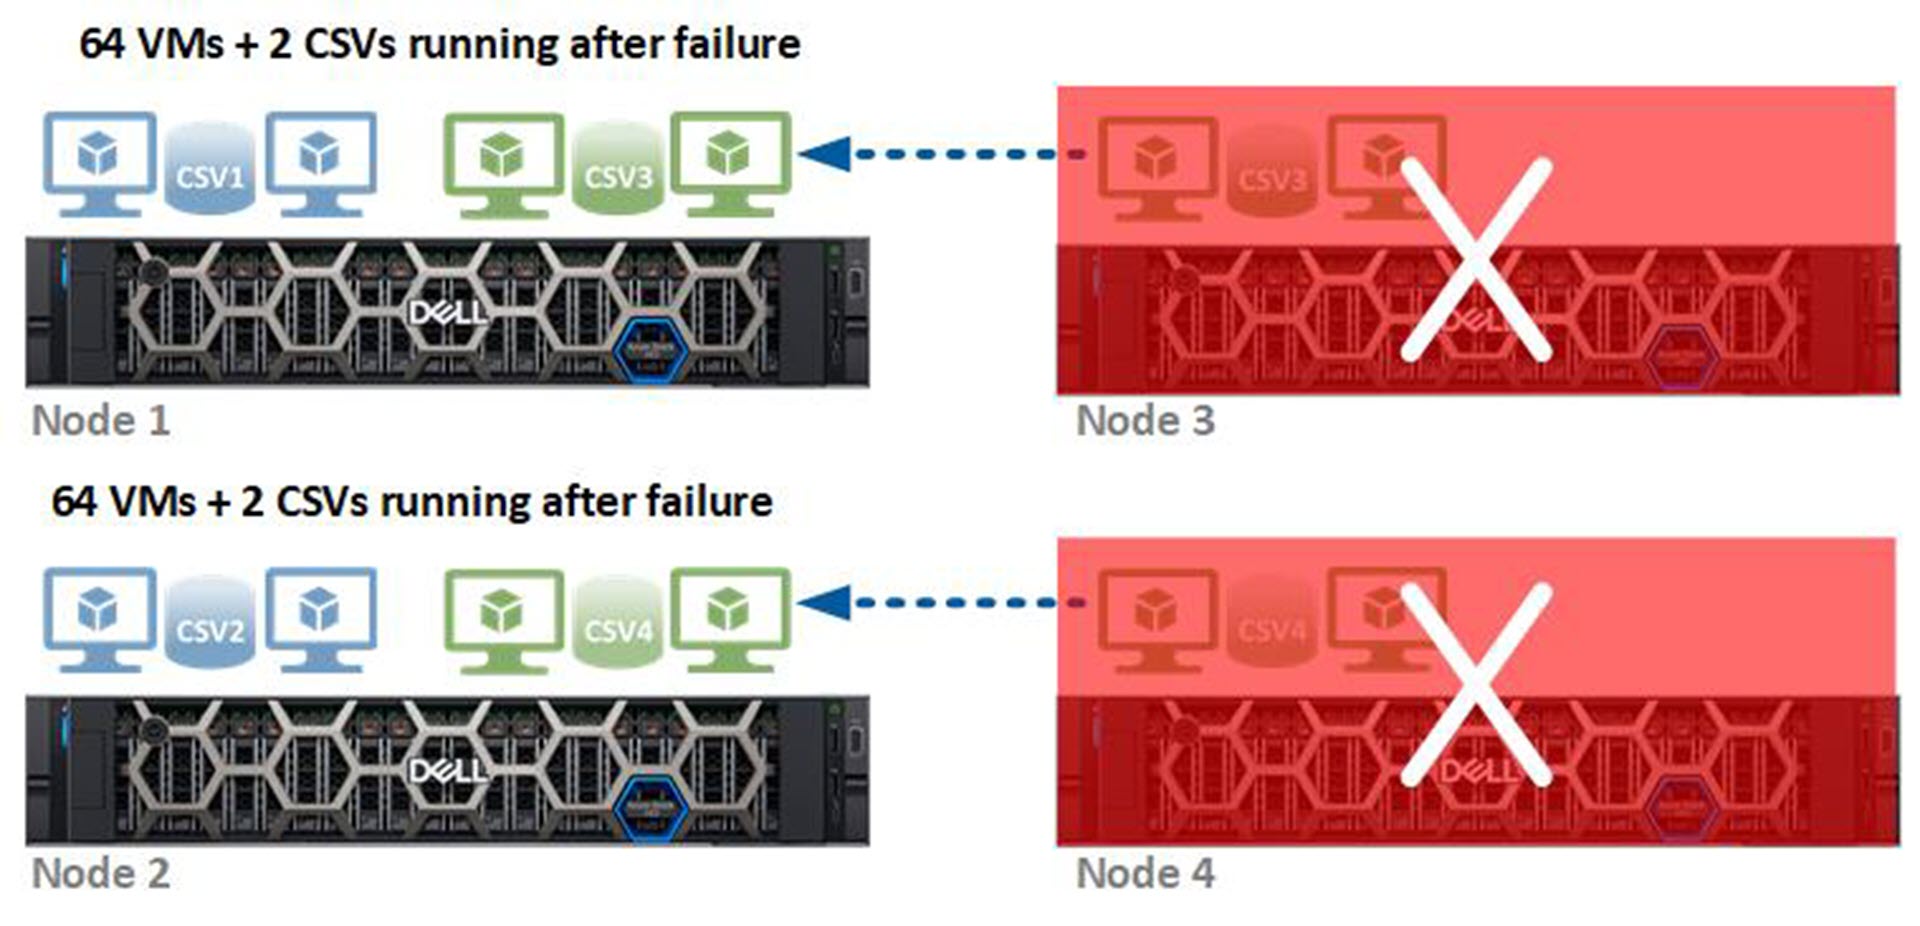
In the second scenario, which is depicted in the following figure, we shut down two nodes, which had the following impact:
- The cluster moved the CSVs owned by Nodes 3 and 4 to Nodes 1 and 2, respectively. Nodes 1 and 2 became the new owners of these volumes.
- We live-migrated the failed VMs to Nodes 1 and 2, ensuring that all VMs were running on the host that owned the CSV containing their virtual disks.
According to the VMFleet test results, we continued to see outstanding performance even with the cluster in a degraded state. This allows system administrators extra time to recover from node failures without negatively impacting the end-user response times of their most critical applications. The following table compares the testing scenarios using the I/O profiles that are aimed at identifying the maximum thresholds.
| I/O profiles | Healthy cluster | One-node failure | Two-node failure |
| B4-T2-O32-W0-PR | IOPS: 4,856,796
Read latency: 378 microseconds |
IOPS: 4,390,717
Read latency: 380 microseconds |
IOPS: 3,842,997
Read latency: 262 microseconds |
| B4-T2-O16-W100-PR | IOPS: 753,886
Write latency: 3.2 milliseconds |
IOPS: 482,715
Write latency: 5.7 milliseconds |
IOPS: 330,176
Write latency: 11.4 milliseconds |
| B512-T1-O8-W0-PSI | Throughput: 91 GB/s | Throughput: 113 GB/s | Throughput: 77 GB/s |
| B512-T1-O1-W100-PSI | Throughput: 8 GB/s | Throughput: 6 GB/s | Throughput: 10 GB/s |
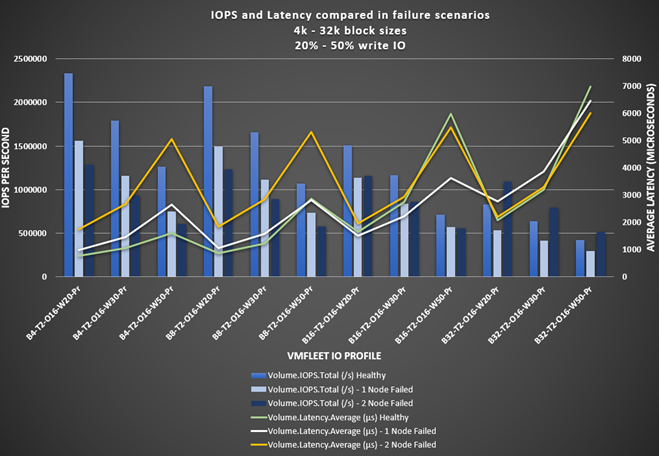
The following figure shows the IOPS and latency results from the VMFleet tests. These tests used I/O profiles that are more representative of real-world applications with smaller block sizes, random I/O patterns, and various read/write ratios. Notice that IOPS decrease and latency increases for the 4k and 8k block sizes, as one would expect. With the 32k block size, we observed the following behavior:
- Latency is less variable across the failure scenarios. We found an 8 percent decrease in latency after the single-node failure and a 14 percent decrease in latency after the two-node failure. This was primarily because write I/O did not need to be committed across as many nodes in the cluster. After the single-node failure, we observed that the network traffic between nodes decreased by more than 3 Gbps per node.
- IOPS increased by 20 to 30 percent after the two-node failure, depending on the percentage of writes in the I/O profile. There were two reasons for this behavior:
- The 3-way mirrored volumes running on the healthy cluster became 2-way mirrored volumes running on the two remaining online nodes. With 33 percent fewer backend drive write IOPS, the overall drive write latency decreased, which drove higher read and write IOPS. However, this is only in cases when CPU was not the bottleneck.
- Each of the two nodes remaining online were running double the VMs for a total of 64 VMs per node. The more VMs running on a virtualized host, the greater the potential for higher IOPS.
Note: After shutting down the nodes in the failure scenarios, we live-migrated the VMs to the same nodes that owned the CSVs hosting their virtual disks to avoid any I/O redirection, which would negatively affect performance.
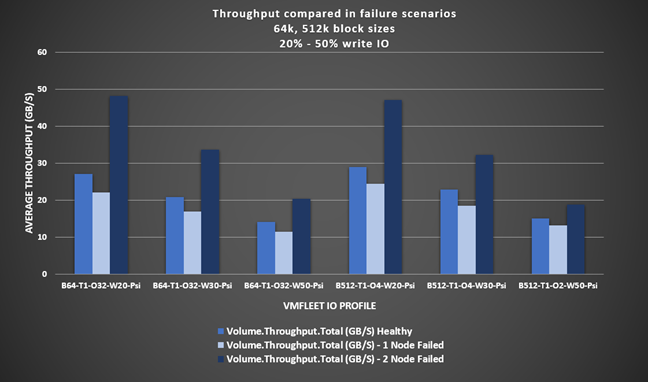
The following figure shows the throughput results from the VMFleet tests using I/O profiles with larger block sizes and sequential I/O patterns. Throughput decreased an average of 17 percent after the single-node failure. However, throughput increased by an average of 52 percent after the two-node failure for the same reasons as applied to Figure 10.
- The 3-way mirrored volumes running on the healthy cluster became 2-way mirrored volumes running on the two remaining online nodes. With 33 percent less backend drive write throughput, the overall drive write latency decreased, which drove higher read and write throughput. However, this is only in cases when CPU was not the bottleneck.
- Each of the two nodes remaining online were running double the VMs for a total of 64 VMs per node. The more VMs running on a virtualized host, the greater the potential for higher throughput.
Extrapolating these results - special considerations
Maintaining peak performance on Azure Stack HCI
Monitoring and maintenance overview
Specialized expertise
Life Cycle Management
Life Cycle Management (LCM) is a priority for every IT operations team. LCM is especially critical for Azure Stack HCI clusters running an organization's most resource-intensive, mission-critical workloads. This practice ensures that systems run at peak performance and availability, maintain a sound security posture, and benefit from newly released features and functionality.
Dell OpenManage Integration with Microsoft Windows Admin Center makes the update process automated, repeatable, and predictable. The OpenManage Integration extension includes a specialized snap-in to Microsoft's Cluster-Aware Updating extension. This innovative collaboration between Microsoft and Dell Technologies creates a single-click full stack update experience. A simple Windows Admin Center workflow orchestrates Azure Stack HCI operating system and AX node BIOS, firmware, and driver updates, requiring only a single reboot per node and resulting in no impact to running workloads in the VMs. The following figure depicts the initial steps in the updates workflow that check for AX node authenticity, correct licensing, and hardware symmetry.
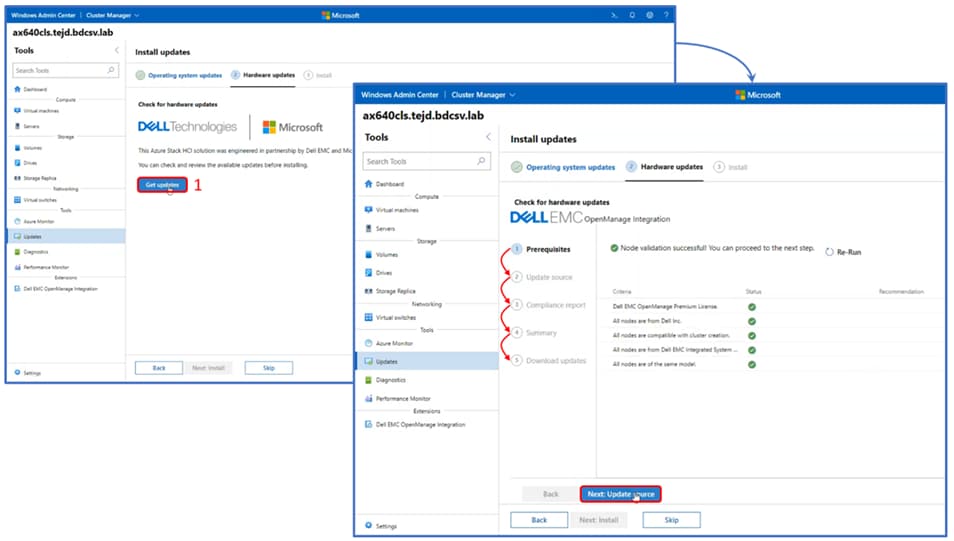
For a detailed technical walkthrough of the full stack life cycle management with the Cluster-Aware Updating workflow in Windows Admin Center, see the OpenManage Integration Technical Walkthrough blog.
Monitoring with Microsoft Azure services
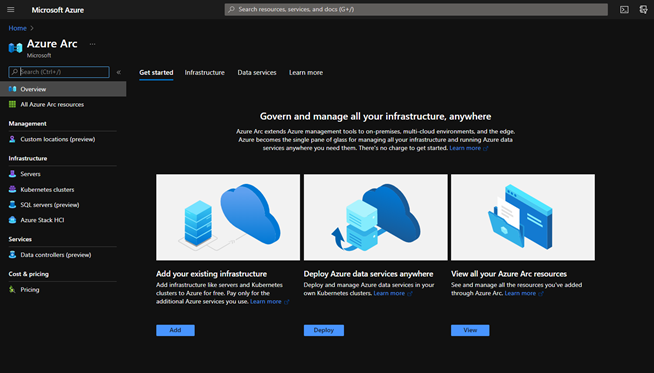
It is also critical to monitor a high-performing cluster to ensure it is meeting SLAs. Windows Admin Center with the Dell OpenManage Integration extension provides local hardware and software monitoring in-band and agent-free. Since Azure Stack HCI is a service in Microsoft Azure, administrators can also take advantage of native integration with a host of Azure management and governance services such as Azure Monitor, Azure Security Center, and Azure Policy. This native integration is made possible in large part by Azure Arc.
Azure Arc enables administrators to simplify the management and governance of their on-premises workloads by projecting existing resources into Azure Resource Manager. Once onboarded to Azure Arc, VMs, Kubernetes clusters, and databases can be monitored and managed with the same familiar tools that are used for Azure resources. Tools include the Azure Portal and programmatic means such as PowerShell, Azure CLI, and the REST API.