DELLQUINN: A Machine Learning-Based, Resource Capacity Optimization Solution
Introduction
Executive summary
Business challenge
Dell Technologies caters to 72 countries. The Field Services division of Dell works with all retail and enterprise clients requiring on-premises support. With a high volume of incoming requests spanning across several product lines, FSEs resolve these requests as a critical part of the team.
The Field Services business model gives the team access to the resource pool of highly skilled Dell Badged FSEs as well as Partner Field Engineers from third-party agencies. The current resource capacity planning process is based on a click system that auto dispatches to field or partner based on skill and availability, as outlined in the following figure:
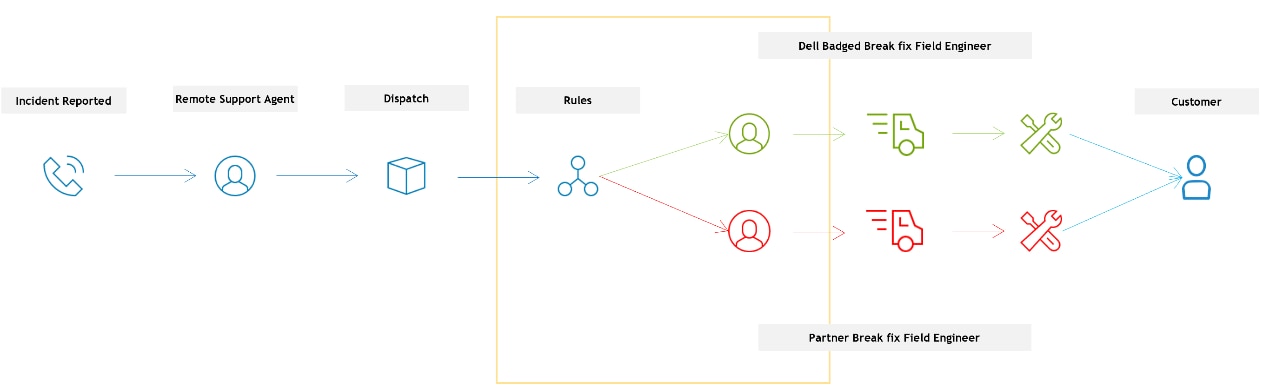
Figure 1. HES Field Services Dispatch assignment process
The Field Service business is tasked with working under a plethora of constraints while delivering a high-quality experience to customers.
Focused on optimizing the FSE availability and utilization across the Asia Pacific region, the APJC Business Operations team sought a better understanding of the performance and resourcing.
Associated challenges include:
- Strategizing training needs of FSEs1
- Enhancing efficiency of FSE during working hours2
- Optimizing utilization of available resources, staffing levels across different countries3 and more
1. Science Direct, The Multidimensional 0–1 Knapsack Problem: An Overview, 2004
2. IEEE, Modeling and Optimization of Content Delivery Networks with Heuristics Solutions for Multidimensional Knapsack Problem, 2016
3. Towards Science Data, Dynamic program vs integer program: which one is better for the knapsack problem?, 2020
Document purpose
Audience
We value your feedback
Terminology
Methodology
Methodology
DELLQUINN solution components
The DELLQUINN process module is made up of various components that create a streamlined workflow, as shown in the following figure and detailed within this chapter:
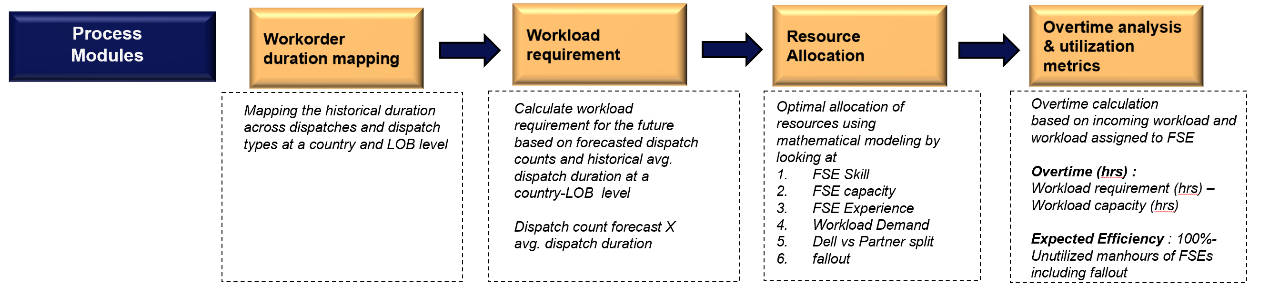
Figure 2. Workflow diagram of DELLQUINN solution
Workorder duration mapping and workload requirement estimation
Each dispatch request that comes from a customer is tracked as a workorder within the field system. For this reason, understanding information at a workorder level becomes critical for solution design.
Workorders also determine the workload. The workload for this use case is defined as the total amount of time (measured in hours) that FSEs spend to resolve incoming dispatches.
Looking at workorders as the first part of the DELLQUIN solution process, it is important to note that there are three main types:
- Technical Support
- Professional services
- Maintenance services
The type of workorder is determined based on whether the task requires code upgrade for the hardware, hardware assistance, or maintenance aid, respectively. These workorder types require different FSE training and proficiencies and differ from product to product.
Each Dell product corresponds to a LOB and tasks are optimized at a LOB and workorder-type level.
For example, a professional services workorder relating to a particular LOB is different from a maintenance services workorder for the same LOB in terms of duration of time, skill set, and type of work required.
The DELLQUINN solution involves demand forecasting using a time series model that predicts future incoming dispatches at a country, fiscal week, LOB, and workorder-type level. Based on the prediction of the incoming work orders, Workorder Duration Mapping is performed to estimate the total number of workload hours to be taken up by Dell FSEs.
The average duration that an FSE takes to complete a workorder is computed from the historical data at a country, LOB, and workorder-type level. For example, based on two years of data, technical services dispatches in a certain country and LOB take an average of five hours to be resolved.
A simple unitary method is used to perform Workorder Duration Mapping to gauge the total workload for that week using the following relationship:
Projected workload (hrs) = Average duration (hrs) per dispatch x Projected dispatch count
Resource Optimization
Resource optimization is the process of efficiently planning the capacity of FSEs based on future workload requirements. This efficacious process helps facilitate optimized performance and utilization of resources.
The DELLQUINN Workload Optimization solution has an ML optimization framework encompassing two components that help optimize the workload to FSEs in an intelligent manner, including:
- Component 1: A Collaborative Filter that prioritizes FSEs based on skills, experience, dispatch-handling behavior, completed trainings, certifications, and performance metrics, then ranks them across the Dell products or LOBs
- Component 2: A Combinatorial Optimizer that combines the power of integer and dynamic programming-based optimization methods to efficiently optimize the capacity of the engineers given the future workload demand
The DELLQUINN ML resource optimization framework is detailed in the following figure.
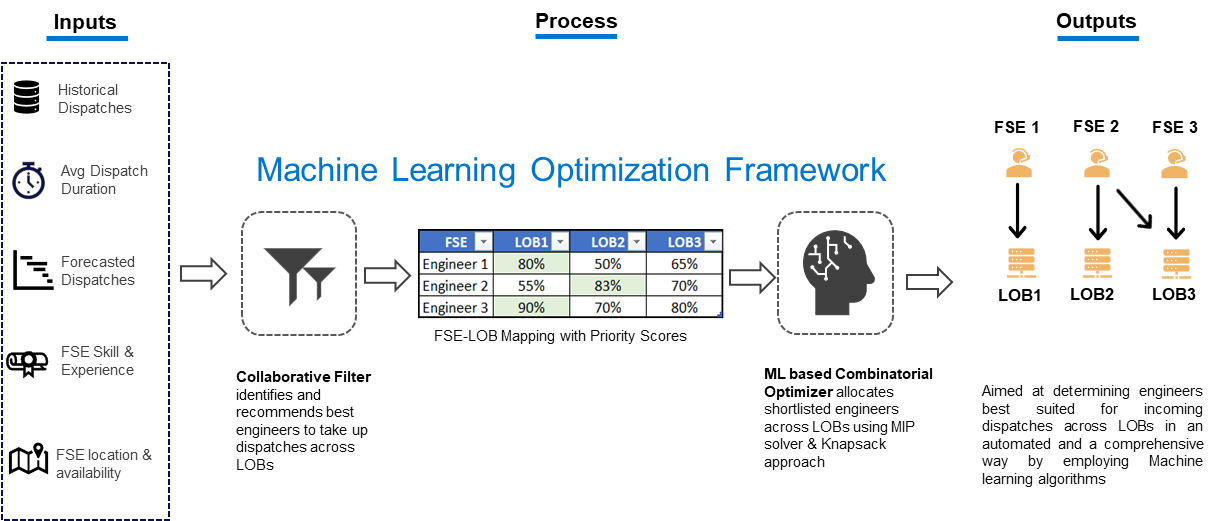

Figure 3. The DELLQUINN solution ML resource optimization framework
Component 1: Collaborative Filtering
Collaborative Filtering is an intelligent technique that filters information from transactional data by analyzing and determining the similarities across transactions. It is widely used in recommendation engines on ecommerce websites and Over-The-Top (OTT) services that deliver content over the internet.
For example, Collaborative Filtering helps predict how much a user will like a product given a set of historical preferences and judgments of themselves as well as a community of users. The following details collaborative filtering outputs across each category of products and services.
Types of Collaborative Filtering
- User-based Collaborative Filtering (UBCF): Predicts a user’s opinion about a product or a service based on the feedback given by the other users. This is based on measuring the similarity among the users.
- Item-based Collaborative Filtering (IBCF): Predicts a user’s opinion about a product or a service based on the similarity among the products. Similarity among the products is computed assuming user’s outlook on similar products would be the same.
- Similarity Measure: The commonly used metric to determine the similarity among attributes (products / services / users) is the Cosine Similarity metric. It is defined as the ratio between the dot product of the attributes that are represented as vectors and the product of their Euclidean lengths. Cosine Similarity from a geometric point of view is the angle between two vectors, as shown in the following equation.
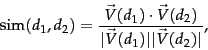
Figure 4. Cosine Similarity metric
Applying Collaborative Filtering to resource optimization
The principle of Collaborative Filtering is employed to identify similarities among skilled engineers across different products or LOBs. Collaborative Filtering is also used to predict priority scores indicating which engineers are best suited to work across domains in the future.
User-product ratings vs. priority scores
In Collaborative Filtering set up, the ratings given by users across products are represented in a matrix format. This goes in as input into the Collaborative Filter model to learn user-product preferences based on variety of associated user demographic attributes such as location, preferences, and so on.
The Collaborative Filter model learns the relationships between user-product ratings and the user demographics in the context of identifying similar users and similar products. The model then uses this learning to predict what rating a user would leave for a product based on how similar this user to the other users in the chosen data in terms of demographic attributes and any other additional inputs considered.
As there is no ratings data available across the FSE-Product Category/LOB combination, a priority score is generated for each FSE-LOB combination. This priority score is developed by normalizing the number of dispatches the engineers worked on in the past based on their work experience at Dell. Priority scores serve as a proxy to the ratings in a user-product matrix in a Collaborative Filter set up.
Collaborative Filter for priority score prediction
Multiple Collaborative Filtering techniques—such as User-Based Collaborative Filters (UBCF) and Item-Based Collaborative Filters (IBCF)—are run to accurately predict the priority scores of FSEs across LOBs/Product.
The technique that yields the least Root Mean Squared Error (RMSE) across multiple iterations is chosen as the best and final model for predicting priority scores for FSEs in the future.
Root Mean Squared Error (RMSE)
The deviation between the actual priority score and the predicted priority score across FSE-LOBs/Product is measured as the square root of the mean of the squared differences between the actual and the model-predicted priority scores:
RMSE=√Mean(Actual Priority Score (i)-Predicted Priority Score (i))²)
The smaller the RMSE value, the better the predictability of the model.
A grid search-based parameter optimization process is run to choose the best of both the UBCF and IBCF methods to predict the priority scores for FSEs across LOBs/Product categories. This process found that IBCF performed the best across multiple iterations of the model, yielding the least RMSE across iterations with several methods as shown in the following figure.
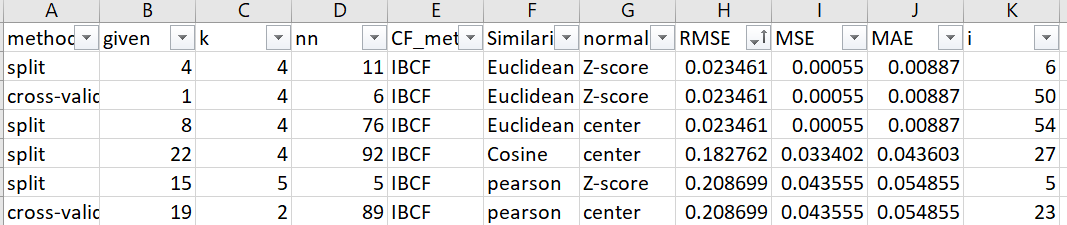
Figure 5. Grid search-based parameters and error metrics from the IBCF model
Considering historical priority scores coupled with a set of impact factors, the future priority scores are predicted for engineers using the IBCF technique (best model) across the products in demand. These impact factors can include:
- Training sessions completed
- Certifications
- Location
- Time spent on dispatches
Typical output from this model looks like the following figure:
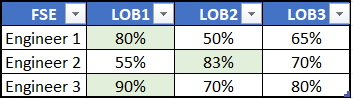
Figure 6. Sample output of prioritization scores of FSEs across LOBs
Considering this output, Engineer 3 has a predicted priority score of 90%, which suggests they are best suited to work on Product 1 (LOB 1), followed by Engineer 1 with a priority score of 80%.
These scores can be used to prioritize engineers and optimally determine an efficient capacity plan for each product.
Note: Further details on resource prioritization can be found in the following MIP and Knapsack sections.
Component 2: Combinatorial optimizer with Mixed Integer Programming (MIP) Solver
In mathematics, computer science, or economics, optimization problems involve finding the best possible solution out of several feasible ones. Many important applied problems involve finding the best way to accomplish some tasks. This might mean finding the maximum or minimum value of some function (for example, the minimum time taken to make a certain journey; minimum cost of doing a task; or maximum power that can be generated from a device).
Many of these problems can be solved by finding the appropriate function and then using calculus to find the maximum or the minimum value required. Generally, such problems will have the following mathematical form:
Find the largest (or smallest) value of f(x) when a≤x≤b.
Sometimes a or b are infinite, but frequently the real world imposes some constraint on the values that x may have.
Mixed Integer Programming (MIP) is an optimization model where one or more decision variables are constrained to be integers to determine the optimal solution. The scope of optimization can be enhanced through the usage of integer variables in the model context.
The DELLQUINN solution uses MIP Solvers from OR-Tools, an open-source software suite for optimization developed by Google. Like any other optimization problem, the following must be considered:
- What objective function needs to be maximized or minimized?
- What are the constraints?
DELLQUINN optimally performs capacity planning of FSEs by:
- Maximizing the priority scores of FSEs across LOBs/Products determined from Collaborative Filtering model (objective function)
- Considering the maximum capacity of FSEs, with maximum tasks that must be completed for each LOB/Product category based on the forecasted dispatch counts across each LOB/Product category (constraints)
The solution includes two MIP Solvers:
- Solver 1 optimizes FSE capacity based on maximum forecasted dispatches for each LOB in each region
- Solver 2 optimizes remaining FSE capacity for each LOB and each region with reference to maximum of remaining forecasted dispatches
MIP Solver internally creates several FSE-LOB combinations and chooses the best combination to maximize the optimization function (or the FSE priority score). Combinatorial Optimizer with MIP Solvers not only performs optimal capacity planning, but also generates optimal FSE-LOB combination across regions.
Combinatorial optimizer with Knapsack
The DELLQUINN Workload Optimization solution employs the 0-1 Knapsack combinatorial optimizer, implemented in Python using dynamic programming. The dynamic programming solution had the least time complexity and analogous accuracy in comparison to its greedy and brute-force algorithm counterparts.
This approach leverages the analogy of filling a knapsack (or backpack) with objects of a certain size and weight. The knapsack will have a physical size constraint and based on its material and design, will have a maximum weight it can carry without getting damaged (W).
Items with varying weights and values are expressed as weight-value pairs: (Wt1, V1), (Wt2, V2), (Wt3, V3)…(Wtn, Vn) as shown in the following example.
The knapsack must be filled with items with varying weights and values such that the total weight of the sack does not exceed the weight constraint while the total value of the sack is maximized.
W ≥ Wt1 + Wt2 + Wt3 +...Wtn such that (V1 + V2 + V3 +…Vn ) is maximized.
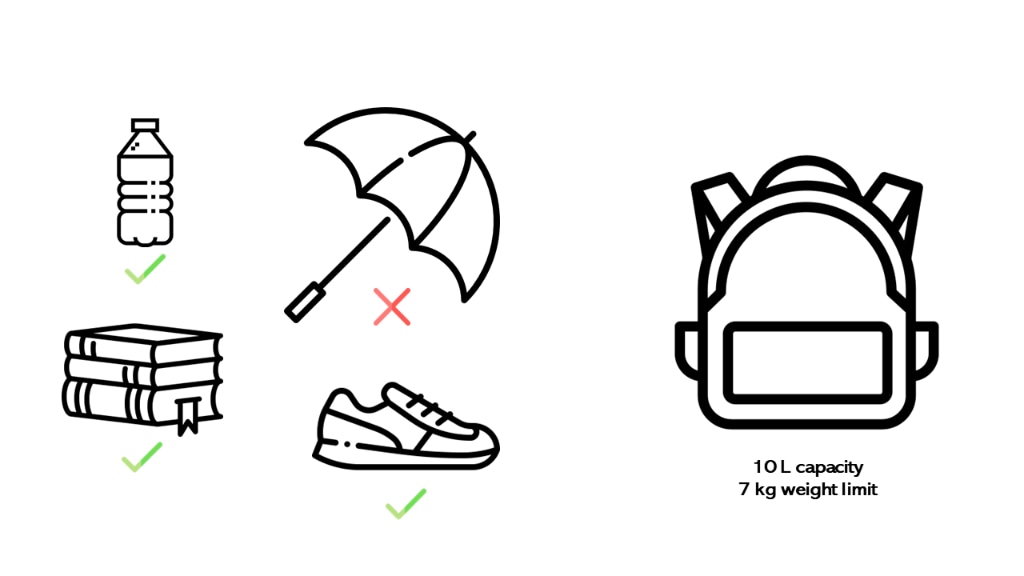
Figure 7. An illustration of knapsack analogy and items of varying weight
The DELLQUINN Workload Optimization solution uses the knapsack solution approach to perform efficient resource optimization based on forecasted dispatches.
The solution to the knapsack problem is determined by maximizing the objective function (for example, priority scores of FSEs across LOBs/Products) subject to utilizing the maximum capacity available for FSEs and future forecasted dispatches across LOBs/Products. Various FSE capacities are shown in the following figure.
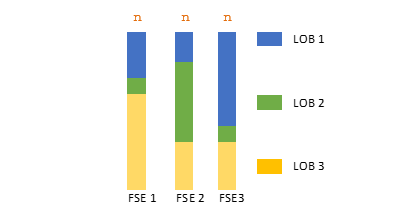
Figure 8. Illustrated depiction of FSEs with varying optimal capacities
In this illustration, FSE 1, FSE 2, and FSE 3 are all hired for “n” hours and based on the difference in priority scores, the knapsack algorithm optimizes different proportions of dispatches from LOB 1, LOB 2, and LOB 3.
Selective Optimization Model – MIP and Knapsack Algorithm
The DELLQUINN solution uses two Combinatorial Optimizers to optimize FSE capacity in the best possible way selectively across regions based on least deviation between the actual utilization and predicted utilization. This Selective Optimization Model is outlined in the following figure.
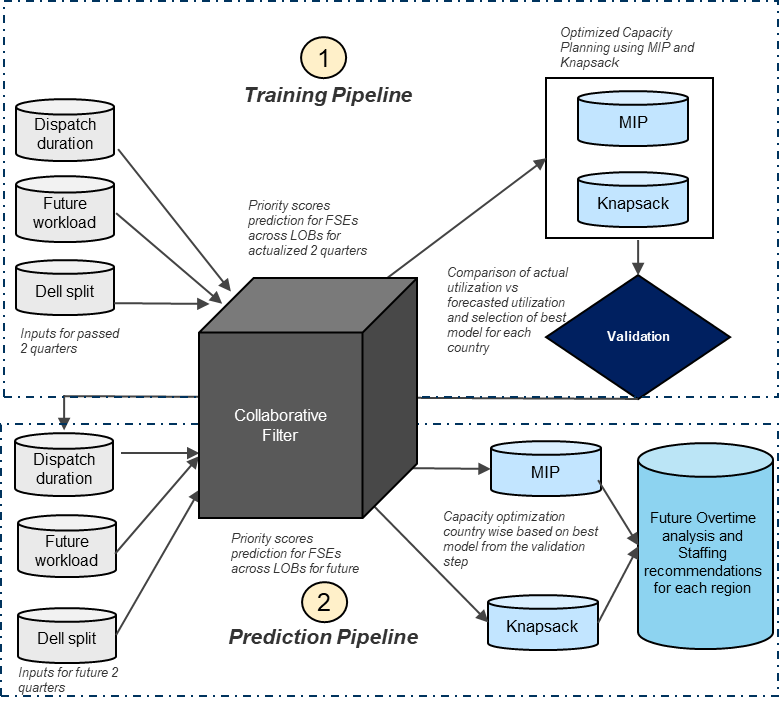
Figure 9. Selective Optimization in the DELLQUINN solution
The optimization pipeline is divided into two sections:
- Training Pipeline (for previous quarters): Here, the ML-based resource optimization framework is run with both MIP and Knapsack Combinatorial Optimizers for the latest historical quarter to perform efficient capacity optimization. Predicted Utilization (or Expected Efficiency) is also calculated across regions for the latest historical quarter.
These predicted efficiencies are compared against the actual utilization of all FSEs across each region and the deviation between the predicted utilization/expected efficiency and the actual utilization for the historical quarter is calculated across regions. Among MIP and Knapsack optimizer outputs, whichever has the least deviation between actual utilization and the predicted utilization is chosen as the best model for each region. The prediction pipeline is then run to perform the workload optimization for the future quarters across regions.
- Prediction Pipeline (for future quarters): The Prediction Pipeline involves running the best optimizer selected for each country from the Training Pipeline and then performing overtime and staffing analysis on each region at a quarterly level.