VMware: vSAN Physical Disk Troubleshooting Guide
Summary: This is a general troubleshooting guide to help identifying if there is a problem with a physical disk in vSAN Clusters.
This article applies to
This article does not apply to
This article is not tied to any specific product.
Not all product versions are identified in this article.
Instructions
Checking for vSAN Physical Disk status from the Web UI:
Connect to vCenter Server Web Client and check the disk status from:
Inventory > Host and Clusters > vSAN Cluster > Configure > vSAN > Disk Management
Picture 1: vSAN Disk Management view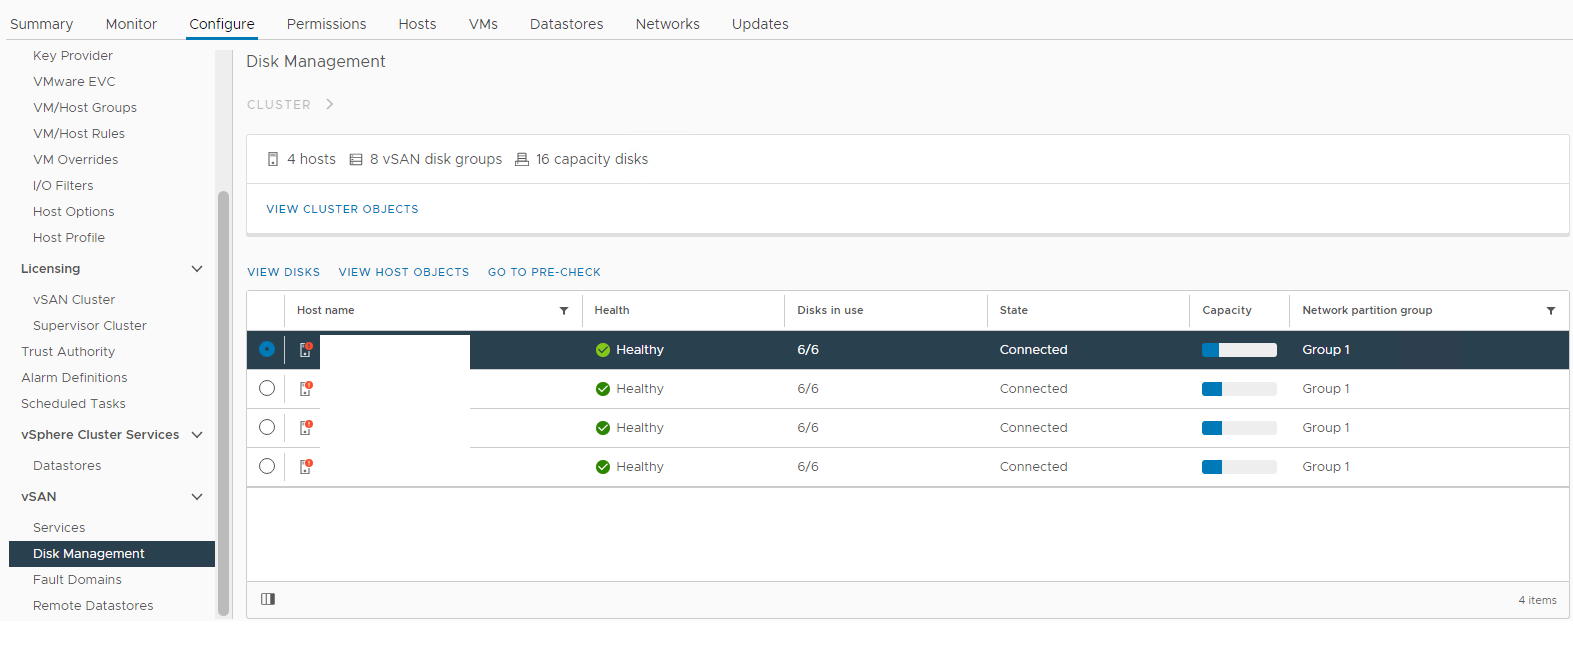
Select the affected host and then expand the view disk section:
Picture 2: vSAN Disk Group view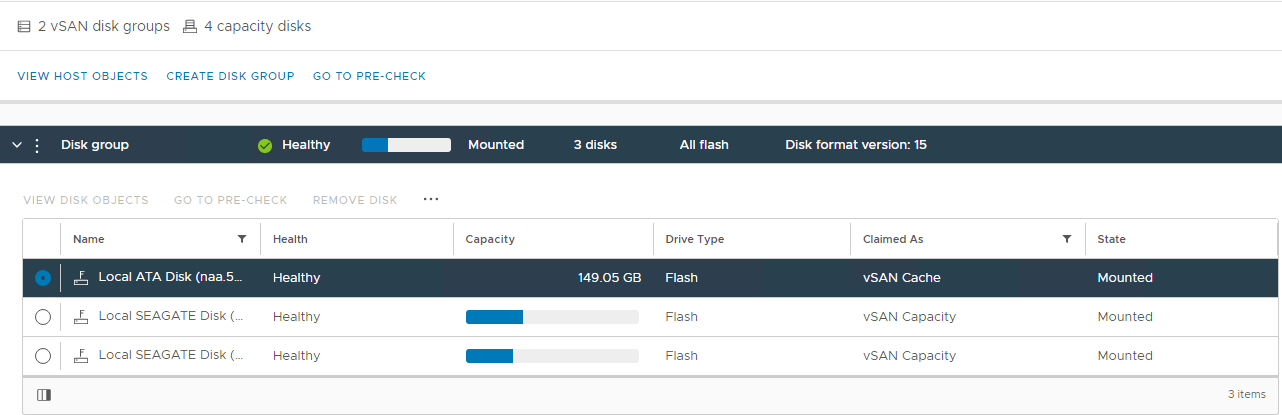
Here you can verify if a disk is detected as:
Unhealthy
Unmounted
0 Capacity
Permanent Disk Failure
Disk Down
Disk Absent
Also, check for disk-related alarms triggered from the vSAN Skyline Health section:
Inventory > Host and Clusters > vSAN Cluster > Monitor > vSAN > Skyline Health > Physical disk
Picture 3: Skyline Health view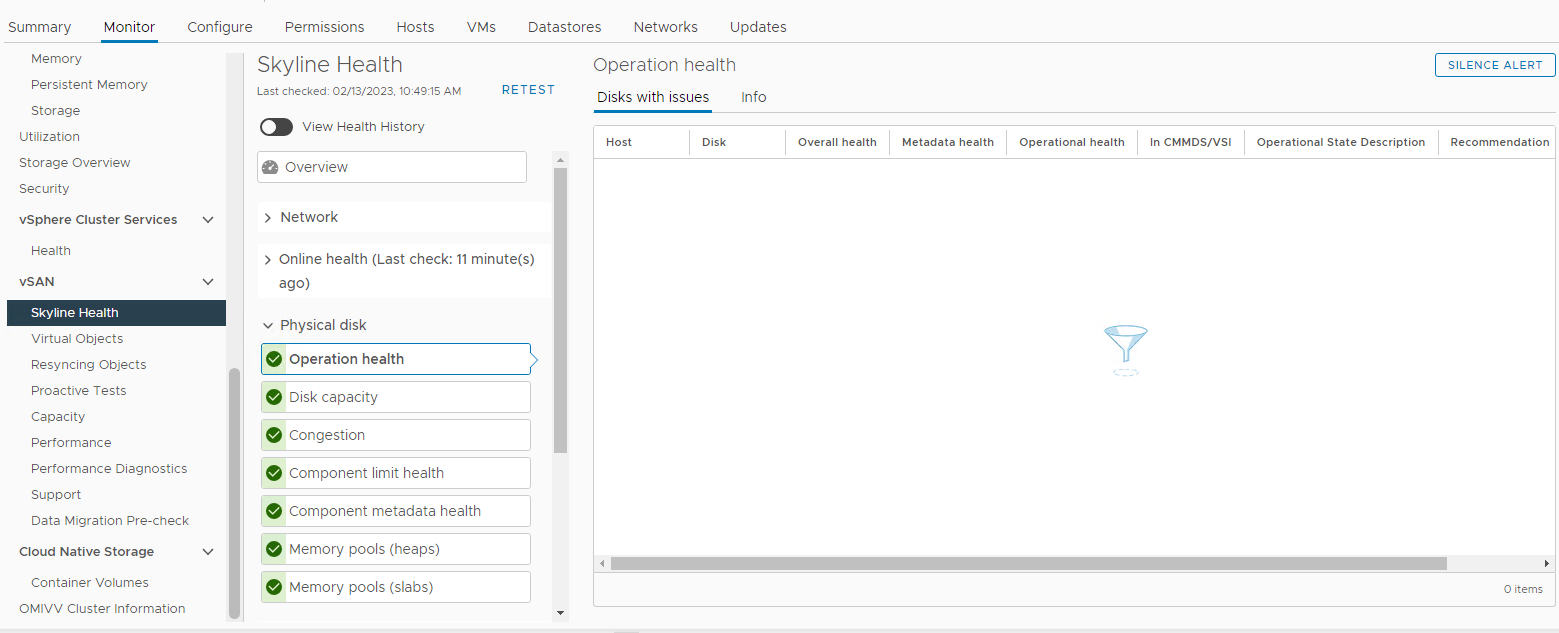
Here you can verify if any of the following alarms is triggered:
Impending permanent disk failure, data is being evacuated (Health state - Yellow).Impending permanent disk failure, data evacuation failed due to insufficient resources (Health state - Red).Impending permanent disk failure, data evacuation failed due to inaccessible objects (Health state - Red).Impending permanent disk failure, data evacuation completed (Health state - Yellow)
Also, you can check disk status from the affected host's Storage Devices list:
Inventory > Host and Clusters > vSAN Cluster > Affected vSAN ESXi Host > Configure > Storage > Storage Devices
Picture 4: Host Storage Devices view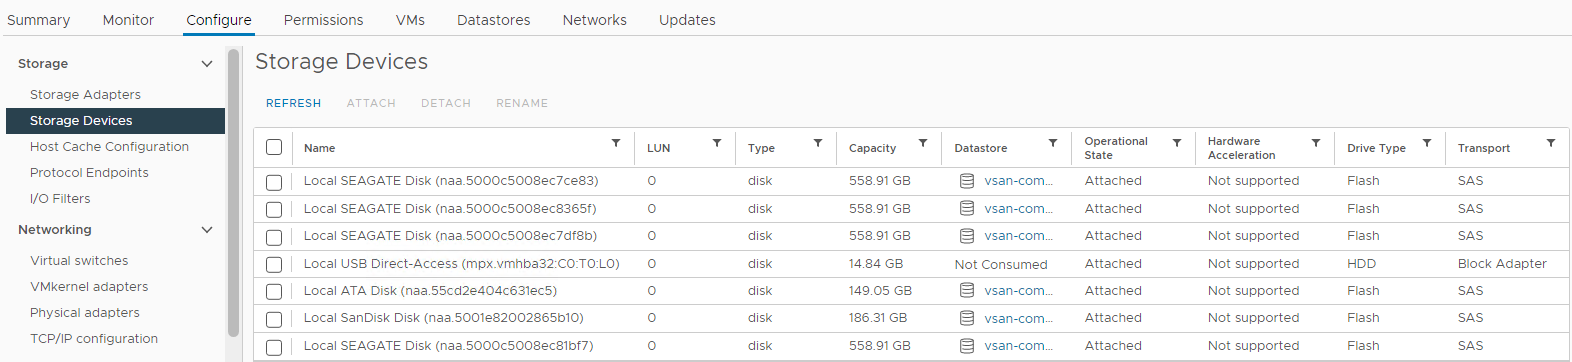
Here you can verify if a disk status is:
0 Capacity
Disk Absent
Disk Unmounted
Verify if there is a Resync happening:
Inventory > Host and Clusters > vSAN Cluster > Monitor > vSAN > Resyncing Objects:
Picture 5: Resyncing Objects view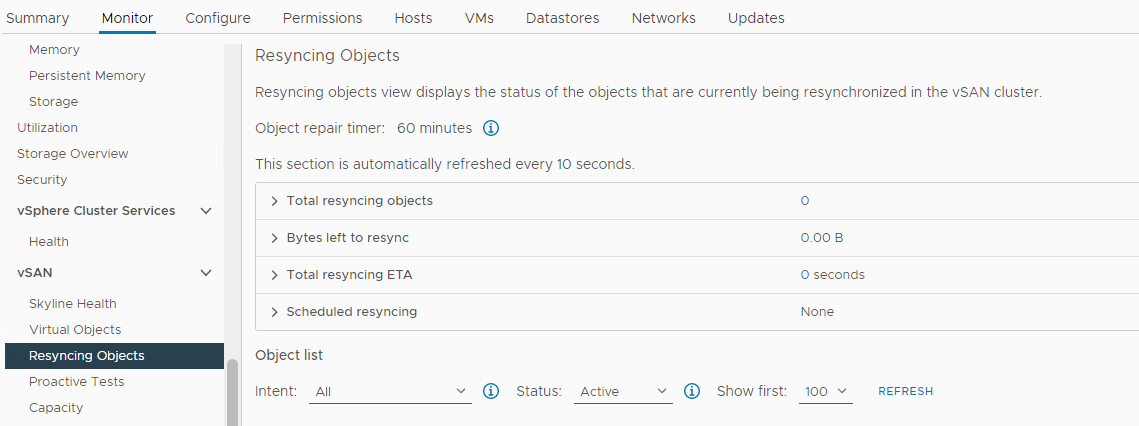
NOTE: Resync could indicate that data is being evacuated from an affected disk or disk group. Further investigation is needed to determine if the affected disk is ready to be removed or replaced.
Verify the status of vSAN Objects:
Inventory > Host and Clusters > vSAN Cluster > Monitor > vSAN > Skyline Health > Data > vSAN object health
Picture 6: vSAN object health view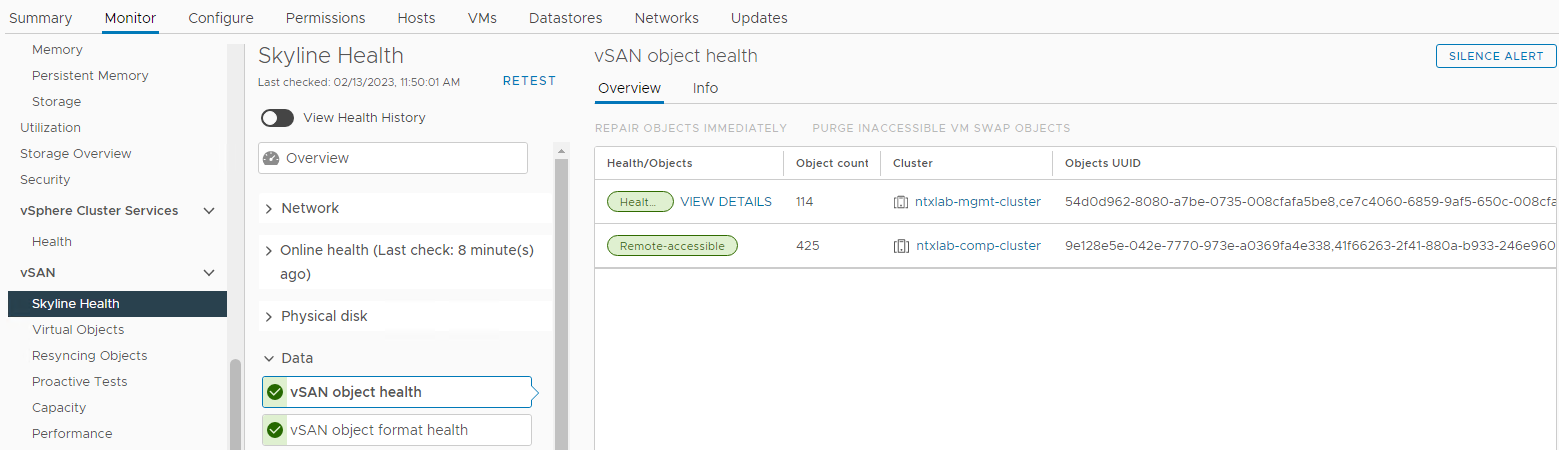
NOTE: It is important to verify that there are no inaccessible objects. Object inaccessible means "all copies of the object are missing." If you remove or replace a disk that may cause DL.
The next step is to gather more information about the issue over CLI and checking the logs:
Checking for vSAN Physical Disk status from CLI:
Connect over SSH to the affected host and run the following commands:
vdq -qH
Check on the "IsPDL" (permanent device loss) parameter. If it is equal 1, the disk is lost.
Example:
DiskResults:
 DiskResult[0]:
 Name: naa.600508b1001c4b820b4d80f9f8acfa95
 VSANUUID: 5294bbd8-67c4-c545-3952-7711e365f7fa
 State: In-use for VSAN
 ChecksumSupport: 0
 Reason: Non-local disk
 IsSSD?: 0
IsCapacityFlash?: 0
 IsPDL?: 0
 <<truncated>>
 DiskResult[18]:
 Name:
 VSANUUID: 5227c17e-ec64-de76-c10e-c272102beba7
 State: In-use for VSAN
 ChecksumSupport: 0
 Reason: None
 IsSSD?: 0
IsCapacityFlash?: 0
 IsPDL?: 1
vdq -iH
Check if there is a missing disk from the disk group.
Example:
Mappings:
DiskMapping[0]:
SSD: naa.58ce38ee2016ffe5
MD: naa.5002538a4819e3e0

DiskMapping[2]:
SSD: naa.58ce38ee2016fe55
MD: naa.5002538a48199ca0
MD: naa.5002538a48199e20
MD: naa.5002538a48199e00
esxcli vsan storage list
Check on the "In CMMDS" parameter. If false, then communication is lost to disk.
Example:
Device: Unknown
Display Name: Unknown
Is SSD: false
VSAN UUID: 529cadbc-acd1-b588-8643-68336d5512d6
VSAN Disk Group UUID:
VSAN Disk Group Name:
Used by this host: false
In CMMDS: false
On-disk format version: <Unknown>
Deduplication: false
Compression: false
Checksum:
Checksum OK: false
Is Capacity Tier: false
for i in `esxcli storage core device list | grep ^naa` ; do echo $i; esxcli storage core device smart get -d $i; done.
Check for read/write errors with the smart get command.
Example:
naa.55cd2e404c1f35a1
Parameter                   Value  Threshold  Worst  Raw
--------------------------  -----  ---------  -----  ---
Health Status               OK     N/A        N/A    N/A
Media Wearout Indicator     100    0          100    86
Read Error Count            130    39         130    133
Power-on Hours              100    0          100    110
Power Cycle Count           100    0          100    106
Drive Temperature           100    0          100    26
Uncorrectable Sector Count  100    0          100    0
naa.55cd2e404c1f35a5
Parameter                   Value  Threshold  Worst  Raw
--------------------------  -----  ---------  -----  ---
Health Status               OK     N/A        N/A    N/A
Media Wearout Indicator     100    0          100    10
Read Error Count            130    39         130    53
Power-on Hours              100    0          100    110
Power Cycle Count           100    0          100    106
Drive Temperature           100    0          100    27
Uncorrectable Sector Count  100    0          100    0
esxcli vsan storage list | grep "VSAN Disk Group UUID:" | sort | uniq -c
Check for available disk groups.
Example:
      2    VSAN Disk Group UUID: 5203424c-ee56-497d-75d1-fcf73ae997cb
      2    VSAN Disk Group UUID: 52af8e5c-77d1-b552-3310-ec5fef09edf4
while true;do echo " ****************************************** "; echo "" > /tmp/resyncStats.txt ;cmmds-tool find -t DOM_OBJECT -f json |grep uuid |awk -F \" '{print $4}' |while read i;do pendingResync=$(cmmds-tool find -t DOM_OBJECT -f json -u $i|grep -o "\"bytesToSync\": [0-9]*,"|awk -F " |," '{sum+=$2} END{print sum / 1024 / 1024 / 1024;}');if [ ${#pendingResync} -ne 1 ]; then echo "$i: $pendingResync GiB";fi;done |tee -a /tmp/resyncStats.txt;total=$(cat /tmp/resyncStats.txt |awk '{sum+=$2} END{print sum}');echo "Total: $total GiB" |tee -aa /tmp/resyncStats.txt;total=$(cat /tmp/resyncStats.txt |grep Total);totalObj=$(cat /tmp/resyncStats.txt|grep -vE " 0 GiB|Total"|wc -l);echo "`date +%Y-%m-%dT%H:%M:%SZ` $total ($totalObj objects)" >> /tmp/totalHistory.txt; echo `date `; sleep 60; done
Check if there are ongoing or stuck resync operations.
Example:
Total: 0 GiB
Mon Feb 13 17:32:06 UTC 2023
Press Ctrl+C to stop command.
cmmds-tool find -f python | grep CONFIG_STATUS -B 4 -A 6 | grep 'uuid\|content' | grep -o 'state\\\":\ [0-9]*' | sort | uniq -c
Check the state of the components.
Healthy -- state 7Inaccessible -- state 13Absent or Degraded -- state 15
Example:
425 state\": 7
How to identify where the failed SSD or HARD DRIVE is located over CLI:
List all available devices:
esxcli storage core device list | grep "naa" | awk '{print $1}' | grep "naa"
Example:
naa.5000c500852df8d3
naa.55cd2e404c1f35a1
naa.55cd2e404c1f35a5
naa.5000c500852dd5e7
Check the location using each disk naa from the list:
esxcli storage core device physical get -d
Example:
esxcli storage core device physical get -d naa.5000c500852df8d3
esxcli storage core device physical get -d naa.55cd2e404c1f35a1
esxcli storage core device physical get -d naa.55cd2e404c1f35a5
esxcli storage core device physical get -d naa.5000c500852dd5e7

   Physical Location: enclosure 65535 slot 0
   Physical Location: enclosure 65535 slot 1
   Physical Location: enclosure 65535 slot 2
   Physical Location: enclosure 65535 slot 3
How to identify the failed HARD DRIVE or SSD if the device name is missing:
It is possible that the failed disk is not detected and unable to identify using the corresponding naa. In this scenario, it is needed to locate all disks, and the one that is not physically located would be the one that failed.
Here is a script that can be used to perform the task slightly quicker:
echo "=============Physical disks placement=============="
echo ""
esxcli storage core device list | grep "naa" | awk '{print $1}' | grep "naa" | while read in; do
echo "$in"
esxcli storage core device physical get -d "$in"
sleep 1
echo "===================================================="
done
vSAN relevant logs for storage-related issues:
/var/log/vmkernel.log
Issues reading and writing to vSAN disks, vSAN host heartbeats, PDLs, SCSI sense codes and I/O requests (Reads/Writes), and cluster membership information.
Example:
2021-06-22T12:02:08.408Z cpu30:1001397101)ScsiDeviceIO: PsaScsiDeviceTimeoutHandlerFn:12834: TaskMgmt op to cancel IO succeeded for device naa.55cd2e404b7736d0 and the IO did not complete. WorldId 0, Cmd 0x28, CmdSN = 0x428.Cancelling of IO will be
2021-06-22T12:02:08.408Z cpu30:1001397101)retried.
/var/log/vobd.log
Reports on disk health, permanent device lost disks (PDLs), disk latency, and reports on when a host enters and exits maintenance mode.
Example:
2022-05-31T11:42:46.065Z: [vSANCorrelator] 10605891965954us: [vob.vsan.lsom.devicerepair] vSAN device 521a74ce-c980-c16c-ff3d-38a036233daf is being repaired due to I/O failures, and will be out of service until the repair is complete. If the device is part of a dedup disk group, the entire disk group will be out of service until the repair is complete.
2022-05-31T11:42:46.065Z: [vSANCorrelator] 10606062774178us: [esx.problem.vob.vsan.lsom.devicerepair] Device 521a74ce-c980-c16c-ff3d-38a036233daf is in offline state and is getting repaired
/var/log/vsandevicemonitord.log
It helps you to determine if the disk was marked unhealthy due to excessive log congestion or I/O latencies.
Example:
INFO vsandevicemonitord WARNING - WRITE Average Latency on VSAN device naa.50000xxxxxxxx has exceeded threshold value 2000000 us 2 times.
INFO vsandevicemonitord Tier 2 (naa.50000xxxxxxxx) as unhealthy
Affected Products
PowerEdge C6420, PowerEdge C6520, PowerEdge C6525, PowerEdge C6615, PowerEdge C6620, PowerEdge M640 (for PE VRTX), PowerEdge R440, PowerEdge R450, PowerEdge R540, PowerEdge R550, PowerEdge R640, PowerEdge R6415, PowerEdge R650, PowerEdge R650xs
, PowerEdge R6515, PowerEdge R6525, PowerEdge R660, PowerEdge R660xs, PowerEdge R6615, PowerEdge R6625, PowerEdge R740, PowerEdge R740XD, PowerEdge R740XD2, PowerEdge R7415, PowerEdge R7425, PowerEdge R750, PowerEdge R750XA, PowerEdge R750xs, PowerEdge R7515, PowerEdge R7525, PowerEdge R760, PowerEdge R760XA, PowerEdge R760xd2, PowerEdge R760xs, PowerEdge R7615, PowerEdge R7625, PowerEdge R840, PowerEdge R860, PowerEdge R940, PowerEdge R940xa, PowerEdge R960, PowerEdge T430, PowerEdge T440, PowerEdge T550, PowerEdge T560, PowerEdge T630, PowerEdge T640, VMware ESXi 6.7.X, VMware ESXi 7.x, VMware ESXi 8.x, VMware VSAN, Dell EMC vSAN C6420 Ready Node, Dell EMC vSAN MX740c Ready Node, Dell EMC vSAN MX750c Ready Node, Dell vSAN Ready Node MX760c, Dell EMC vSAN R440 Ready Node, Dell EMC vSAN R640 Ready Node, Dell EMC vSAN R6415 Ready Node, Dell EMC vSAN R650 Ready Node, Dell EMC vSAN R6515 Ready Node, vSAN Ready Node R660, Dell vSAN R6615 Ready Node, Dell EMC vSAN R740 Ready Node, Dell EMC vSAN R740xd Ready Node, Dell EMC vSAN R750 Ready Node, Dell EMC vSAN R7515 Ready Node, Dell EMC vSAN R760 Ready Node, Dell vSAN R7615 Ready Node, Dell vSAN Ready Node R7625, Dell EMC vSAN R840 Ready Node, Dell EMC vSAN T350 Ready Node, VxRail 460 and 470 Nodes, VxRail D560, VxRail D560F, VxRail E460, VxRail E560, VxRail E560F, VxRail E560N, VxRail E660, VxRail E660F, VxRail E660N, VxRail E665, VxRail E665F, VxRail E665N, VxRail G560, VxRail G560F, VxRail P470, VxRail P570, VxRail P570F, VxRail P580N, VxRail P670F, VxRail P670N, VxRail P675F, VxRail P675N, VxRail S470, VxRail S570, VxRail S670, VxRail V470, VxRail V570, VxRail V570F, VXRAIL V670F, VxRail VD-4510C, VxRail VD-4520C, VxRail VE-660, VxRail VE-6615, VxRail VE-670, VxRail VP-760, VxRail VP-7625, VxRail VP-770
...
Article Properties
Article Number: 000209262
Article Type: How To
Last Modified: 09 Mar 2026
Version: 6
Find answers to your questions from other Dell users
Support Services
Check if your device is covered by Support Services.