ViPR SRM - after upgrade to 4.0.1 missing Isilon historical data
Summary: This article explains how to modify the Nodes report in order to display historical data.
This article applies to
This article does not apply to
This article is not tied to any specific product.
Not all product versions are identified in this article.
Symptoms
upgrade to ViPR SRM 4.0.x
After upgrading to 4.0.1, could no longer see Isilon historical data from before the date of the upgrade. Reviewing tables in SQL, found that several of the variableid's have changed from one cache group to the next.
After upgrading to 4.0.1, could no longer see Isilon historical data from before the date of the upgrade. Reviewing tables in SQL, found that several of the variableid's have changed from one cache group to the next.
Cause
In order to better organize metrics, provide enhancements, or fix issues, it may sometimes be necessary to change their variable IDs between versions of ViPR SRM. In such cases, old (historical) metrics will become inactive and may not show up in reports by default. However, these metrics still exist in the database for a period of time and can be linked back to current reports if there is a need to review the historical data related to those metrics.
One such change in ViPR SRM 4.0 was for part type node in the EMC Isilon Solution Pack.
Previously, the Isilon Node component incorrectly used parttypes Disk, FileSystem, and Processor. This has been fixed to use explicit parttype=Node. The Report Library > EMC Isilon > Inventory > Nodes report filters on parttype=Node. As a result of this change, Node history, and any custom reports created using the old parttype, will be affected.
Previously, Isilon cluster level metrics incorrectly used parttypes Disk, FileSystem, and Processor. This has been fixed by removing the property parttype from all cluster level metrics. The Report Library > EMC Isilon > Capacity > Cluster Capacity and Report Library > EMC Isilon > Performance reports filters on !parttype. As a result of this change, cluster level history, and any custom reports created using the old parttype, will be affected.
Resolution
How to modify the Nodes report in order to display historical data:
-
Navigate to the Nodes report, such as: Report Library>>EMC Isilon>>Inventory Nodes tab.
-
Click Edit Mode .
-
Navigate to: All>>EMC Isilon>>Inventory>>Nodes
-
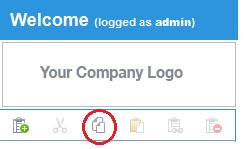
Click the Copy icon.
-
Navigate to My Reports
-
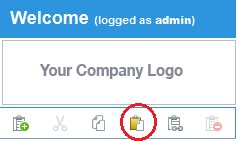
Click the Paste as Child Report icon
-
Now there should be a copy of Nodes within the My Reports tree. Click on the newly-copied report node at All>>My Reports>>Nodes, and select the Filtering & Expansion tab on the right. Rename the report to: Nodes with History and click Save . Now the My Reports node should look as follows:

-
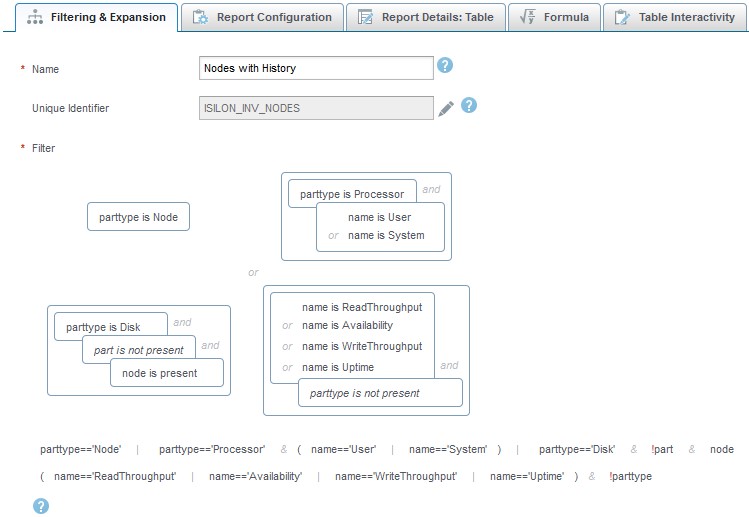
Click on the Filtering & Expansion tab. Modify the filter of the report via edit expression from:
parttype=='Node' & source=='Isilon-Collector'
to:
parttype=='Node' | parttype=='Processor' & (name=='User' | name=='System') | parttype=='Disk' & !part & node | (name=='ReadThroughput' | name=='Availability' | name=='WriteThroughput' | name=='Uptime') & !parttype -
Click Save
-
Now the filter should look as follows:
-
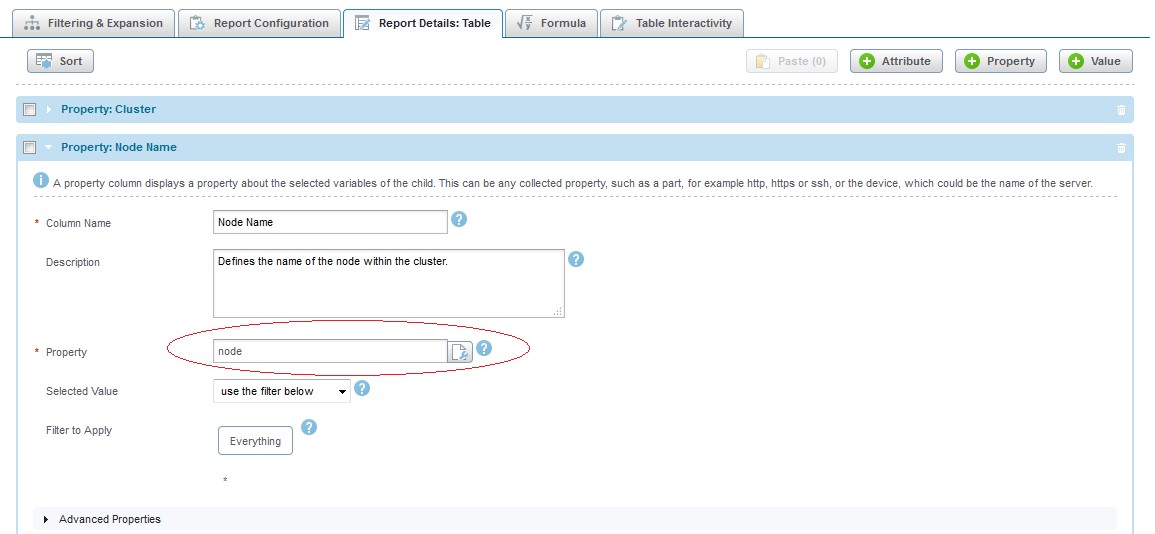
Click on the Report Details: Table tab. Expand Property: Node Name and rename part to node :
-
Click Save
-
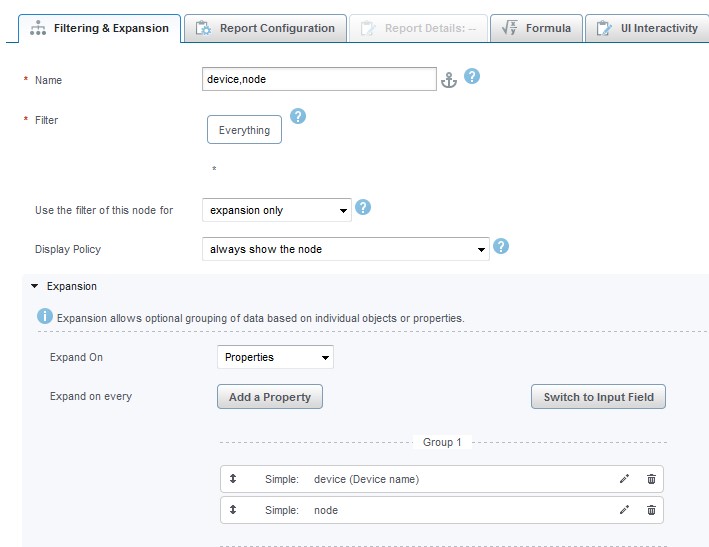
Navigate one node down in the reports to My Reports>>Nodes with History>>device,part and click on the Filtering & Expansion tab, then rename the report to device,node.
-
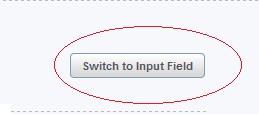
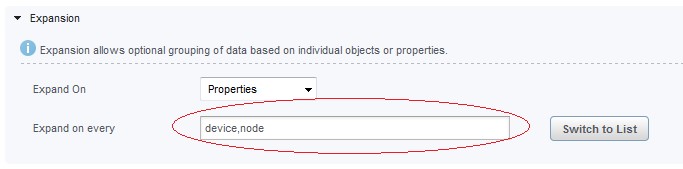
Within the Expansion section, click on the Switch to Input Field button.
-
In the text box, replace device,part with device,node.
-
Click Save
-
Now the Filtering & Expansion node should look as follows:
-
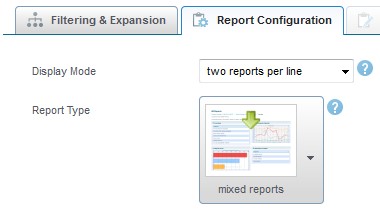
Navigate one node down in the reports to All>>My Reports>>Nodes with History>>device,node>>Performance and click on Report Configuration tab.
-
Change Report Type to mixed reports .
-
Click Save
-
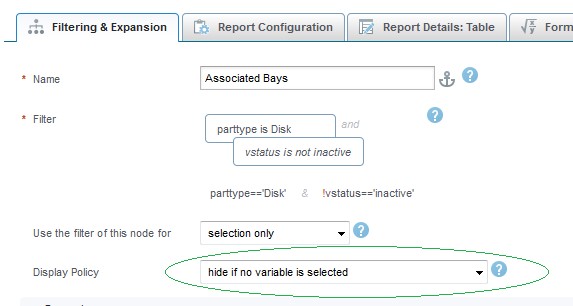
Navigate to All>>My Reports>>Nodes with History>>device,node>>Associated Bays and click on the Filtering & Expansion tab.
-
Replace Display Policy to hide if no variable selected .
-
Click Save
-
Repeat step 21 23 for Associated Interfaces report and Associated File Systems report.
-
Click Browse Mode
-
Navigate to the report: All>>My Reports>>Nodes with History.
-
Click the Display menu and modify the display settings to a time period that includes pre and post upgrade data.
-
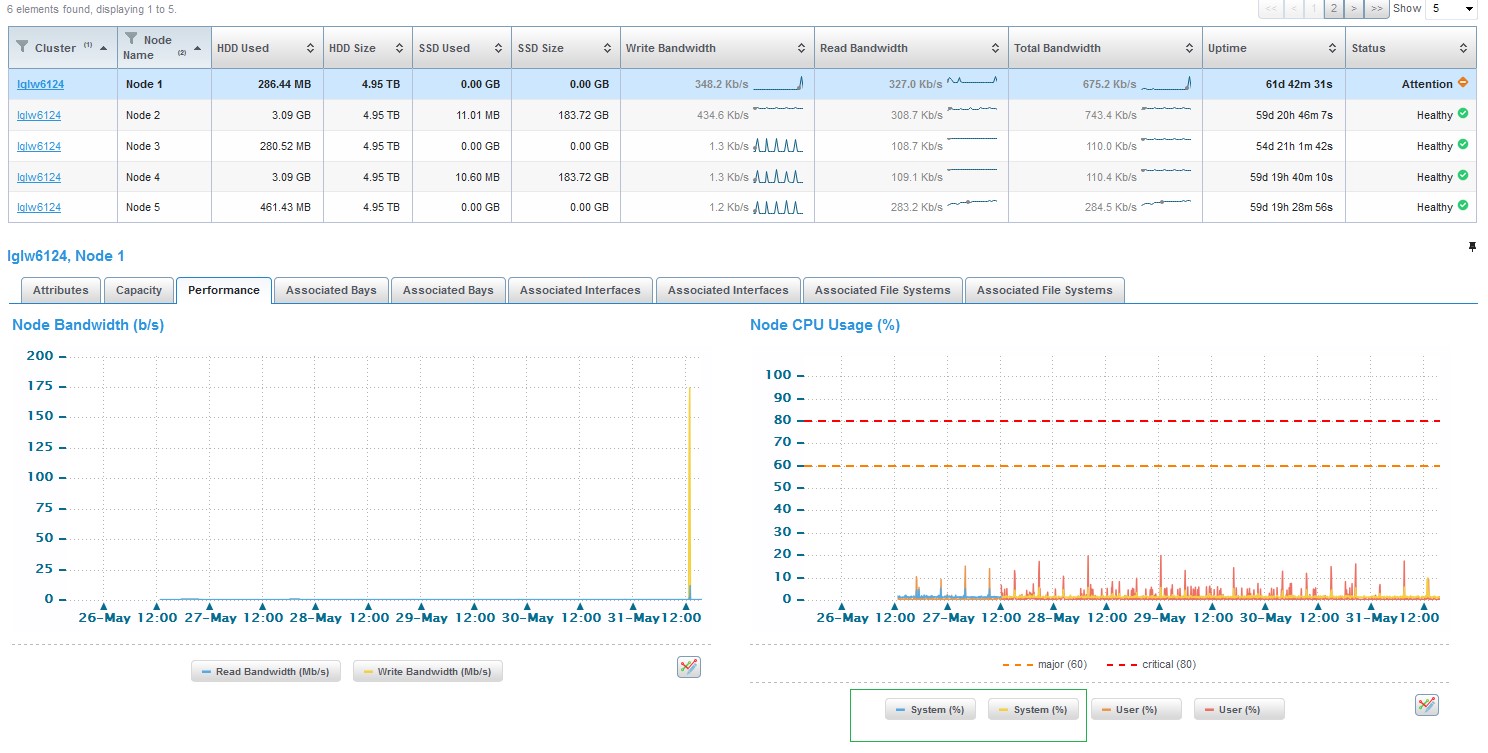
The reports should now display pre and post upgrade data.
-
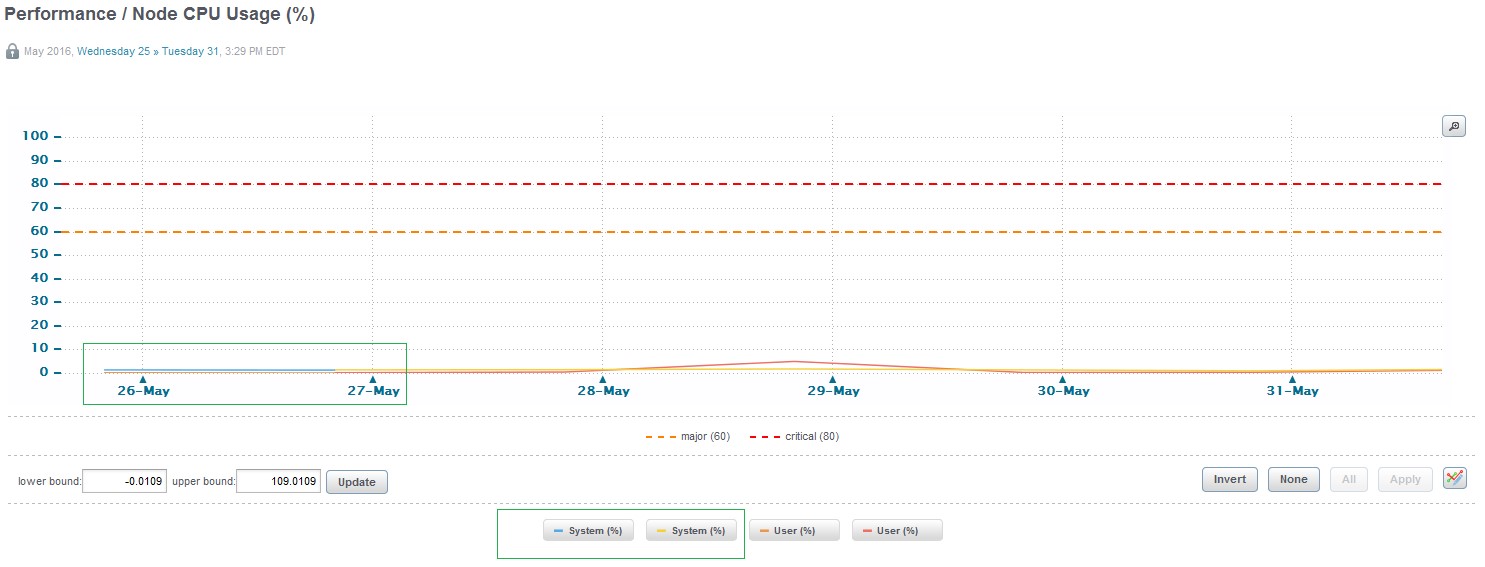
Please note that historical data in charts might show in different color in some cases (please see Node CPU Usage below):
Affected Products
SRMArticle Properties
Article Number: 000065768
Article Type: Solution
Last Modified: 21 جمادى الآخرة 1447
Version: 4
Find answers to your questions from other Dell users
Support Services
Check if your device is covered by Support Services.