How to Use Windows Reliability Monitor to Identify Software Issues
Summary: Windows Reliability Monitor is a Windows application that assists you in the identification of software issues.
This article applies to
This article does not apply to
This article is not tied to any specific product.
Not all product versions are identified in this article.
Instructions
What is the Windows Reliability Monitor?
Windows Reliability Monitor helps identify software issues affecting system performance and reliability.
Windows Reliability Monitor is located inside the Windows Control Panel under System and Security\Security and Maintenance (See Figure 1).
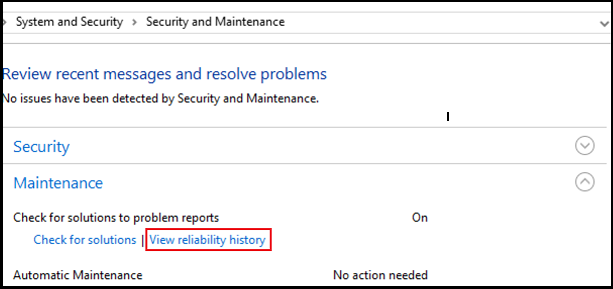
Figure 1. - Windows Reliability Monitor
You can also access the Reliability Monitor through the Windows search box from the Start Menu. Type the magic letters "reliab" (without quotation marks) and click View reliability history. (See Figure 2.)
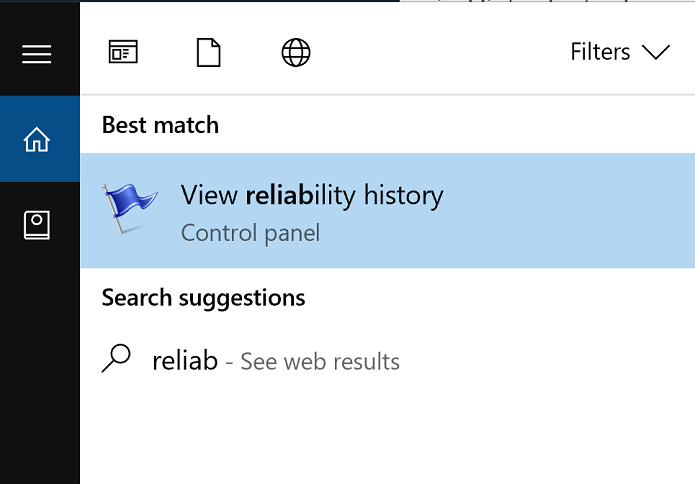
Figure 2. - Reliability Monitor on the start menu search
The third option for starting Reliability Monitor is by opening up the Windows Run Box (Windows Key + R) and type the command: perfmon /rel then press the Enter key.
This feature was originally intended for system administrators (admins) running Windows Server 2008, not on Windows user based systems. This may explain why the tool is relatively unknown and is underutilized.
What does it look like? (See Figure 3.)
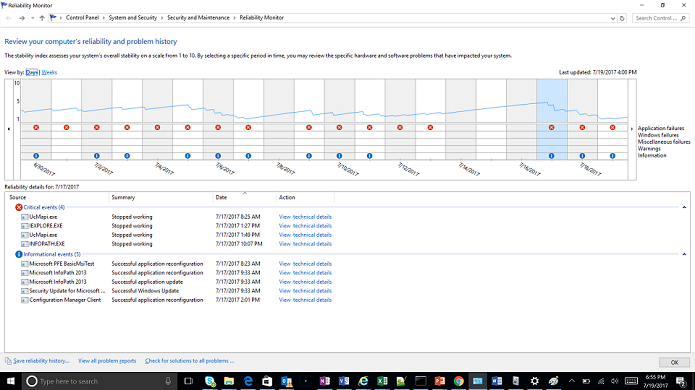
Figure 3. - The Reliability Monitor Interface
How does it work?
Like a car monitors performance metrics, Windows tracks system state from login to shutdown.
Critical system components (memory, data drives, fans, and CPU) are constantly probed and the results are collected in Performance Counters. System and app events (as in Outlook activity, Word document access) are tracked and saved as event trace data. For information about Windows event logs and how to export them, see KB article How to Export Windows Event Logs.
Performance Monitor uses counters and events to visually summarize key system performance data (See figure 4).
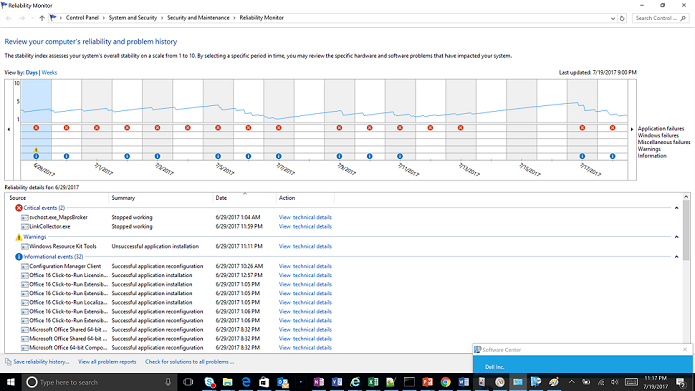
Figure 4. - Investigating events in the Reliability Monitor.
Each column shows a date (day or week, based on the 'View By' setting) with events listed below by severity—Critical first. Warning, Information - in order of occurrence. This system shows two critical events on June 29, MapsBroker and LinkCollector are both crashing at some point. We need additional information about what either application does, or if it has any decencies. Now let us click the View technical details link in the Action column: (See Figure 5.)
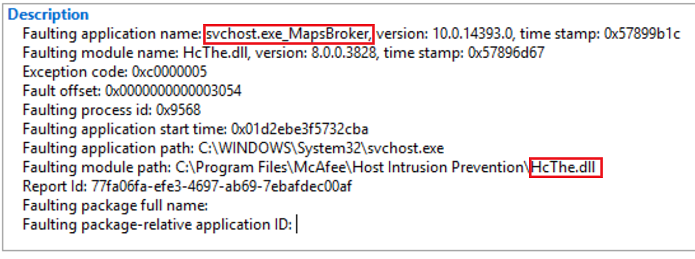
Figure 5. - Investigation of faulting applications.
A quick search for svchost.exe_MapsBroker finds an article from McAfee  outlining that the issue was resolved in McAfee Antivirus version 10.1.2. If I can update to this or a newer McAfee product version, is the issue with McAfee solved?
The second entry is a bookmark manager app (LinkCollector) an older application that is used by the user for several years. Let us see what we can learn from the details view: (See Figure 6.)
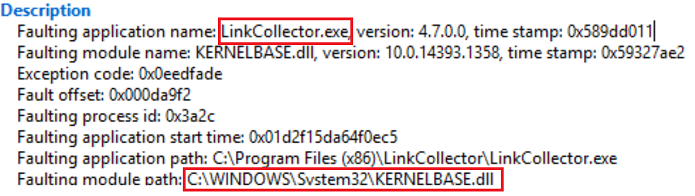
Figure 6. - Linkcollector details
Investigating the details, Kernelbase.dll is faulting launching the LinkCollector executable. If this is a problem file? Let us take a closer look at Kernelbase.dll. Based on its name and location, the file appears to be a legitimate part of the Windows 10 kernel. But, we want to be on the safe side (See Figure 6).
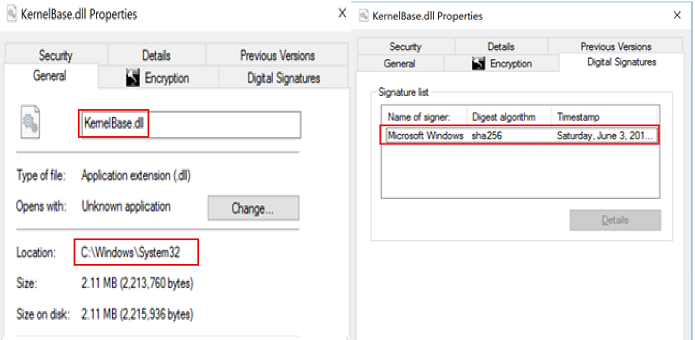
Figure 6. - Checking faulting module digital signature
The file checks out, and carries a proper signature from Microsoft.
NOTE: The Windows Kernel does not create application crashes as kernel and user apps like LinkCollector or Outlook run in different system spaces. When Windows Kernel files appear in such scenarios, as in in minidump files, the culprit lies in the application itself, or an add-on the app is using.
Now it is time to investigate LinkCollector. Further investigation with the user indicated that the application was purchased over six years ago in 2011 and it probably ran without issues under Windows 7.
Investigating the startup of the LinkCollector application the start was slow and sluggish and the application could not deal with the 4K screen resolution on the system being troubleshot.
What is the next step? Windows Compatibility Troubleshooter! (See Figure 7.)

Figure 7. - Running Windows troubleshooter.
Changing compatibility to Windows 7 and disabling high DPI scaling resolved the crash (See Figure 8).

Figure 8. - Using compatibility mode options to resolve issues with older programs.
Affected Products
Alienware, Inspiron, Legacy Desktop Models, OptiPlex, Vostro, XPS, G Series, G Series, Alienware, Inspiron, Latitude, Vostro, XPS, Legacy Laptop Models, Fixed Workstations, Mobile WorkstationsArticle Properties
Article Number: 000178177
Article Type: How To
Last Modified: 21 Jul 2025
Version: 8
Find answers to your questions from other Dell users
Support Services
Check if your device is covered by Support Services.