PowerMax and VMAX All Flash: Storage Resource Pool (SRP) Effective Used Capacity threshold alert.
Summary: This article describes an email alert when the Effective Used Capacity in an SRP surpasses a consumption threshold. The email alert generates from an array dial home. The dial homes generate when the Effective Used Capacity surpasses 80%, 90%, 95% or 99% capacity. ...
This article applies to
This article does not apply to
This article is not tied to any specific product.
Not all product versions are identified in this article.
Symptoms
Email received from Symmetrix.047xErrorReport@EMC.COM.
Effective Used Capacity surpasses a predefined threshold.
Effective Used Capacity surpasses a predefined threshold.
Cause
The Storage Resource Pool or SRP is a combination of the Compressed and Uncompressed data pools in the array. The Effective Used Capacity metric is a measure of both the physical consumption of data space in the back-end, and the data reduction efforts of the system. Alert dial homes generate from the array when this metric reaches thresholds of 80%, 90%, 95%, and 99%. These alerts are emailed to customer contacts so that additional monitoring or actions may be taken.
Note: If the Effective Used Capacity falls below one of the thresholds, the alert system is reset to the next highest threshold. As an example: the Effective Used Capacity surpasses 90%, and creates an alert. Then it goes under 90%. The threshold is reset to 90%.
Note: If the Effective Used Capacity falls below one of the thresholds, the alert system is reset to the next highest threshold. As an example: the Effective Used Capacity surpasses 90%, and creates an alert. Then it goes under 90%. The threshold is reset to 90%.
Resolution
Review the Effective Used Capacity of the reported SRP. Either additional monitoring is needed, or actions need to be taken tor reduce the SRP consumption.
Monitoring or Viewing:
Unisphere:
Unisphere 9.2.2 or later.
Unisphere 9.2.1.3-2622 or earlier:
Solutions Enabler:
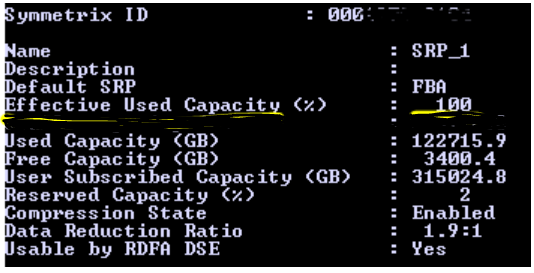
Issue symcfg -sid <sn> show -srp SRP_x -detail, where <sn> is the last 3 or 4 digits of the array serial number. x is the SRP number provided in the alert email. An example output is shown below where the value is at 100%:
What To Do:
SRP between 80 and 90%:
Additional monitoring of the SRP is warranted using the above methods. In addition, if Alerting in Unisphere is not enabled, you are not receiving important notifications for the SRP growth. For details on how to set alerts, visit the Unisphere online help page, here: https://dl.dell.com/downloads/DL102709_921_U4P_olh.zip?language=en_US
SRP between 90 and 95%
Very close monitoring of the SRP is warranted. Monitoring of the growth trend in the SRP is highly advised.
If performing database or app migrations or planning on doing so, close consideration of the consumed logical space of that database or app should be done.
Consider the following for decreasing the SRP consumption:
The Reserve Capacity (RC) threshold is 10% by default.
Depending on the RC threshold value set in the array, the SRP usage might be over the threshold. If it is, the following may occur.
Monitoring or Viewing:
Unisphere:
Unisphere 9.2.2 or later.
- From the Home display, click on the array Serial Number link in the array box to navigate to the array dashboard page.
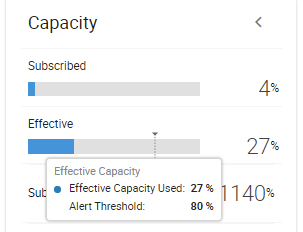
- The dashboard page will provide two ribbons, Subscribed and Effective, with percentages of each, with one of them being the Effective Used Capacity ribbon. Using the mouse over the ribbon will provide more details including the current Alert Threshold. An example is provided below showing the metric at 27% with a threshold of 80%:
- Further details about the Effective Used Capacity and the SRP can be seen by clicking on the Capacity button at the top of the dashboard.
Unisphere 9.2.1.3-2622 or earlier:
- From the Home display, click on the array Serial Number link in the array box to navigate to the array dashboard page.
- From the left-hand menu, select Storage -> Storage Resource Pools.
- In the window, click the check mark for the SRP in question. The SRP will be shown as SRP_x where x is the SRP number from the alert email.
- The Effective Used Capacity value is shown as a percentage in the details box on the right-hand side of the screen.
- From the menu bar on the left, click on Inventory -> Systems. A list of systems will be shown on the main display. Click on the serial number link to navigate to the asset dashboard.
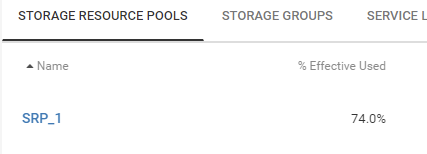
- The Effective Used Capacity of the Storage Resource Pools is shown under the Configuration tab. The percentage used is the first metric on the Storage Resource Pools display. The below example shows the Effective Used Capacity as 74%.
- By clicking on the SRP name in blue, it will take you to SRP capacity page and a capacity forecast graph. This graph predicts when the SRP will be full, based on the historical usage of the SRP.
Solutions Enabler:
Issue symcfg -sid <sn> show -srp SRP_x -detail, where <sn> is the last 3 or 4 digits of the array serial number. x is the SRP number provided in the alert email. An example output is shown below where the value is at 100%:
What To Do:
SRP between 80 and 90%:
Additional monitoring of the SRP is warranted using the above methods. In addition, if Alerting in Unisphere is not enabled, you are not receiving important notifications for the SRP growth. For details on how to set alerts, visit the Unisphere online help page, here: https://dl.dell.com/downloads/DL102709_921_U4P_olh.zip?language=en_US
SRP between 90 and 95%
Very close monitoring of the SRP is warranted. Monitoring of the growth trend in the SRP is highly advised.
If performing database or app migrations or planning on doing so, close consideration of the consumed logical space of that database or app should be done.
Consider the following for decreasing the SRP consumption:
- Consider lowering the amount of SnapVX Snapshots or Timefiner Clone sessions in use. If using self-expiring snapshots, consider lowering the duration of the snapshots.
- If running SRDF/A sessions, review the system to see if Delta Set Extension (DSE) is in use. Consider reducing the amount of space that DSE can consume in the SRP.
- Review and delete unneeded Thin devices (TDEVs) if they consume space on the SRP.
- Add additional back-end capacity to the system.
The Reserve Capacity (RC) threshold is 10% by default.
Depending on the RC threshold value set in the array, the SRP usage might be over the threshold. If it is, the following may occur.
- Existing SnapVX snapshots may fail. They fail on the next protected track intercept asking for a new allocation to the SRP.
- New SnapVX Snapshots are rejected and fail to establish.
- SRDF Adaptive Copy migrations may stall.
- Extent-based copy operations like Storage vMotions, XCOPY, or ODX may stall.
If these operations need to be continued while the SRP is in this consumption range, consider lowering the RC value.
SRP above 95%:
Immediate attention is required! The system is danger of becoming full.
Performing migrations to the system should be discouraged unless close attention is paid to the projected logical consumption of the database or app.
In addition, possible performance penalties may occur due to the system using Synchronous Allocation mode. Synchronous Allocation couples the host IO to the time it takes to find and allocate new space into the SRP. Prior to 95% usage, the system runs in Asynchronous allocation mode where the allocation is performed in the background after the IO is acknowledged to the host.
Additional Information
See the following whitepaper for additional information on SRPs, Effective Used Capacity and the data reduction efforts:
http://www.dellemc.com/en-us/collaterals/unauth/technical-guides-support-information/products/storage/h17072-data-reduction-with-dell-emc-powermax.pdf
These email alerts are triggered by the array. It is independent of any Unisphere or CloudIQ alerting mechanisms.
http://www.dellemc.com/en-us/collaterals/unauth/technical-guides-support-information/products/storage/h17072-data-reduction-with-dell-emc-powermax.pdf
These email alerts are triggered by the array. It is independent of any Unisphere or CloudIQ alerting mechanisms.
Affected Products
PowerMax, PowerMax 2000, PowerMax 8000, VMAX 250F, VMAX 450F, VMAX 850F, VMAX 950F, VMAX All FlashArticle Properties
Article Number: 000190439
Article Type: Solution
Last Modified: 23 Aug 2022
Version: 5
Find answers to your questions from other Dell users
Support Services
Check if your device is covered by Support Services.