VxRail: vCenter shows "High pnic rx generic error rate detected" or "High pNic error rate detected" warnings
Summary: vCenter showing "Warning: High pnic rx generic error rate detected on vmnicX" and "High pNic error rate detected, Check the host's vSAN performance view for details" warning messages.
This article applies to
This article does not apply to
This article is not tied to any specific product.
Not all product versions are identified in this article.
Symptoms
There are two different issues for this message that must be treated differently.
Issue 1: vCenter web client shows the below message for multiple hosts. The vmnic in the warning can be any vmnic that the hosts connect to the network.
This is different from issue 2 (mentioned in the following). The vmnic in the alarm of issue 2 only is the Active and (or) Standby vmnic of vSAN.
Warning: High pnic rx generic error rate detected on vmnicX.
When running the following command on the ESXi host, users see a lot of rx (Receive) length errors and the error keeps growing. This triggers the warning.
Replace the 'X' with the proper vmnic number.
esxcli network nic stats get -n vmnicX

vmnic0
Packets received: 2611289
Receive length errors: 279662
Multicast packets received: 529478
Broadcast packets received: 512315

vmnic1
packets received: 5812398
Receive length errors: 279518
Multicast packets received: 538956
Broadcast packets received: 427913
All vmnics in the host have almost identical Receive length error counts. This means that Multicast packets received or Broadcast packets received contribute to Receive length errors.
Multicast packets are flooded in the same VLAN, as broadcast packets usually are.
We can calculate the ratio of receive length error and broadcast packets, or the ratio of receive length error and multicast packets and then compare them with other nodes.
Even on different nodes, the percentage of receive length errors caused by multicast or broadcast is nearly the same.
To troubleshoot Issue 1, capture packets in the vmnic:
- SSH to the node
- Run the below command: (Replace the
vmnicXwith thevmnicthat received length error)pktcap-uw --uplink vmnicX --dir 2 -o /tmp/lengtherror.pcap
- Capture the error uplink packets, and stop with ctrl+c.
- Download the
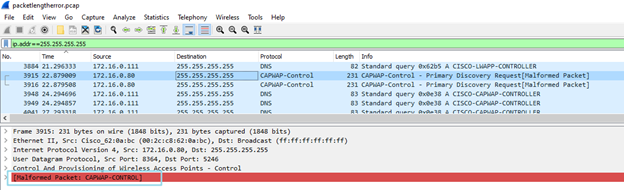
.pcapfile to the local desktop and open it with Wireshark. - For broadcast packets Filter:
ip.addr == 255.255.255.255 - For multicast packets Filter:
eth.dst == ff:ff:ff:ff:ff:ff - Try to find the
Malformed Packetfrom the filter result. - Occasionally this filter works (only on Wireshark 4.0.12):
((eth.len != frame.len - 14) || eth.len != frame.len - 18)
Issue 2:
The alarm is named.
High pNic error rate detected Check the host's vSAN performance view for details.
When the user checks the host's vSAN performance view, they can find that the vmnic mentioned in the alarm is always the Active or (and) Standby vmnic of vSAN traffic.
Most of the time, the vmnic is the standby of the vSAN.
This alarm is involved from vSphere 7.0U2.
See: https://knowledge.broadcom.com/external/article/312096/alarm-about-high-pnic-error-rate-being-d.html
The following table shows the metrics for pNICs used for vSAN that are monitored and their alarm thresholds:
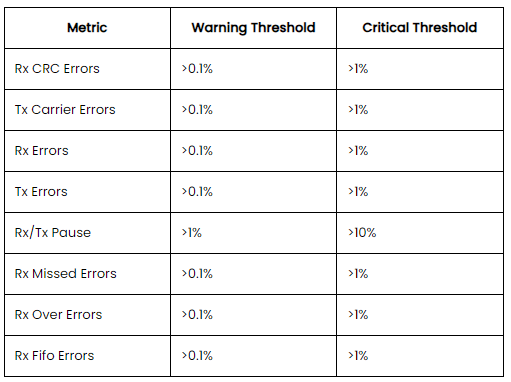
Those types of errors may impact the vSAN performance.
Cause
Issue 1:
In this instance, a packet capture shows a Cisco Access Point (AP) controller sending CAPWAP-Control packets.
The Wireshark marks them as a Malformed Packet.
ESXi usually cannot handle this kind of package either.
If Wireshark encounters a packet that does not conform to the expected structure of the protocol during its analysis, it marks the packet as Malformed. This typically indicates that the packet may have been corrupted during transmission, or it represents an unusual or incorrect implementation of a protocol.
The following filter may provide another type of output (because frame length is not supported) and can also cause the received length error.
However, it is not accurate, so before submitting the report to the customer, more analysis must be done on the output of this filter.
((eth.len != frame.len - 14) || eth.len != frame.len - 18)
Issue 2:
VMware introduced this alarm to monitor the errors that may impact vSAN performance.
An alarm is triggered to mention to the user that the vSAN performance should be addressed when the percentage of the error reaches the special value.
However, it has been observed that the algorithm for alarm triggering may have problems. When calculating the error packet ratio, the number of data packets in the short-term and the total amount of error packets are used.
So, most of the time, the error vmnic is always the standby vmnic of vSAN, because there is less traffic on the vmnic.
Resolution
Issue 1:
- The source IP address was a Cisco AP controller connected to VLAN 1.
- Check the vDS settings of the VxRail cluster to ensure that there is no traffic using VLAN 1.
- Remove VLAN 1 from the TOR switches ports which are connected to VxRail hosts.
- If it is not in the VLAN 1, follow the same steps to remove the VLAN from the switch ports.
- If the VLAN carries the cluster traffic, we cannot remove the VLAN from the switch ports. The user may have to change the network design to isolate the traffic that caused the received length error from the VxRail cluster.
Issue 2:
There are several scenarios to handle this type of issue.
- The
vmnicreporting error is the standbyvmnicof vSAN, and the error packet growth is slow.
This is a false alarm caused by the algorithm and does not affect vSAN performance. We can recommend that customers ignore this alarm, although this alarm reappears from time to time.
- The
vmnicreporting error is the activevmnicof vSAN or standbyvminc, but the error packets continue to grow.
The different types of errors follow different resolutions, we often encounter the alarm caused by CRC error, Received Length error, and Pause Frame received.
-
Received CRC errors on the
vmnic.
See VxRail: High vSAN Latency and CRC Errors on Network NIC Stats -
Received length errors on the
vmnic.
The root cause is the same as Issue 1. You can follow the troubleshooting of Issue 1 for this scenario. -
Pause Frame received on the
vmnic.
Pause Frame is used for network flow control.
Enable flow control Network instability or congestion contributes to low performance in VxRail, and has a negative effect on the vSAN I-O datastore operations.
Flow control is a switch feature that helps manage the rate of data transfer to avoid buffer overrun.
VxRail recommends that flow control isreceive onandtransmit off.
See https://www.delltechnologies.com/asset/en-us/products/converged-infrastructure/technical-support/h15300-vxrail-network-guide.pdf page 88.
How to check whether the switch enables flow control:
Take the Dell switch as an example:
Run the command "show interface ethernet 1/1/1," replacing the switch interface number with the interface connecting the node
S5048-01# show interface ethernet 1/1/1
Ethernet 1/1/1 is up, line protocol is down
Pluggable media present, SFP28 type is SFP28 25GBASE-SR-NOF
    Wavelength is 850
Interface index is 15
Internet address is not set
Mode of IPv4 Address Assignment: not set
Interface IPv6 oper status: Disabled
MTU 1532 bytes, IP MTU 1500 bytes
LineSpeed 0, Auto-Negotiation off
Configured FEC is cl108-rs, Negotiated FEC is cl108-rs
Flowcontrol rx on tx on  ----- tx on means that the flow control is transmit on
How to disable flow control transmit:
S5048-01# configure terminal
S5048-01(config)# interface e1/1/1 ----replace the switch interface number
S5048-01(conf-if-eth1/1/1)# flowcontrol transmit off
Configure all the switch interfaces connected to the vSAN vmnics as transmit off.
Reset the alarm to green and monitor whether the alarm returns.
Affected Products
VxRail, VxRail Appliance Series, VxRail G Series Nodes, VxRail D Series Nodes, VxRail D560, VxRail D560F, VxRail E Series Nodes, VxRail E460, VxRail E560, VxRail E560F, VxRail E560N, VxRail E660, VxRail E660F, VxRail E660N, VxRail E665, VxRail E665F
, VxRail E665N, VxRail G560, VxRail G560F, VxRail P Series Nodes, VxRail P470, VxRail P570, VxRail P570F, VxRail P580N, VxRail P670F, VxRail P670N, VxRail P675F, VxRail P675N, VxRail S Series Nodes, VxRail S470, VxRail S570, VxRail S670, VxRail Software, VxRail V Series Nodes, VxRail V470, VxRail V570, VxRail V570F, VXRAIL V670F, VxRail VD-4510C, VxRail VD-4520C, VxRail VD Series Nodes, VxRail VE-660, VxRail VE-6615, VxRail VE-670, VxRail VP-760, VxRail VP-7625, VxRail VP-770, VxRail VS-760
...
Products
PowerFlex rack, ScaleIOArticle Properties
Article Number: 000191355
Article Type: Solution
Last Modified: 16 Apr 2026
Version: 17
Find answers to your questions from other Dell users
Support Services
Check if your device is covered by Support Services.