Data Domain: How to View Realtime Performance and Statistics Charts in the User Interface
Summary: This article discusses how to use tThe Realtime Charts panel which displays up to seven charts that show real-time subsystem performance statistics, such as CPU usage and disk traffic.
This article applies to
This article does not apply to
This article is not tied to any specific product.
Not all product versions are identified in this article.
Instructions
The Realtime Charts panel displays up to seven charts that show real-time subsystem performance statistics, such as CPU usage and disk traffic.
File System Operations and Network:
Network and Replication:
Capacity statistics charts:
Use the Date Range options to select a date range to display on the chart. Choose from one of the preconfigured time periods, or specify specific dates to view. Customize any chart by selecting or clearing the available labels.
Space Usage chart:
This chart displays a cumulative representation of the quantity of data that is backed up to the system, the amount of deduplication performed on that data, and the amount of space consumed on the system.
The space usage chart uses the following labels:
This chart displays a cumulative representation of the amount of space consumed on the system, and the amount of deduplication performed against the total capacity of the system. Administrators may also view the time lines and durations for system cleaning and data movement operations.
The space usage chart uses the following labels:
This chart displays the amount of data written to the system and the amount of deduplication performed on the system on a daily basis.
The space usage chart uses the following labels:
- Recent CPU
- Usage Disk
- DD Boost Data Throughput
- DD Boost Active Connections
- File System Operations
- Network
- Replication
- Space Usage
- Consumption
- Daily Written
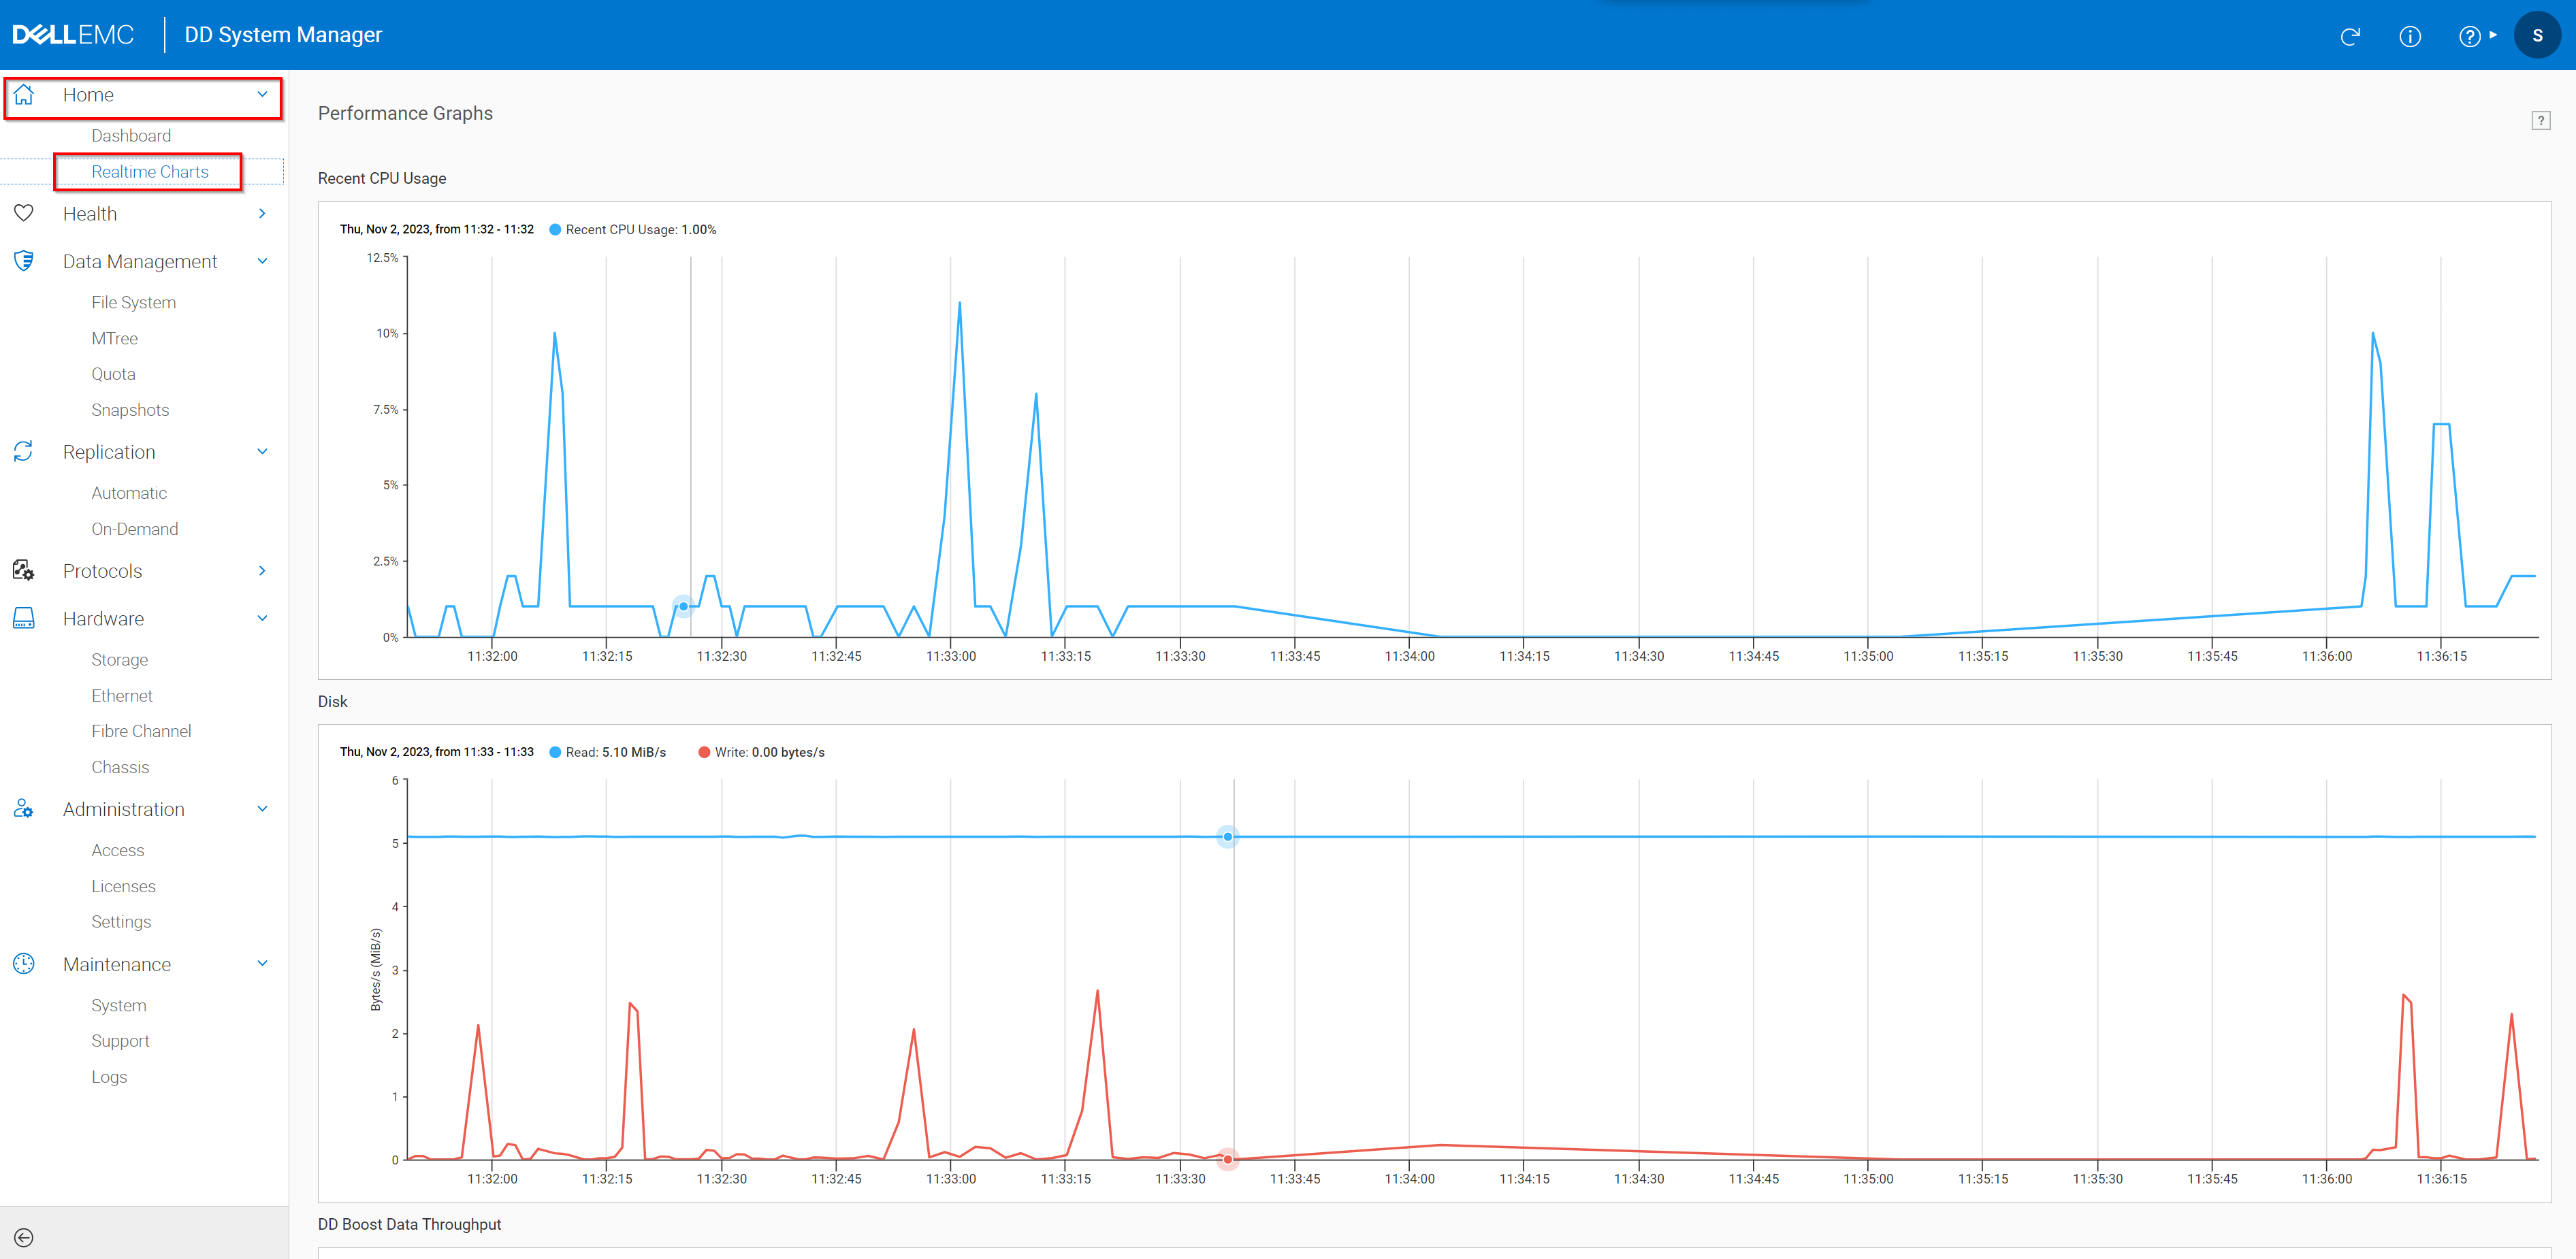
- Select Home > Realtime Charts. The Performance Charts area displays the selected charts. Each chart shows usage over the last 5 to 10 minutes.
- To view specific data-point information, hover over a chart point.
- When a chart contains multiple types of data, you can use the checkboxes in the upper-right corner of the chart to select what to display. For example, if Read is not selected in the upper right of the disk activity chart, only write data is charted.
Figure 1: Recent CPU Usage and Disk data
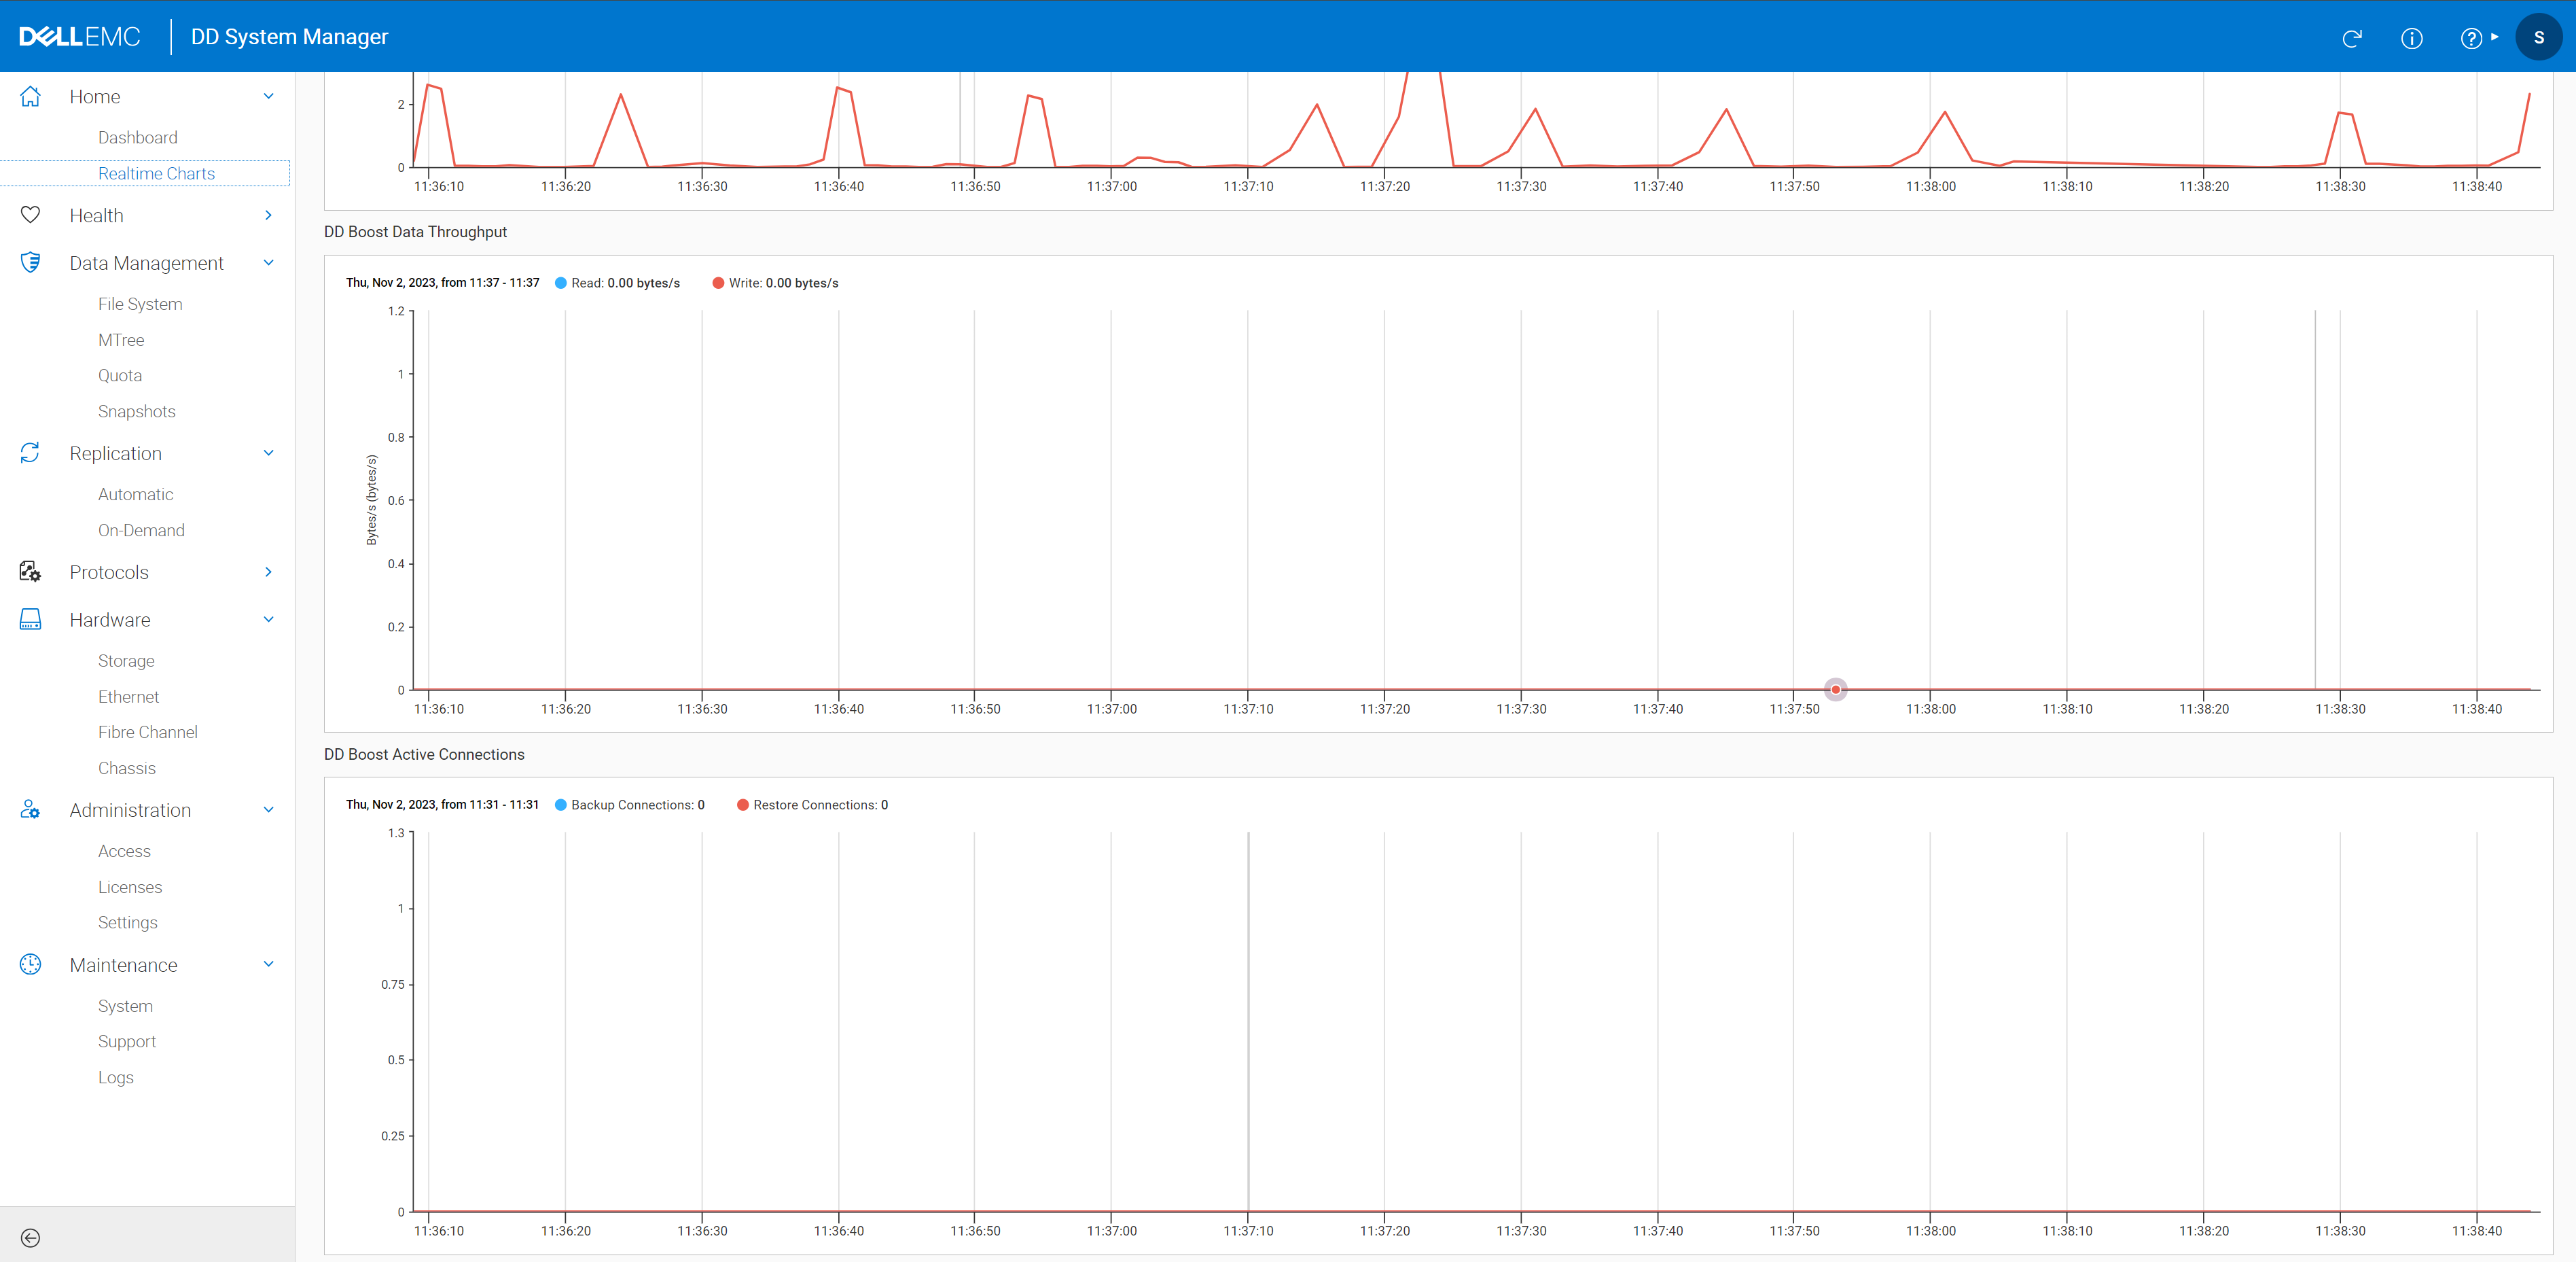
DD Boost Data Throughput and DD Boost Active Connections:
Figure 2: DD Boost Data Throughput and DD Boost Active Connections data
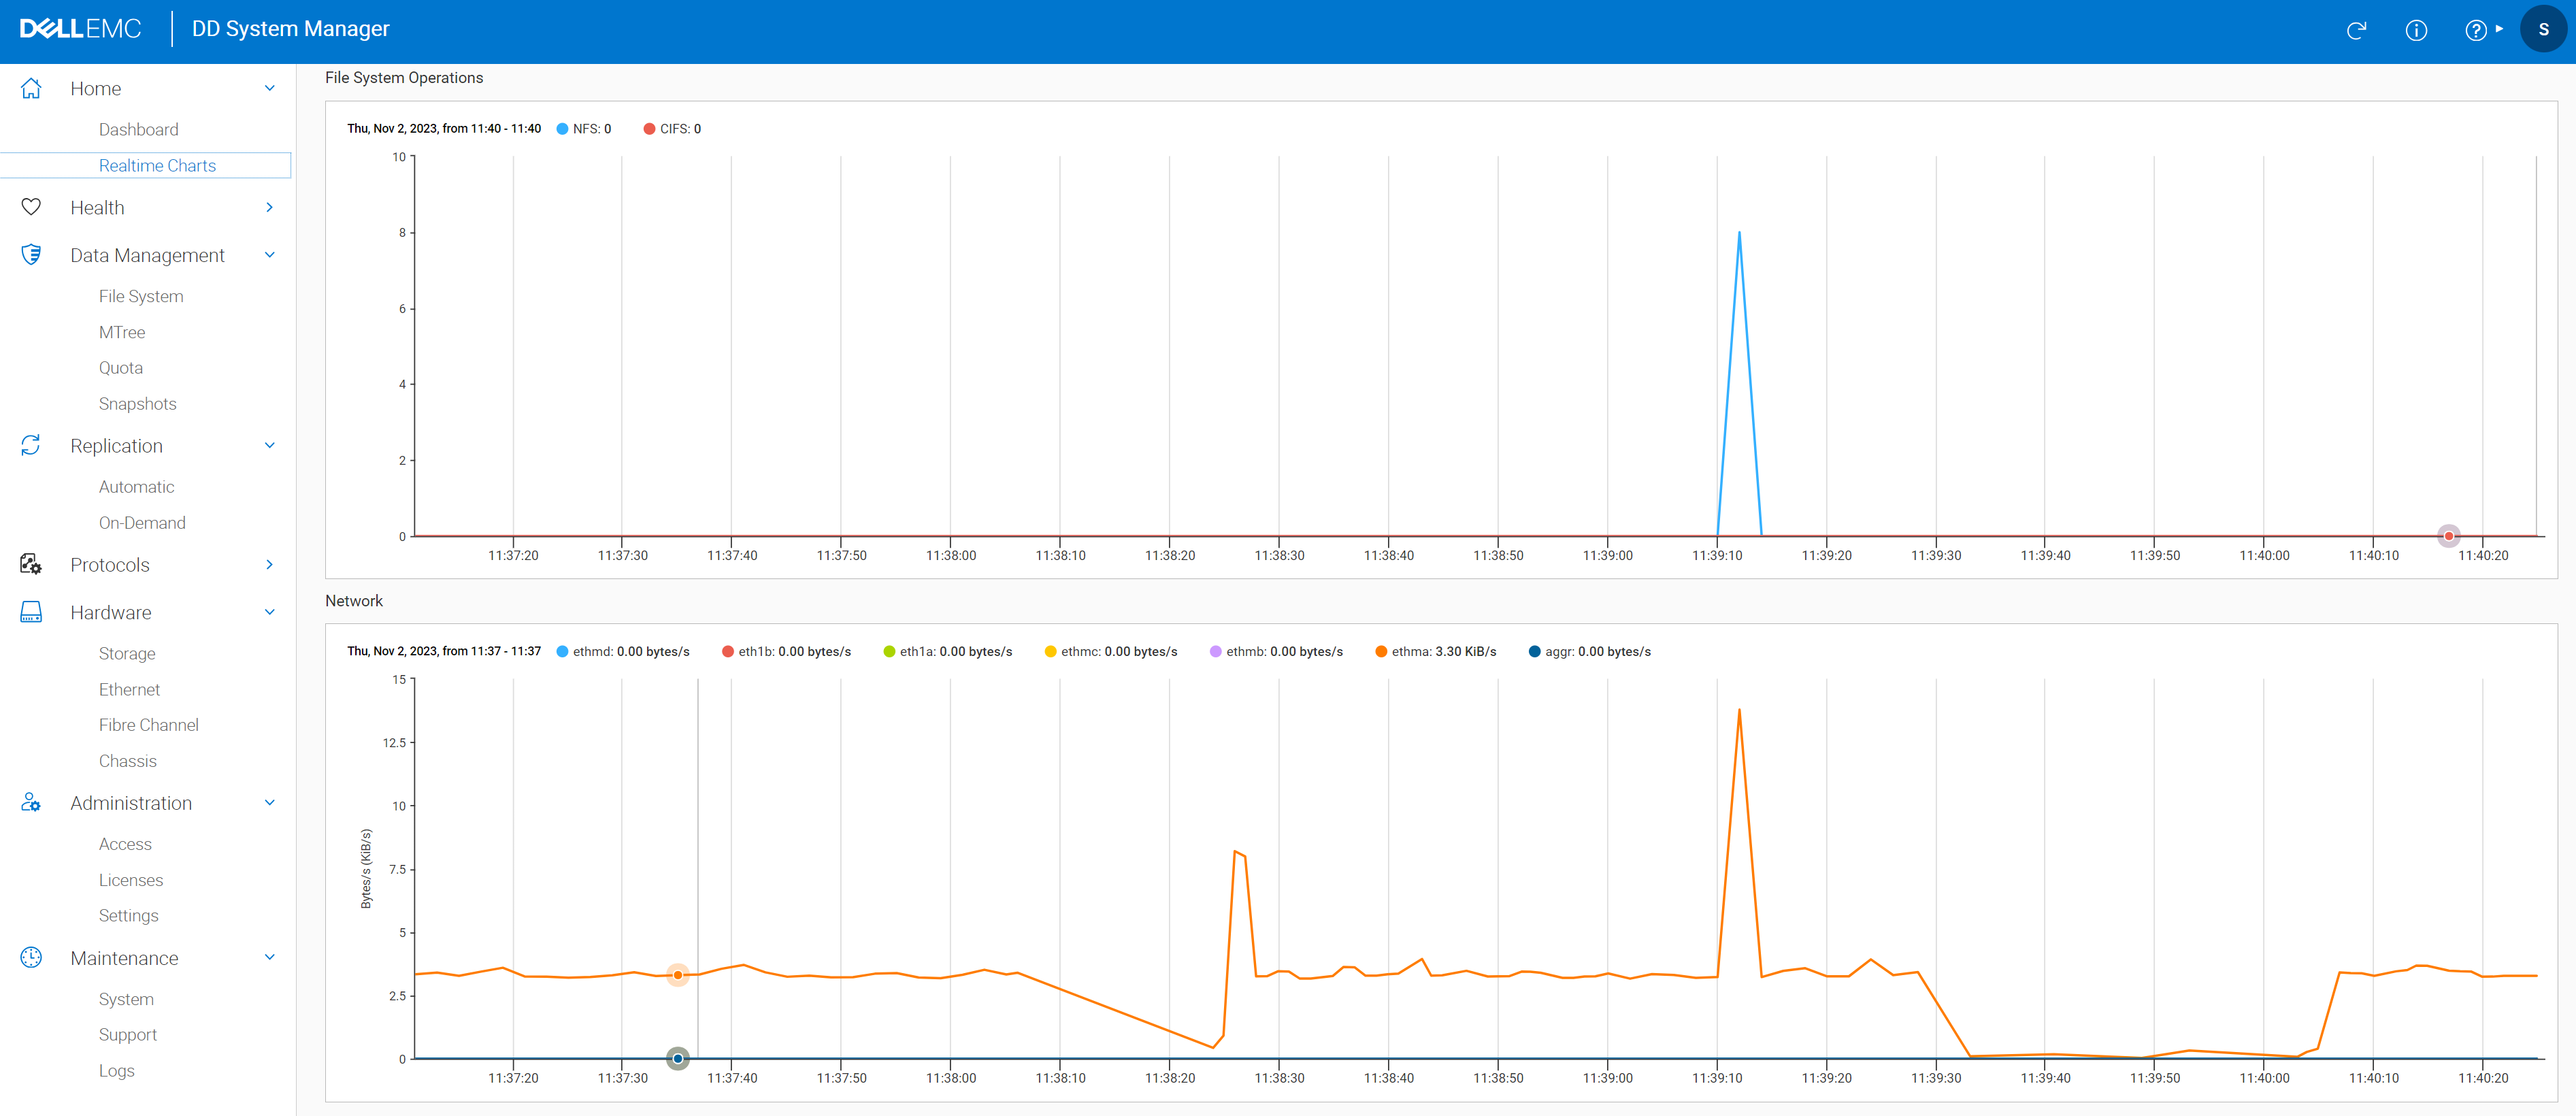
File System Operations and Network:
Figure 3: File System Operations and Network data
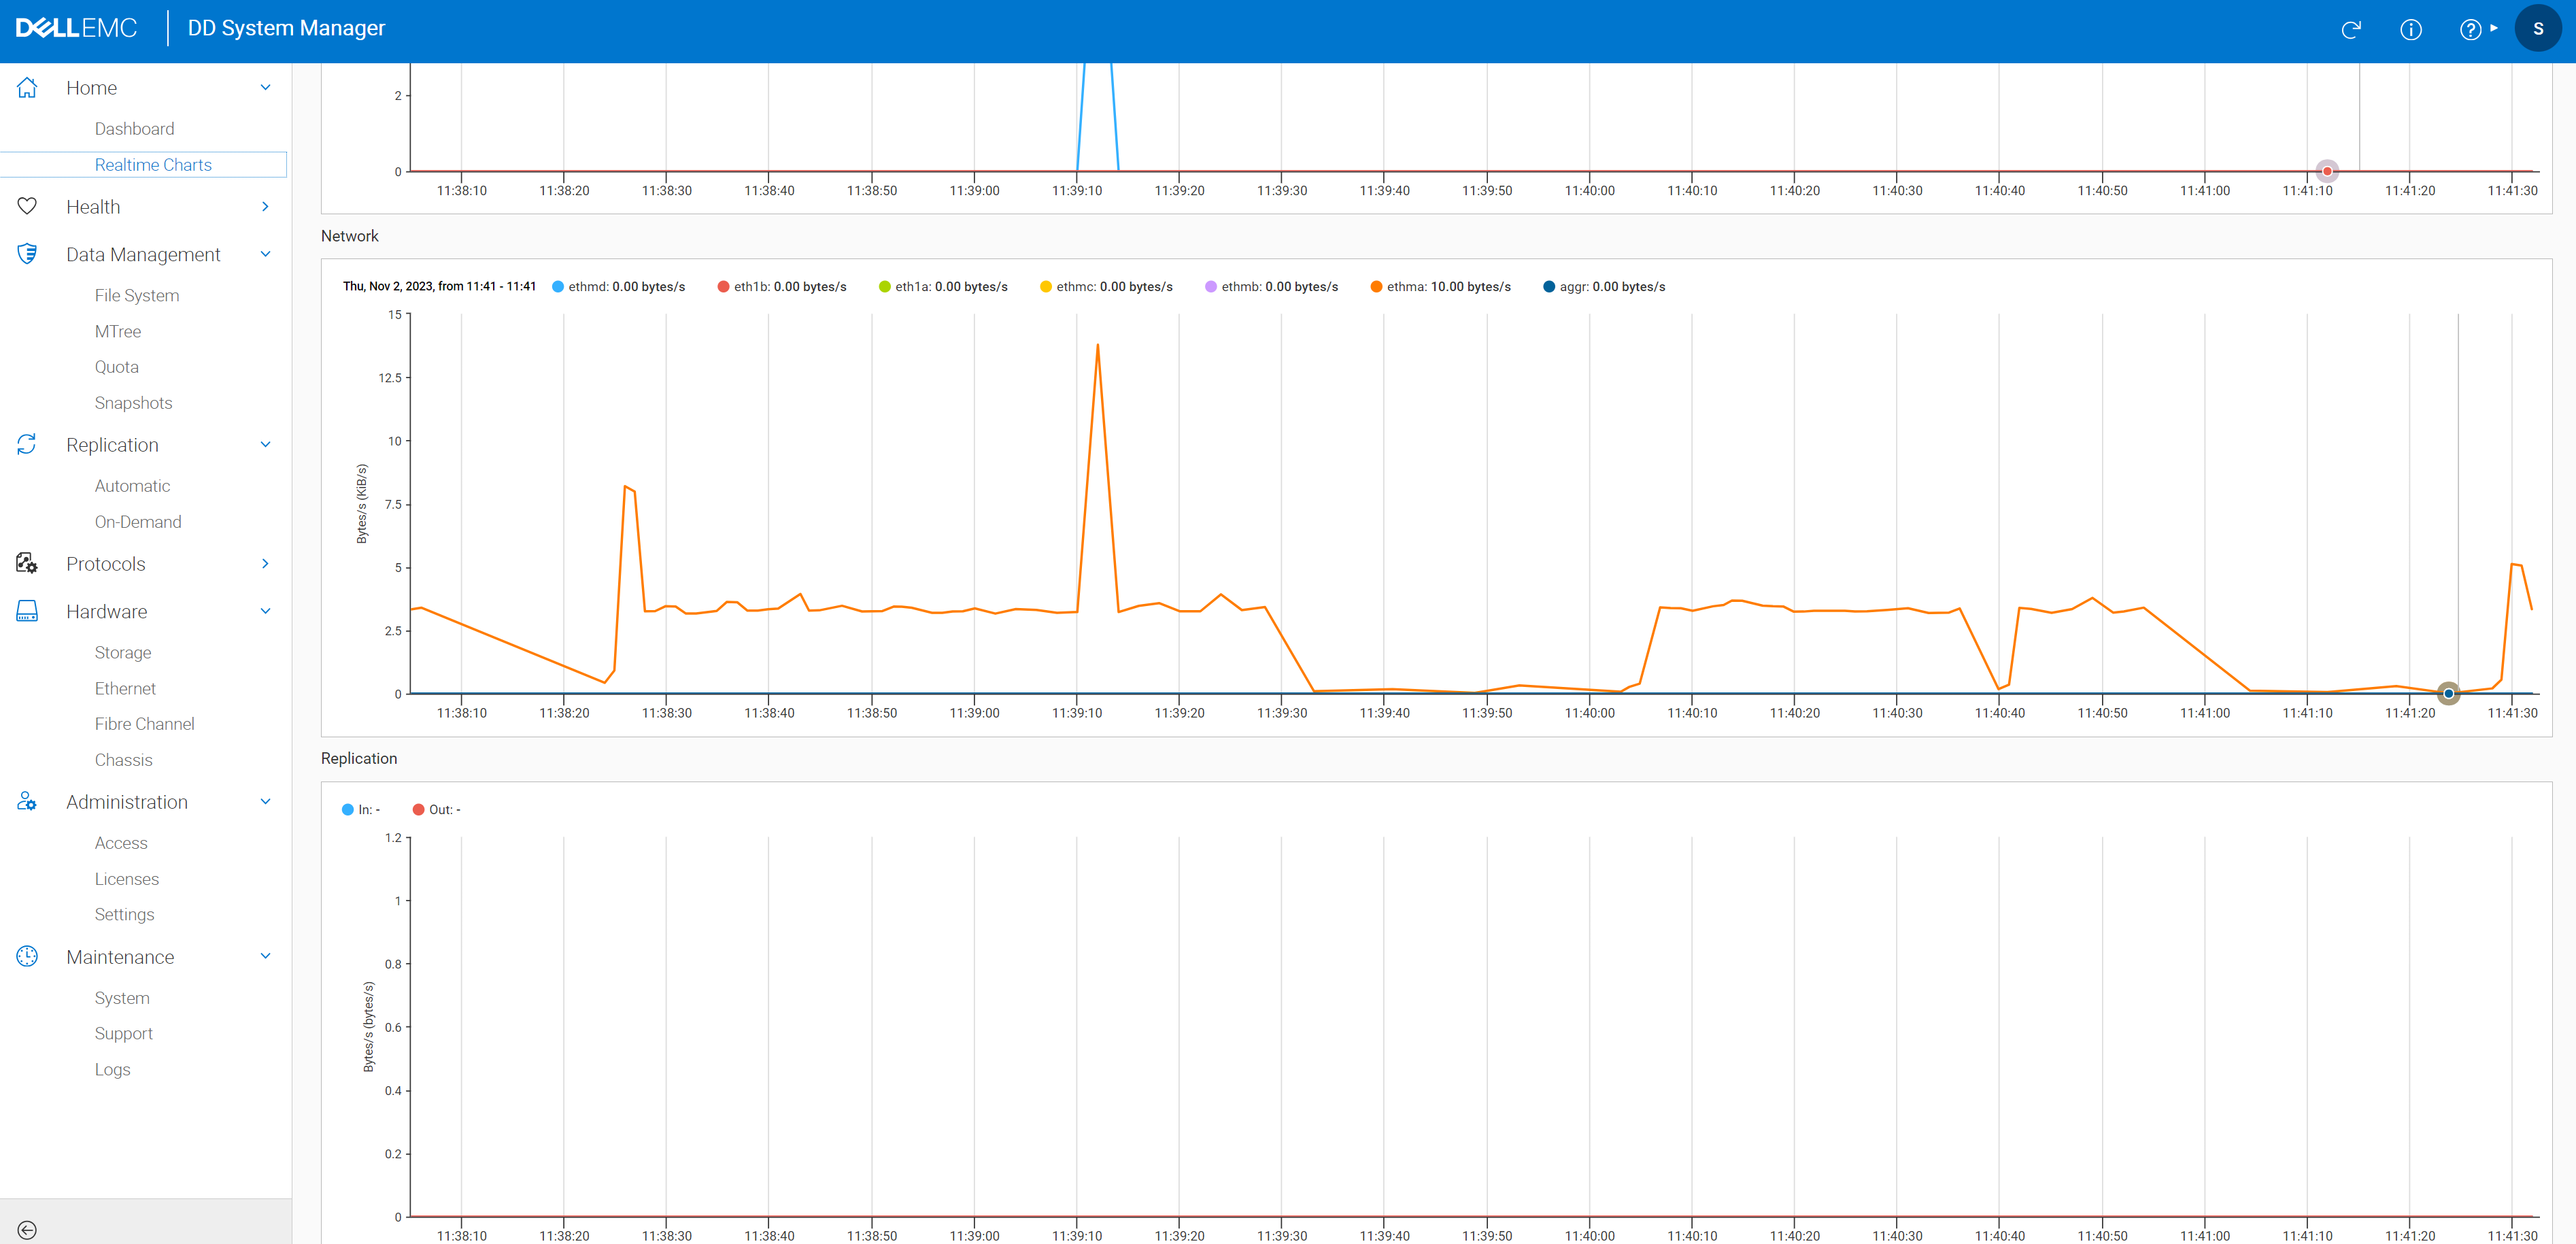
Network and Replication:
Figure 4: Network and Replication data
Capacity statistics charts:
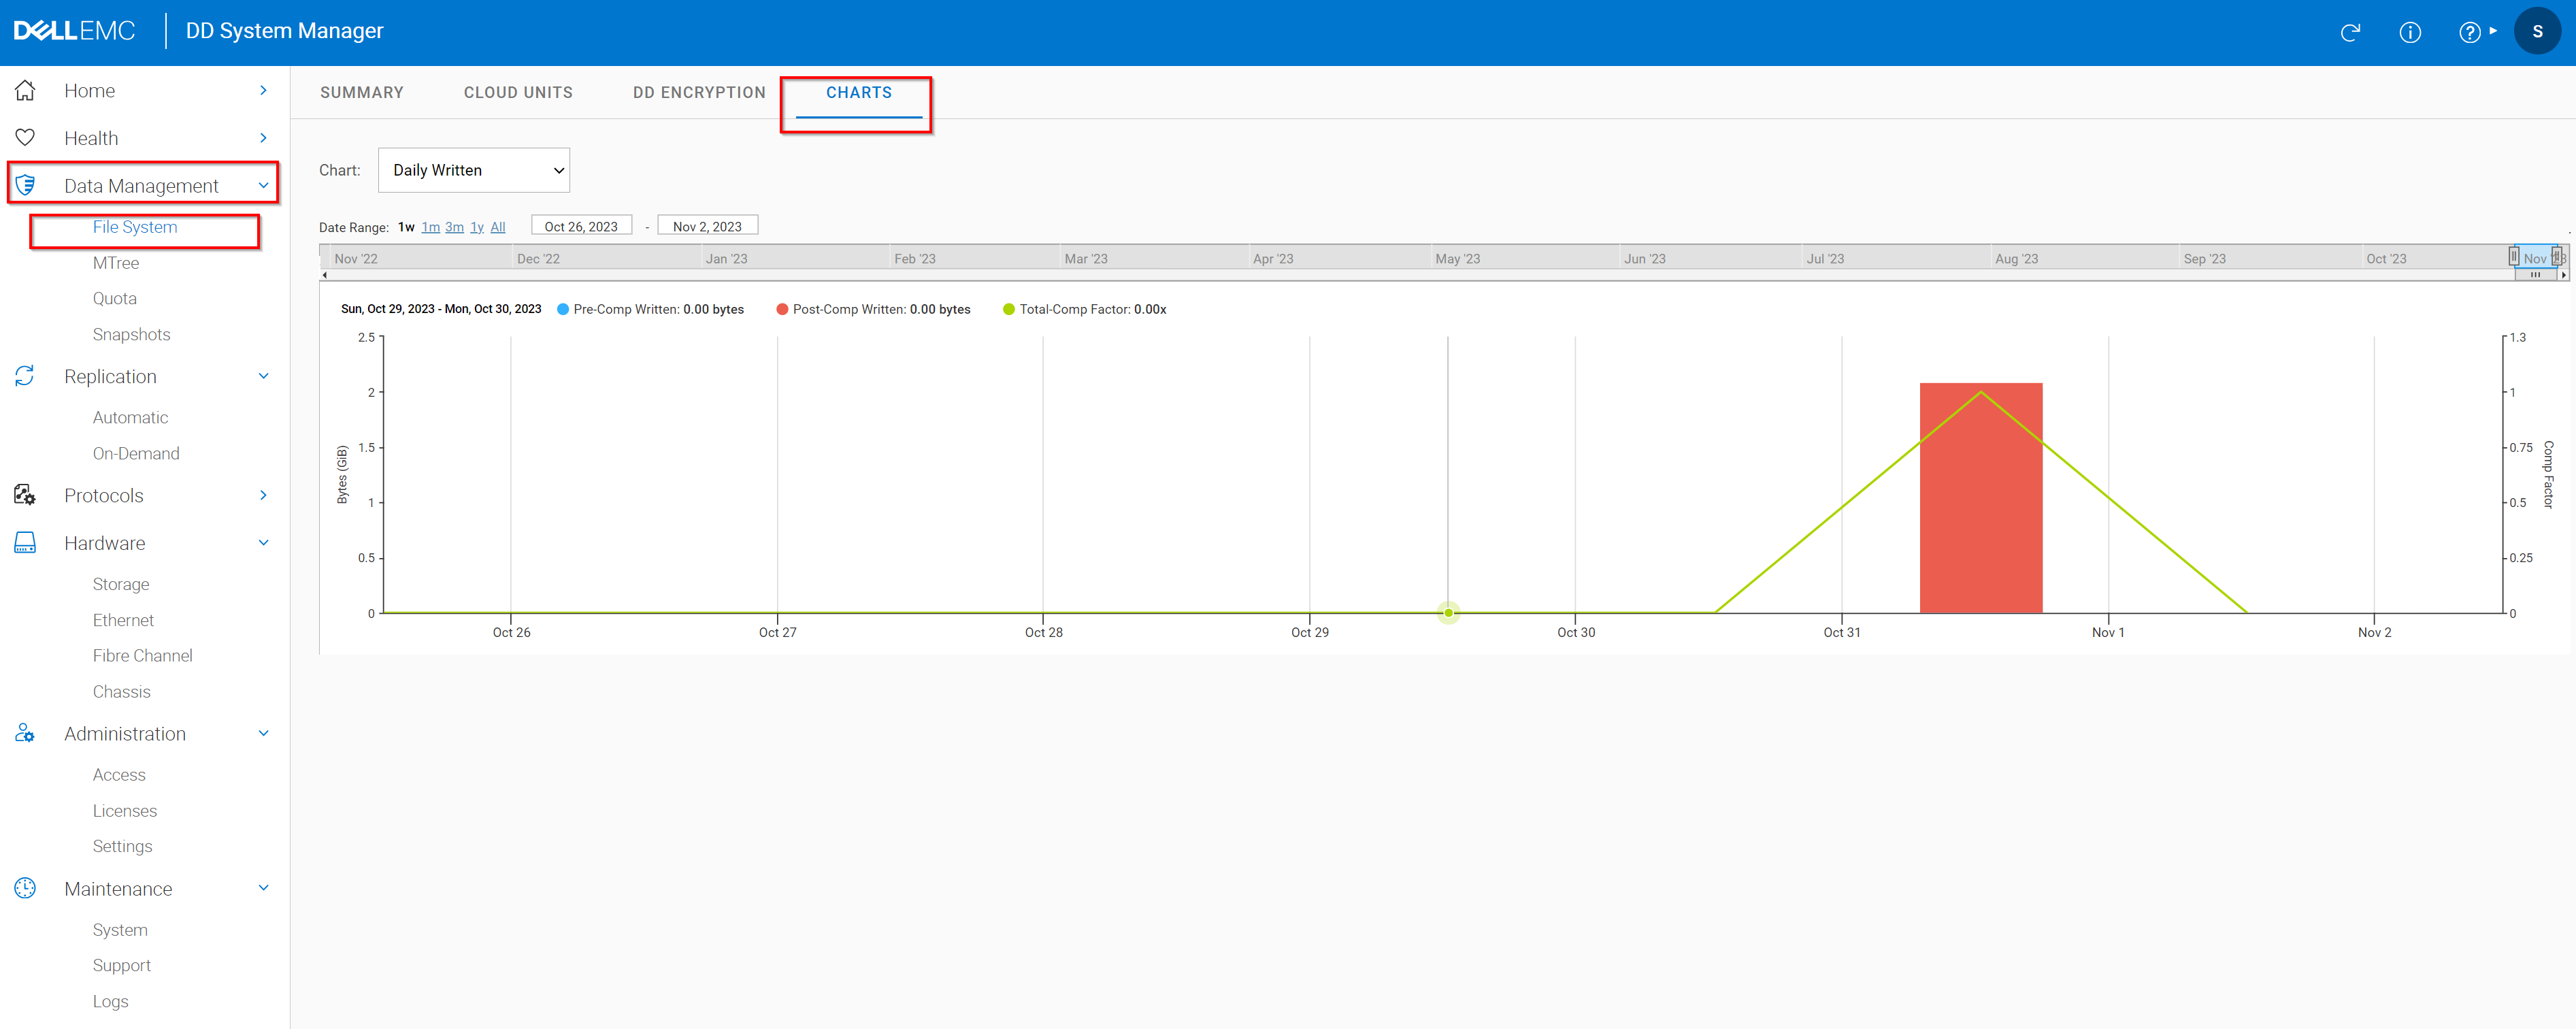
DD System Manager enables you to view statistics for the amount of data backup to the DD system, and the amount of deduplication performed on the system in chart form. Go to Data Management > File System > Charts to view the charts. There are three different charts available:
- Space Usage
- Consumption
- Daily Written
Use the Chart and Scope list boxes to select the parameters for the chart to display.
NOTE: For systems without Cloud Tier, File System is the only available scope. For systems with Cloud Tier, the scope can be File System, Active Tier, or Cloud Tier.
Use the Date Range options to select a date range to display on the chart. Choose from one of the preconfigured time periods, or specify specific dates to view. Customize any chart by selecting or clearing the available labels.
Space Usage chart:
This chart displays a cumulative representation of the quantity of data that is backed up to the system, the amount of deduplication performed on that data, and the amount of space consumed on the system.
The space usage chart uses the following labels:
- Pre-Comp Used - The amount of storage consumed before compression
- Post-Comp Used - The amount of storage consumed after compression
- Comp Factor - The compression ratio
This chart displays a cumulative representation of the amount of space consumed on the system, and the amount of deduplication performed against the total capacity of the system. Administrators may also view the time lines and durations for system cleaning and data movement operations.
The space usage chart uses the following labels:
- Capacity - The total capacity of the system
- Post-Comp Used -The amount of storage consumed after compression.
- Comp Factor - The compression ratio
- Cleaning - The time lines and duration of system cleaning operations.
- Data Movement - The time lines and duration of data movement operations.
This chart displays the amount of data written to the system and the amount of deduplication performed on the system on a daily basis.
The space usage chart uses the following labels:
- Pre-Comp Written - The amount of data written to the system before compression.
- Post-Comp Written - The amount of data written to the system after compression.
- Total Comp Factor - The total compression ratio
Figure 5: Pre-CompWrittenPost-CompWrittenTotalCompFactor
Affected Products
Data DomainArticle Properties
Article Number: 000219177
Article Type: How To
Last Modified: 15 Jan 2026
Version: 4
Find answers to your questions from other Dell users
Support Services
Check if your device is covered by Support Services.