Live Optics | Average Daily Writes
Summary: Live Optics can assist by showing at each layer (disk, server, cluster disk, collector run, and project) the estimated average daily write.
This article applies to
This article does not apply to
This article is not tied to any specific product.
Not all product versions are identified in this article.
Instructions
The three biggest objections to implementing SSDs in an environment are cost, speed, and durability. Luckily, the industry is providing comfort in all three of these categories.
This briefing touches on price and performance, but focuses on durability: specifically, the topic of Drives Writes Per Day (DWPD), which has become a standard for indicating wear or durability expectations of SSD drives.
Price and Capacity
NAND is the underlying technology you will find in USB or SSD “Flash”, and it is being made available at a continuously reduced price. The drivers for this cost reduction are changes in the way NAND is manufactured. Two common practices are (1) increasing the number of bits per cell, resulting in MLC and TLC technology, and (2) what is seen as 3D or V-NAND, which is the technique of vertically stacking those cells. TLC and 3D techniques are often combined to create today’s high-capacity and cost-effective SSD drives.
Performance
While SSD capacity and price benefited from these advancements in manufacturing, performance and durability were challenged by enterprise adoption. There is a major argument about write performance on high bit cell NAND (TLC) SSD due to the longer programming cycles of the TLC NAND. However, the SSD write performance is dominated by the SSD SoC (system on chip) and it is firmware which mitigates of that concern.
Increased capacity has helped overcome this problem as well. Drives are rarely 100% full and firmware can take advantage of that fact to perform a process called Garbage Collection, which proactively prepares to write space so that the preparation penalty is mitigated when a write occurs. Since SSDs do not share the seek time penalties of hard drives, using space anywhere on the drive is as optimal as any other location. As a result, today’s high capacity 3D TLC drives are surprisingly fast.
Also, a single-digit percentage of companies need the IOPS that most marketing claims would have advertise. Run Live Optics and see. Higher capacity and more cost-effective drives bring the benefit of migrating a greater amount of production data on Flash. This provides a consistent quality of service to I/O across more data capacity.
DWPD or Drive Writes Per Day.
The combination of most companies having lower I/O needs than led to Believe, mixed with higher capacity drives, can dramatically change one’s opinion On adopting 3D TLC drives as tier 1 capacity drives.
DWPD is simply the number of times that you can completely overwrite the capacity of. An SSD per day and stay within the manufactures' recommendations.
All Flash technologies inherit one flaw which is that the process of writing to Flash gradually degrades the memory cells. Storage administrators must consider the write workloads of their applications before deploying SSD disk and caching products to ensure that the product lifetimes match their requirements. The standard for measuring the endurance of an SSD disk is Drive Writes per Day (DWPD). DWPD is measured in terms of the total capacity of the disk. For example, a 100 GB SSD does one DWPD if it writes 100 GBs in one day. The standard suggests that the disk endures the estimated DWPD for at least 5 years.
Live Optics can assist by showing at each layer (disk, server, cluster disk, collector run, and project) the estimated average daily write.
Average Daily Write
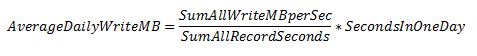
To calculate the average daily write for any given set of I/O records, sum the write throughput (MB/sec) of all the records as well as the duration of each record. This is done automatically in Live Optics and results in a capacity value written each day. The basic equation to understand Average Daily Writes would be:
Therefore, for any SSD drive type can use this capacity value with the following equation to calculate the minimum number of drives must accommodate the daily write activity, including any backend I/O operations:
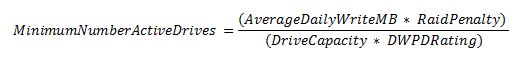
Note: In this equation "RaidPenalty" needs to be explained in further detail later in this document.
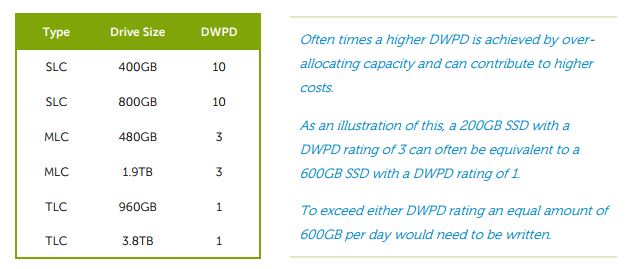
To use this equation, first know the drives DWPD rating. This manufacturer rating is generally available data associated with the specifications of that drive. For the purposes of this demonstration, here are some acceptable DWPD ratings for various drive types.
RAID: A quick primer on how RAID effects DWPD
RAID 10 is the simplest form of RAID to understand. With each write and additional copy is written to the other disk in the mirror. Therefore, the RAID penalty used is 2. RAID 5 & 6 are more complicated and at first glance RAID penalties used in DWPD calculations might look at odds to commonly-held knowledge of "capacity efficiency ratios," but this can be understood with a simple diagram as they are related, but mutually exclusive capacity factors.
RAID 5: RAID Penalty is 2.
The usable capacity efficiency ratio for a RAID 5 (4+1) is 80%. 4 capacity disks and 1 parity disk provide a 4/5 ratio.
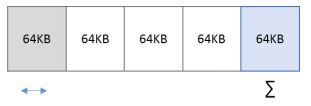
DWPD is calculated based on the capacity of written data, but more importantly how it is written to disk. To illustrate, here are some common RAID terms. Each RAID set consists of a RAID Stripe Width and RAID Stripe Depth.
RAID Stripe Width: the number of Drives the RAID stripe will span. (4 disks + 1 parity disk.)
RAID Stripe Depth: This term can have many names, but is the quantity of data that will be written to each disk before writing moves to the next disk. This is a critical factor in understand the logic of estimating DWPD.
The diagram below shows the best- and worst-case scenario of writing to this RAID stripe with a 64KB stripe depth.
Best Case Scenario:
Systems may try to do write concatenation or coalescing to attempt to optimize the impact to disk. (a perfect 256 KB is written.) Each disk would receive an even allocation of 64 KB. Parity would also be 64 KB, but is only a 20% overhead of the 256 KB written.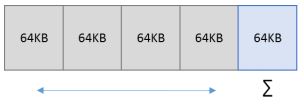
Worst Case Scenario:
However, most writes are small and often smaller than the stripe depth. (Let’s assume only an even 64 K of data has been written.) This would only effect two disks in the RAID stripe: the disk where the 64 KB was written and the re-written parity disk which is also 64 KB, resulting in a 100% write overhead, even though usable capacity would remain 80% efficient.
RAID 6: RAID Penalty is 3.
An extra penalty has to be taken for dual parity RAID. In the same worst-case scenario, the 64 KB would be written and only effect one disk; however, now two parity disks would need to be recalculated and re-written. Therefore, the worst case scenario for RAID 6 will be a penalty of 3x (64 K of data + 128 K of parity).
Summary
Since DWPD is a factor of data capacity written, an SSD will try to optimize writes by finding a new pre-prepared portion of the drive vs. overwriting the same data space. It is extremely safe estimate of the wear to any given drive with any known Average Daily Write capacity.
The calculations on the following page reflect a 100% worst-case scenario estimate, so any optimization to writes provided by the system will only make these estimates safer.
DWPD: Applying Average Daily Write to estimate endurance.
There are two ways to approach the DWPD value depending on what is trying to be achieveed: calculating the Minimum Number of Active Disks needed or Calculating the Estimated Life Span of a particular number of SSDs with a known workload.
Minimum Number of Active Drives
This method helps you estimate if one drive or a set number of drives need to stay within the recommended DWPD rating based on an observed workload demand in a Live Optics project.
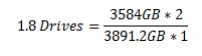
Average Daily Writes: 3.5TBs
Destination RAID Set: RAID 10
SSD being evaluated: TLC 3.8 TB SSD
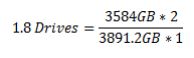
Average Daily Writes: 3.5TBs
Destination RAID Set: RAID 5-5 (4+1)
SSD being evaluated: TLC 3.8 TB SSD
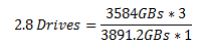
Average Daily Writes: 3.5TBs
Destination RAID Set: RAID 6-6 (4+2)
SSD being evaluated: TLC 3.8 TB SSD
Smaller Drives and higher DWPD
What is demonstrated here is that even with the extreme number of writes at 3.5TBs a day, and with the RAID penalty included, the high capacity of the drives results in the required minimum number of disks to be 3 or less for all the configurations.
To illustrate the relationship between disk capacity and DWPD Rating, the next example will use a smaller drive with only 400GBs of capacity, but with a higher DWPD Rating of 10.
Average Daily Writes: 3.5TBs
Destination RAID Set: RAID 6-6 (4+2)
SSD being evaluated: SLC 400 GB SSD
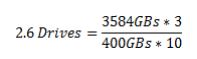
The end result is that the minimum number of drives to accommodate the writing workload is still 3. However, the TLC configuration would have roughly 10TBs of raw capacity while the SLC would have 1200GBs.
Realized DWPD Factor.
Use above or below the recommended number of minimum drives accelerate or decelerate the wear estimate. Calculating this is as simple as dividing the recommended number of drives by the number used.
This configuration is over-provisioned; the wear durability of these drives should exceed expectations. This configuration does not meet the recommendation. Therefore, there is an accelerated wear on the drives.
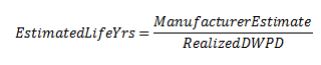
DWPD: Applying Average Daily Write to estimate drive life. To calculate the Estimated Life Span of a known number of drives against a known Average Daily Write capacity, reverse the calculations and use the Realized DWPD Factor.
Estimated Life Span
Most RAID sets, especially in a storage array, generally include 4-12 drives for a minimum configuration. The result is that calculating the life expectancy of SSDs can often demonstrate a humorously estimated number of years the drives can be in service. However, in an improperly- or under-provisioned system, these estimates could help understand.
System refresh increments to avoid unexpected downtime.
Using our two Realized DWPD Factors from the previous page, demonstrates the effect of each scenario with this formula.
Example Data:
Manufacturer Estimated Years: 5
Realized DWPD: 0.27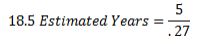
Manufacturer Estimated Years: 5
Realized DWPD: 1.67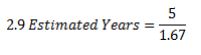
Final Thoughts
For now, IOPS as a sizing measurement, largely commoditized by the general availability, of SSDs has ever decreasing prices and increasing capacities. The largest benefit of migrating to SSDs is getting more of your data to a consistently higher service level for all disk activity.
However, there has still been some hesitancy around the unknown as it pertains to speed and durability when it comes to a company’s specific workloads and the innovative technologies SSD manufacturers are using to push the boundaries of capacity.
Live Optics can measure the uniqueness of an environment and with this information find a comfort level around drive life expectancy no matter how unique a workload or what drive is chosen to implement.
Note, this document uses an Average Daily Write of 3.5TBs per day, which by all admissions would be far beyond the average corporation’s demand in almost any vertical. So if your Average Daily Writes are below 3.5TBs per day, your wear expectations would exceed the estimates in this document.
To know with certainty, start today at https://LiveOptics.com for a complementary account.
Live Optics is a vendor and platform agnostic standard method for getting the performance facts from your environment donated to the community by Dell Technologies, Inc.
Additional Information
If you have any questions, please reach out to Live Optics Support at liveoptics.support@dell.com.
Affected Products
LiveOpticsArticle Properties
Article Number: 000299059
Article Type: How To
Last Modified: 18 Feb 2026
Version: 2
Find answers to your questions from other Dell users
Support Services
Check if your device is covered by Support Services.