PowerEdge: How to Monitor Server Health from iDRAC10
Summary: This article provides general information about how to view and monitor server health from the IDRAC10 web interface.
This article applies to
This article does not apply to
This article is not tied to any specific product.
Not all product versions are identified in this article.
Instructions
Navigate iDRA10 to Monitor Server Health
Table of Contents:
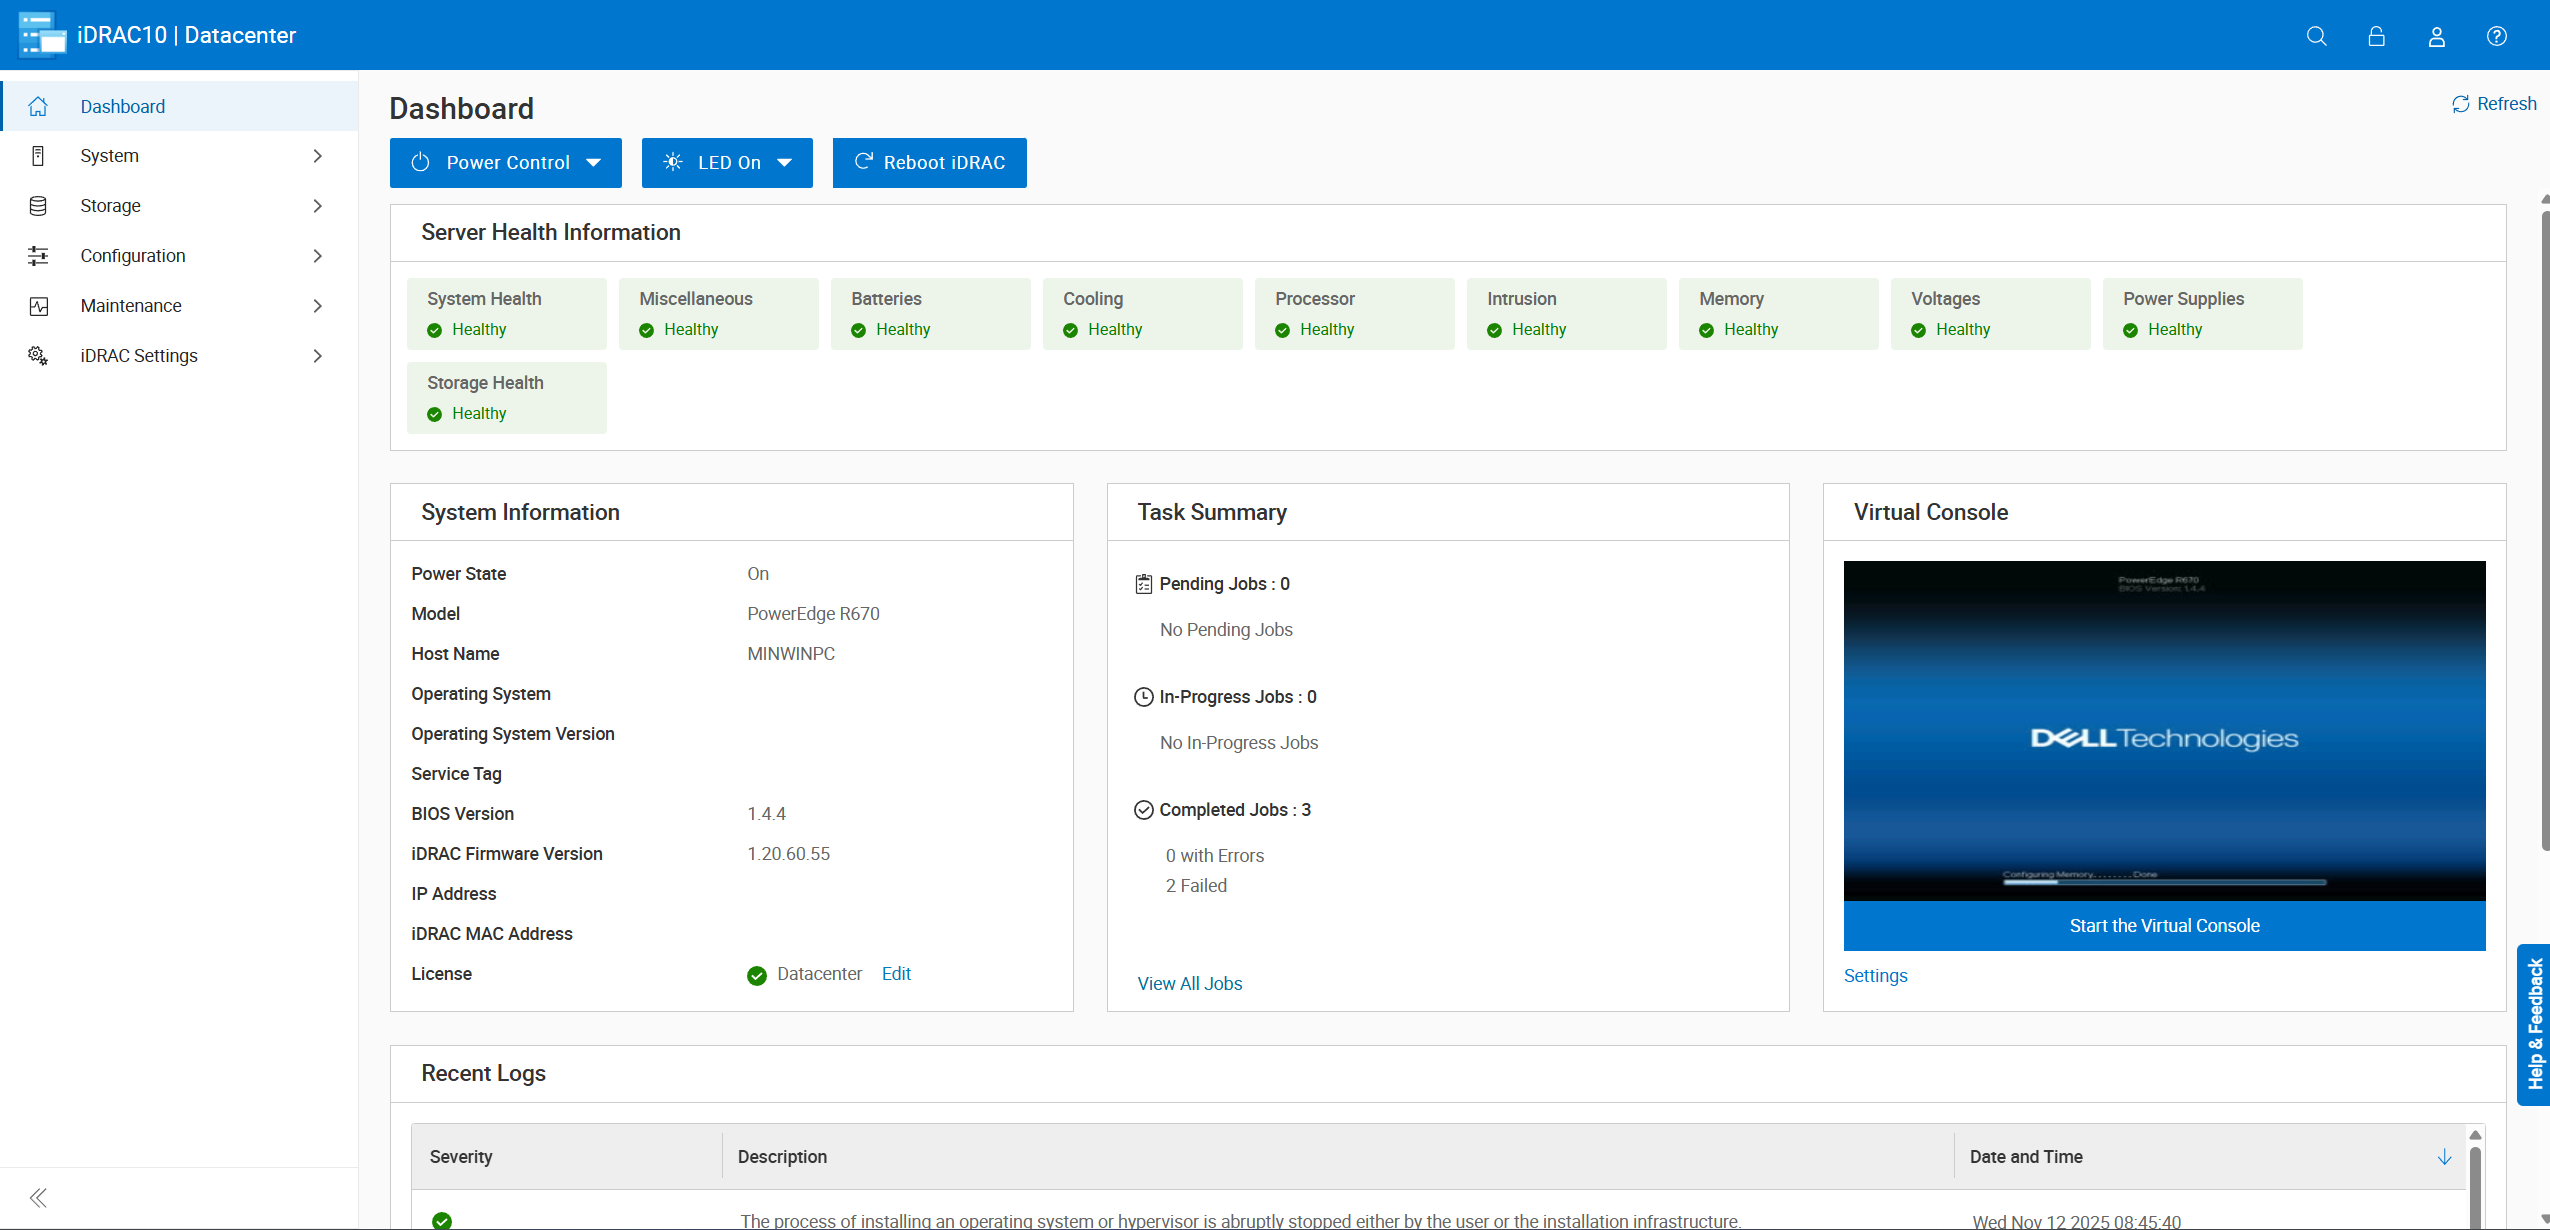
Dashboard Summary:
- Review health alerts for any warnings.
- Perform Power Actions
- Launch the Virtual Console.
- Check the Jobs in Progress.
- Read recent system logs for anomalies.
IDRAC System → Cooling:
- View the thermal profile chart.
- Inspect fan status and speeds.
- Check temperature readings for each sensor.
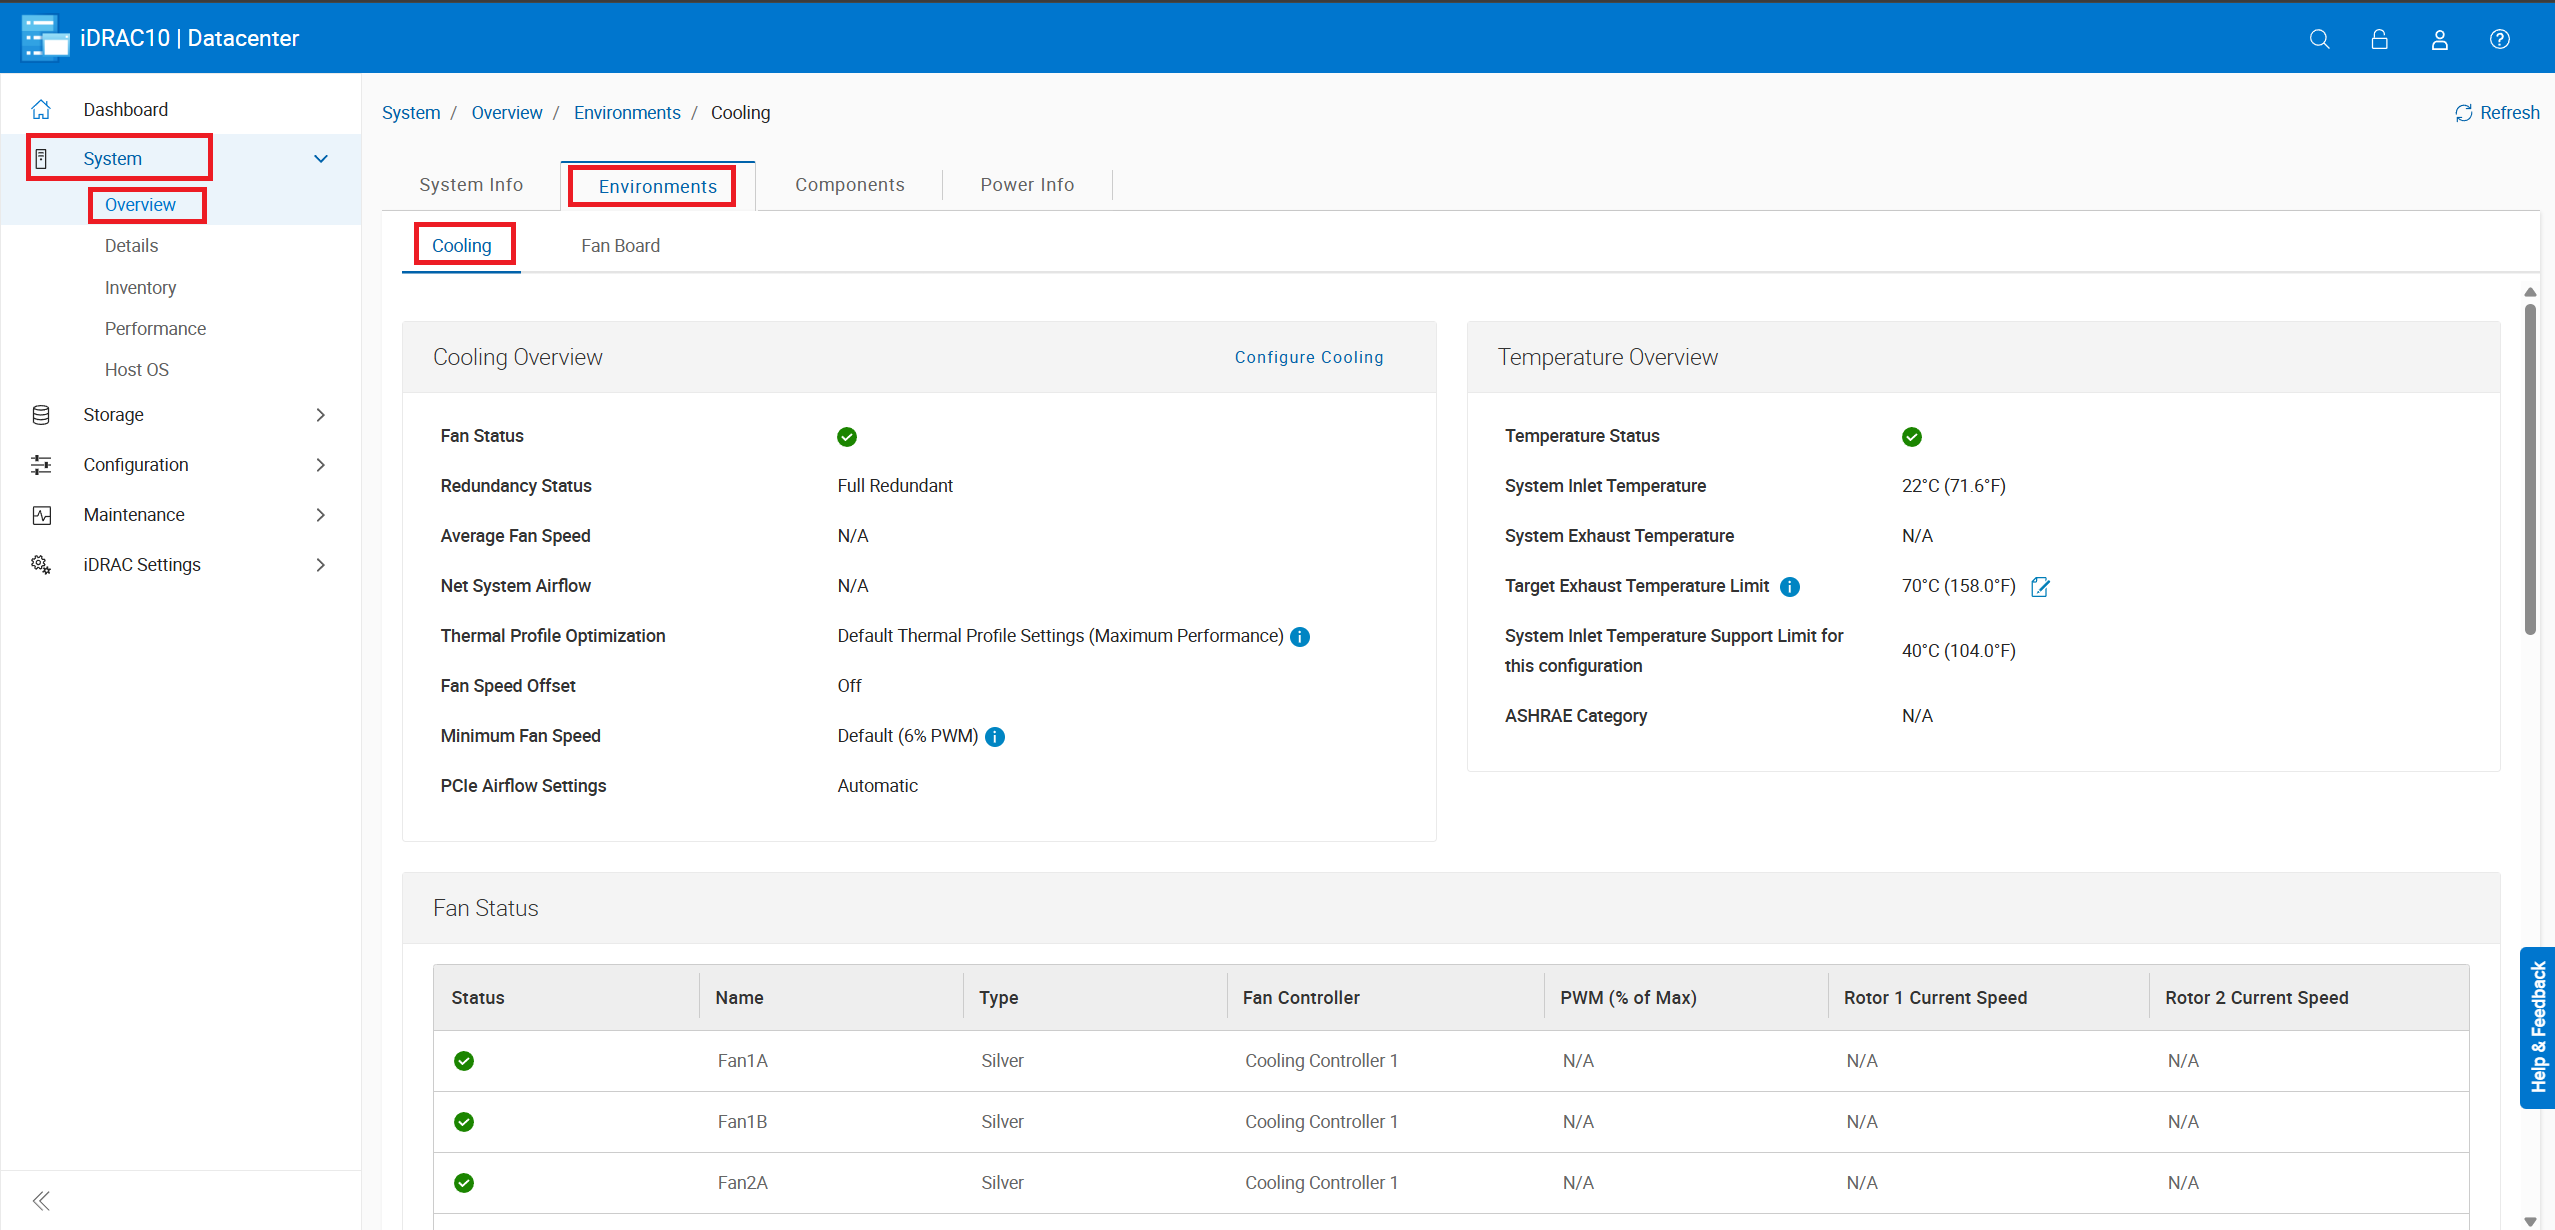
Figure 2: Click System -> Overview ->Environments -> Cooling.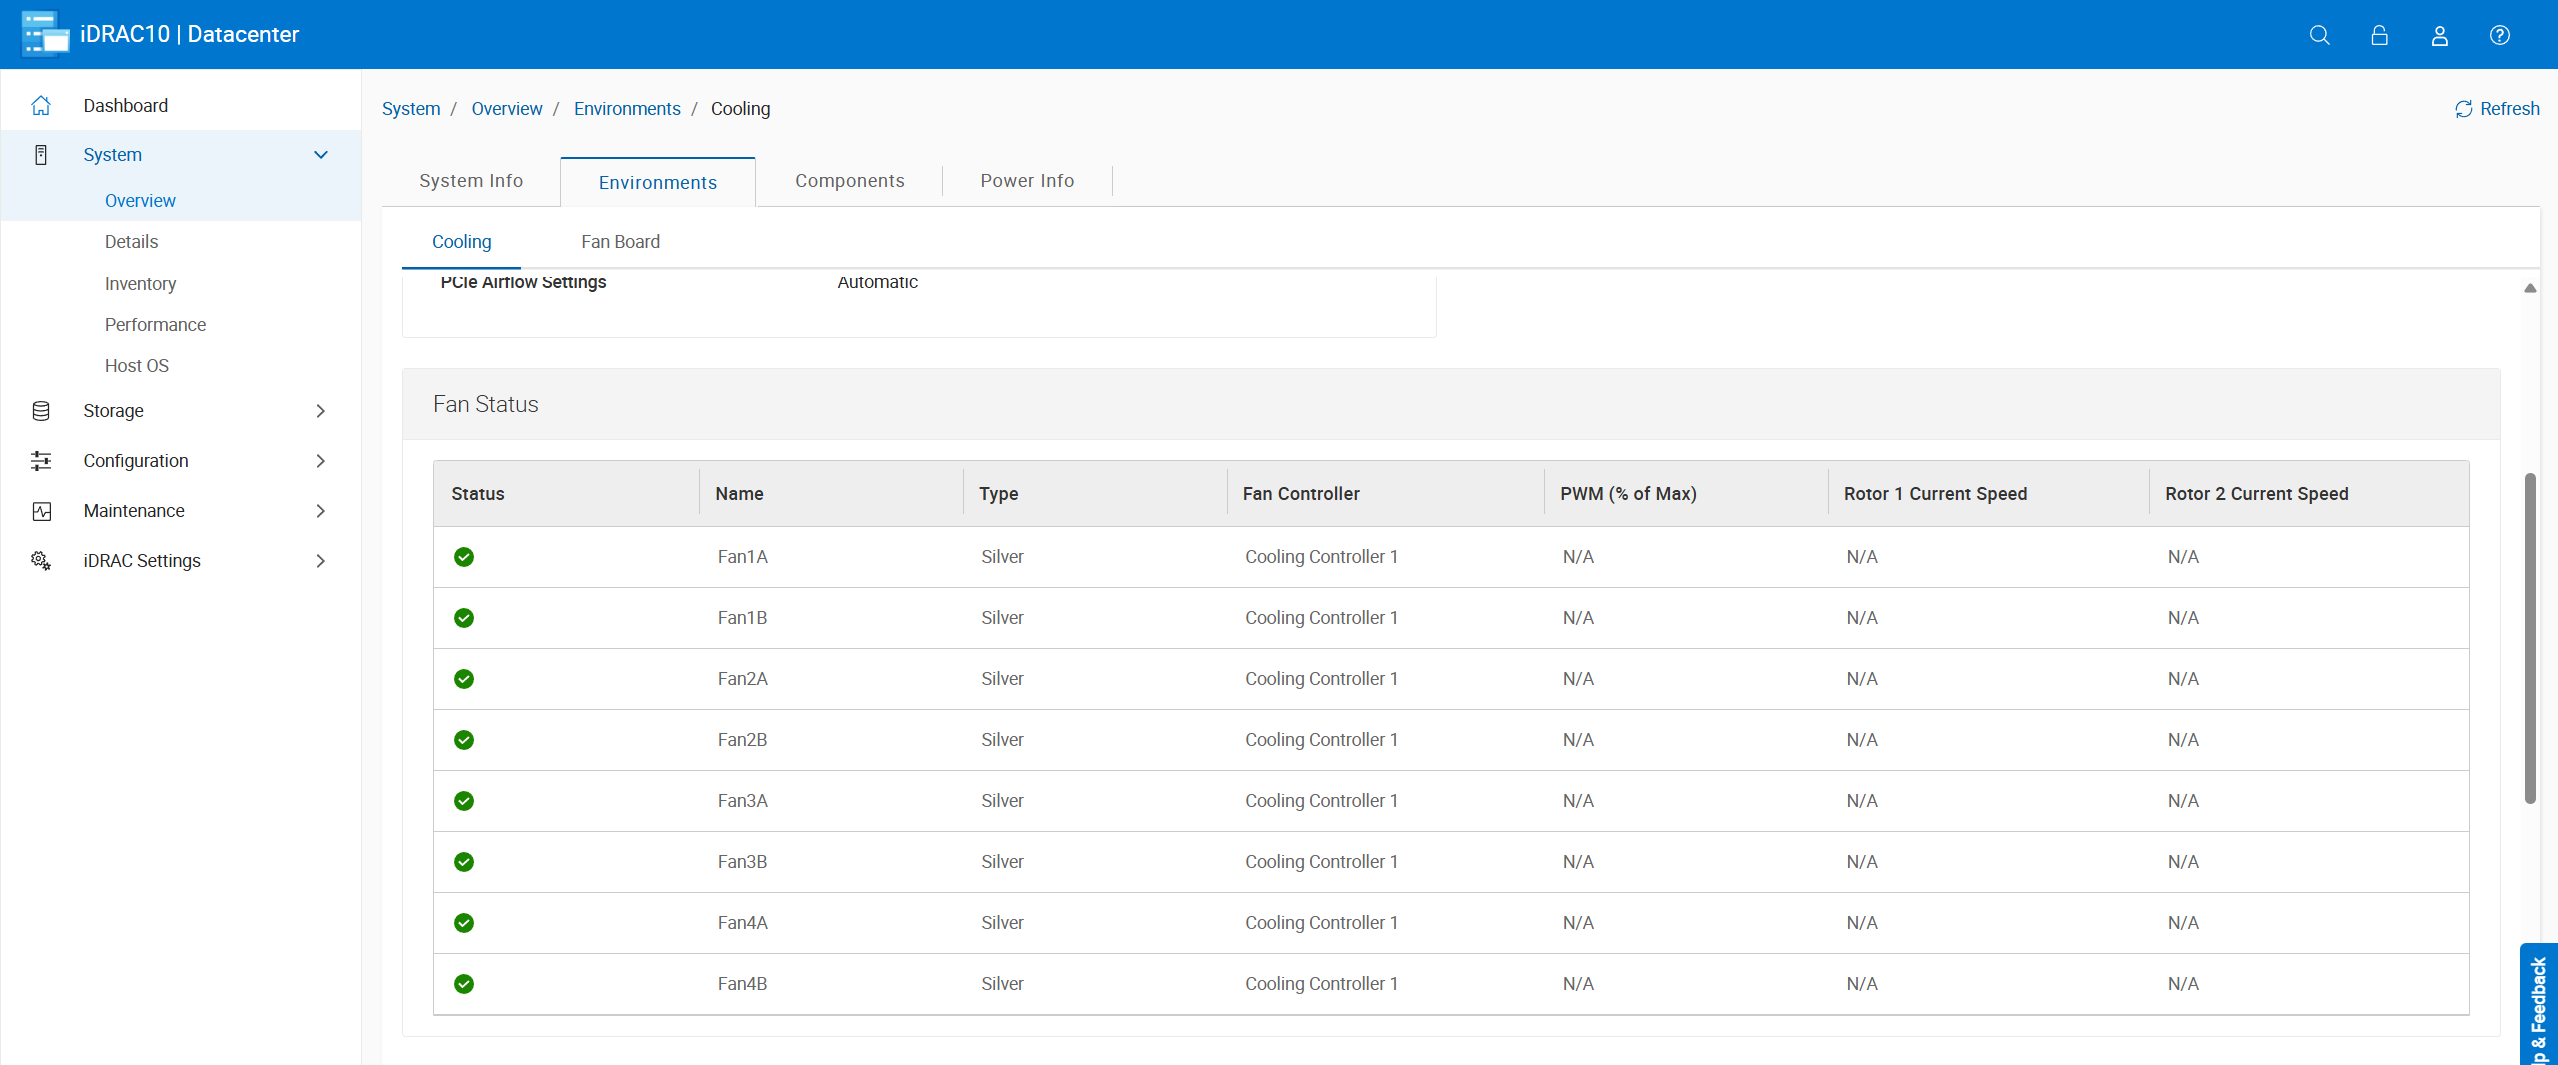
- View fan health along with the current speed. Fan speeds modulate as needed depending on inlet and component temperatures.
- Fans speed up to full speed (
100% PWM) as a response to either fan failures, temperature sensor failures or when the IDRAC goes offline.- If a fan failure is detected, the remaining fans automatically increase their speeds to compensate for the lost airflow.
- The IDRAC controls the fans making adjustments when needed, if the iDRAC goes offline for any reason the fans default to full speed.
- The IDRAC adjusts the fan speeds based on the reading from the inlet temperature sensor, if the sensor fails or stops communicating with the iDRAC the fans adjust to full speed.

- View CPU, Memory (DIMM), inlet (ambient), and exhaust temperatures as well as their warning and critical ranges
Note: If the CPU temperatures reach critical temps, the IDRAC initiates a server shutdown command.
- The IDRAC adjusts the fan speeds based on the reading from the inlet temperature sensor.
- If the inlet temperature reaches the warning or critical temperatures, the IDRAC increases the fan speeds to attempt to keep temperatures in the normal range.
- If the temperature sensor fails to communicate with the IDRAC, the fan speeds default to full speed until its back online.
Note: The inlet temperature sensor is typically located in the front/right control panel.
System Overview → Front Panel:
- Look for any alerts displayed on the front LCD panel.
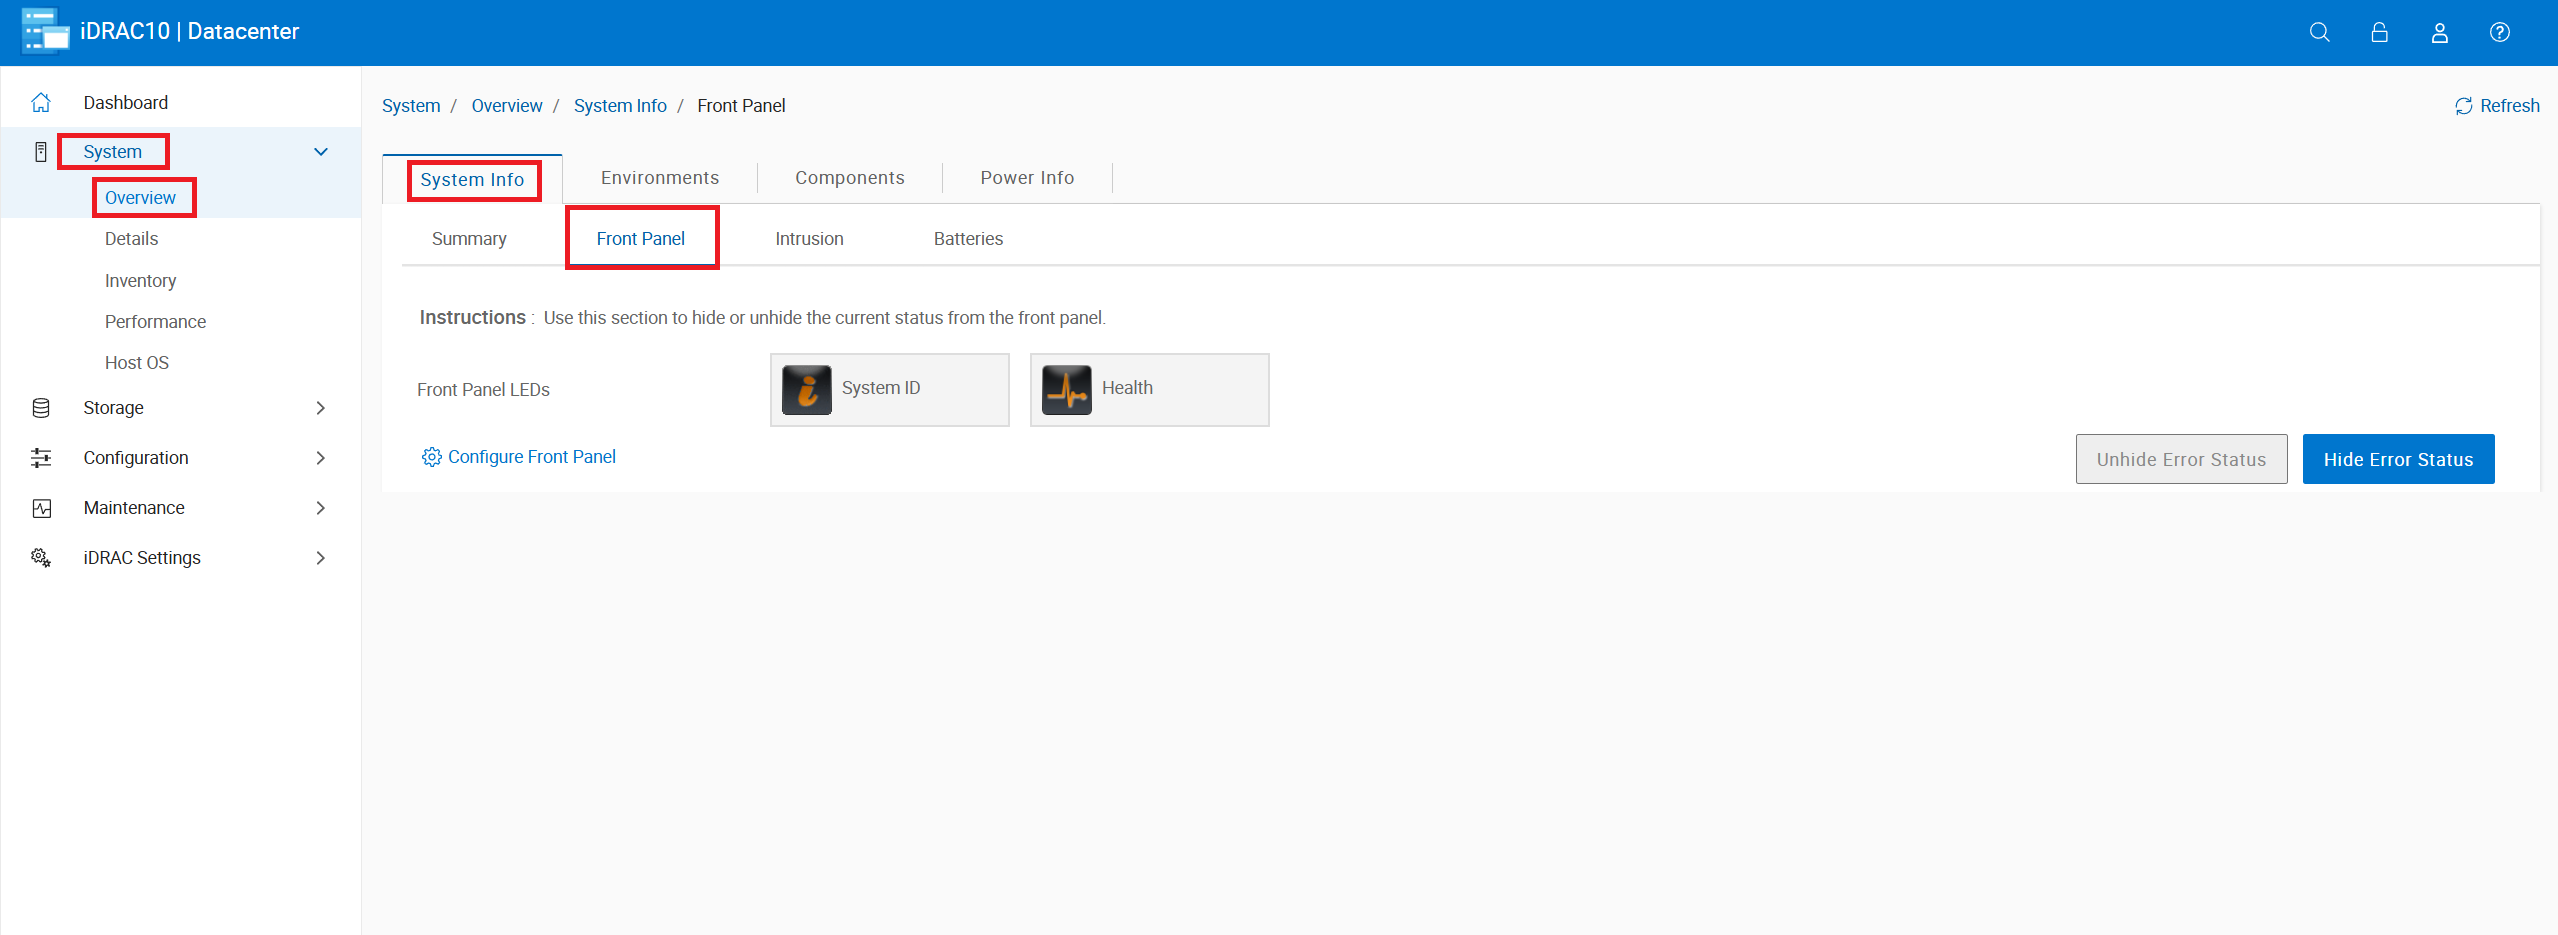
Figure 5: Navigate to System -> Overview -> System Info -> Front Panel.
System Overview → Memory:
- Verify total installed memory.
- Check the maximum supported memory.
- Review the memory population, and identify empty slots.
- Inspect each DIMM's health status and detailed information.

Figure 6: Click System -> Overview -> Components-> Memory.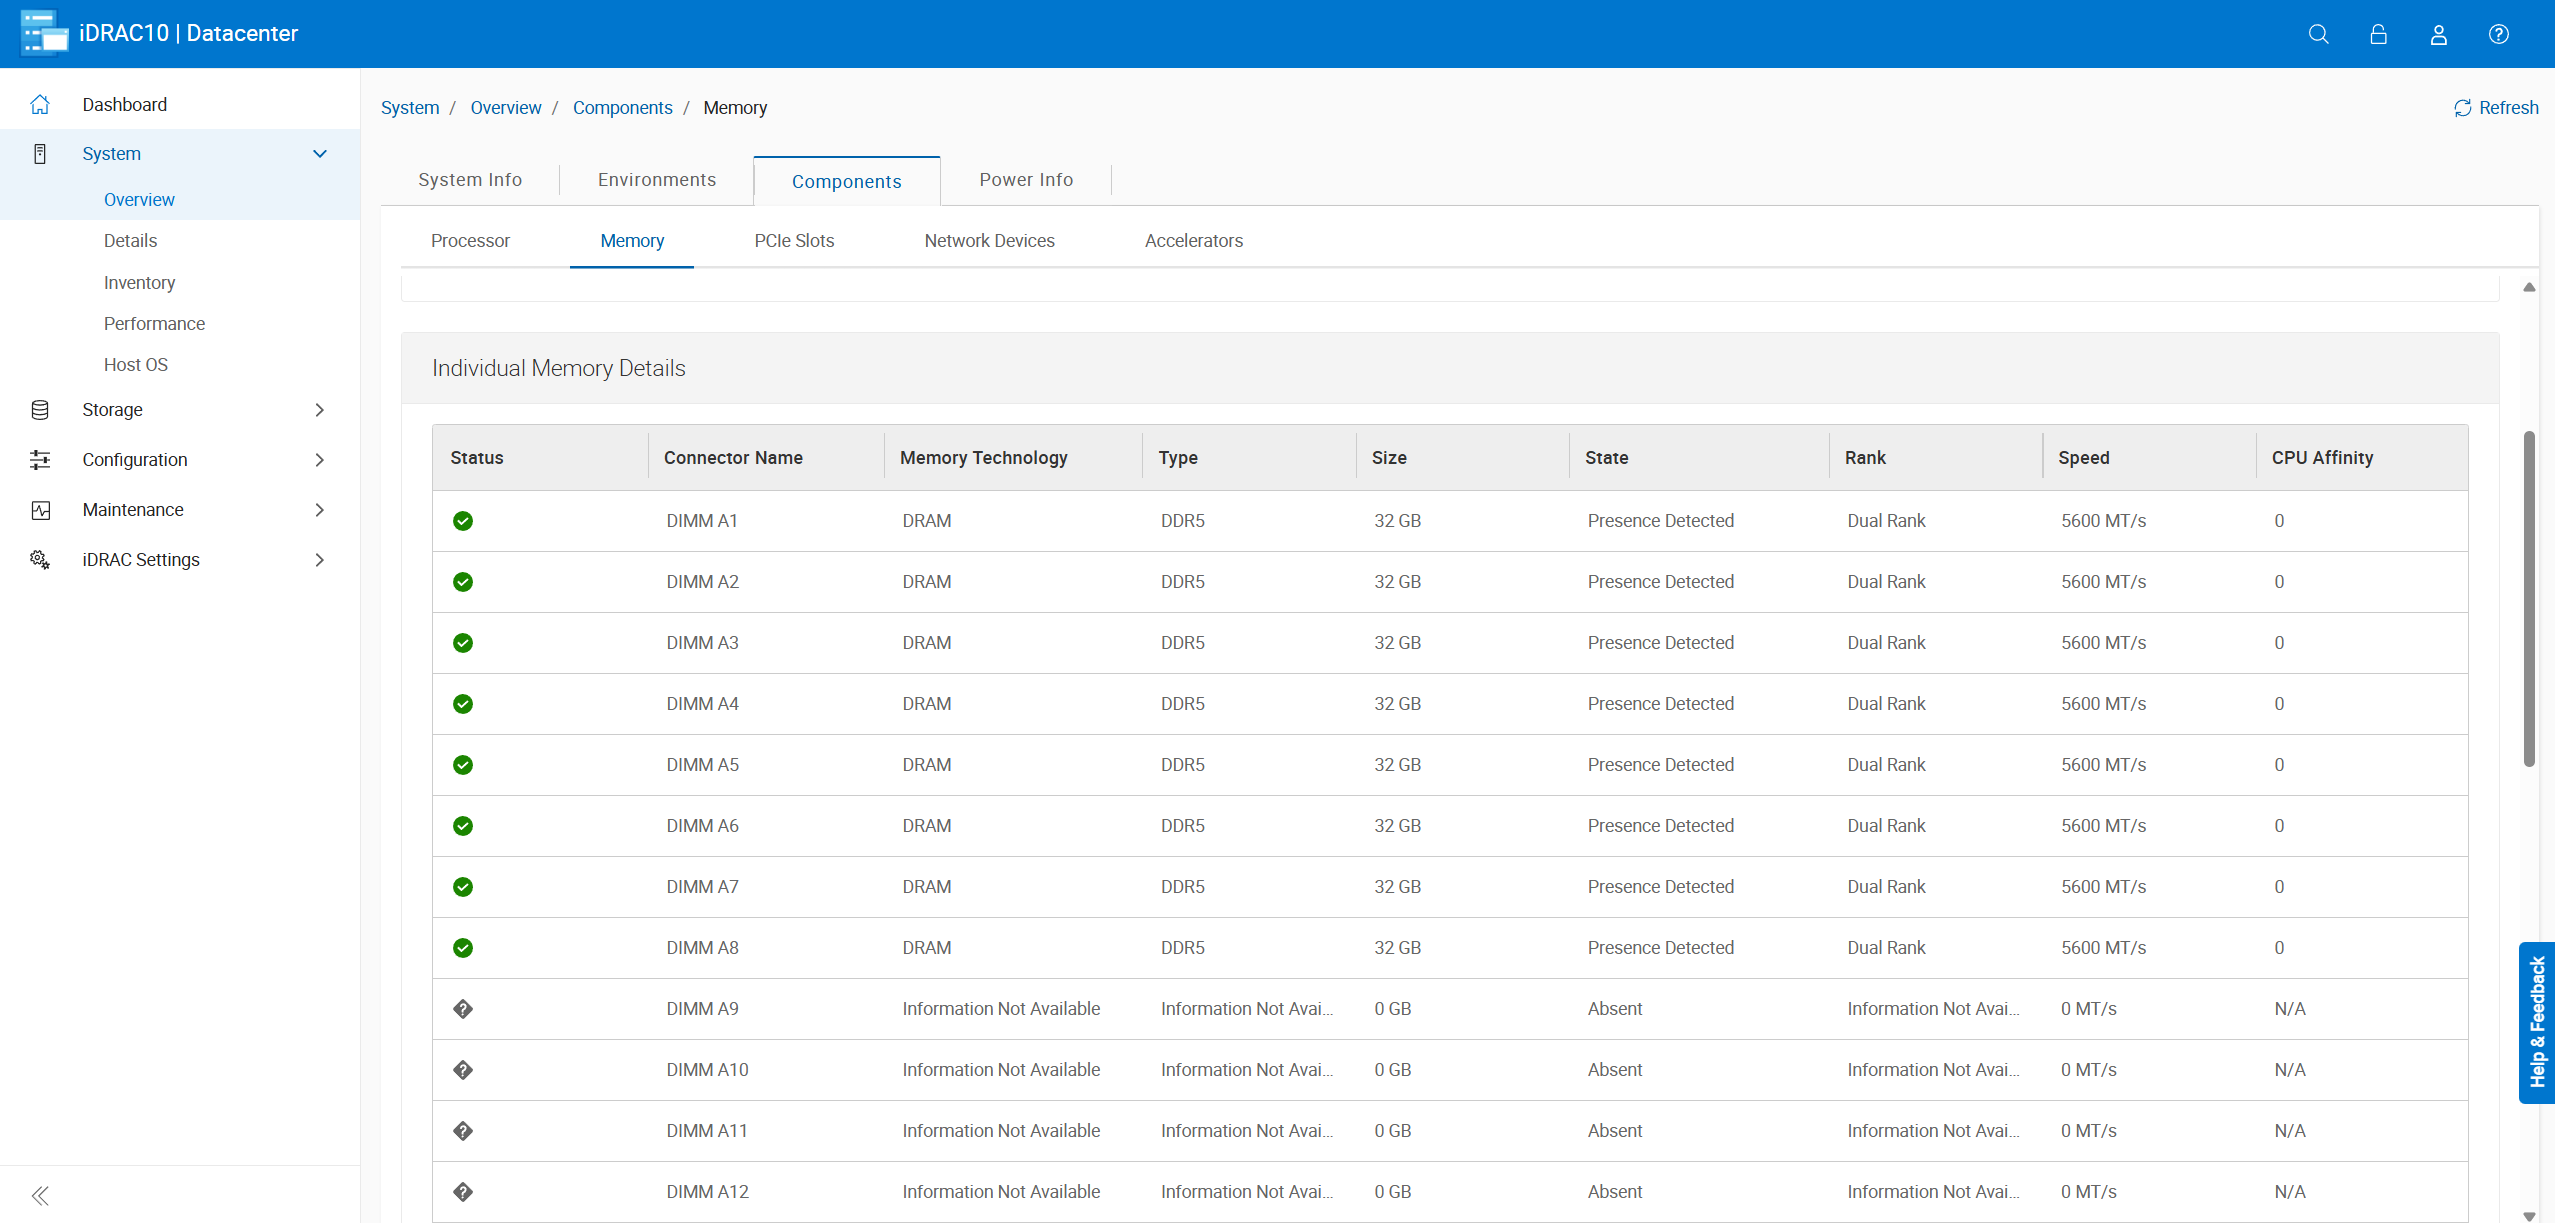
System Overview → Power:
- Check power‑supply health and input voltage.
- View current server power consumption.
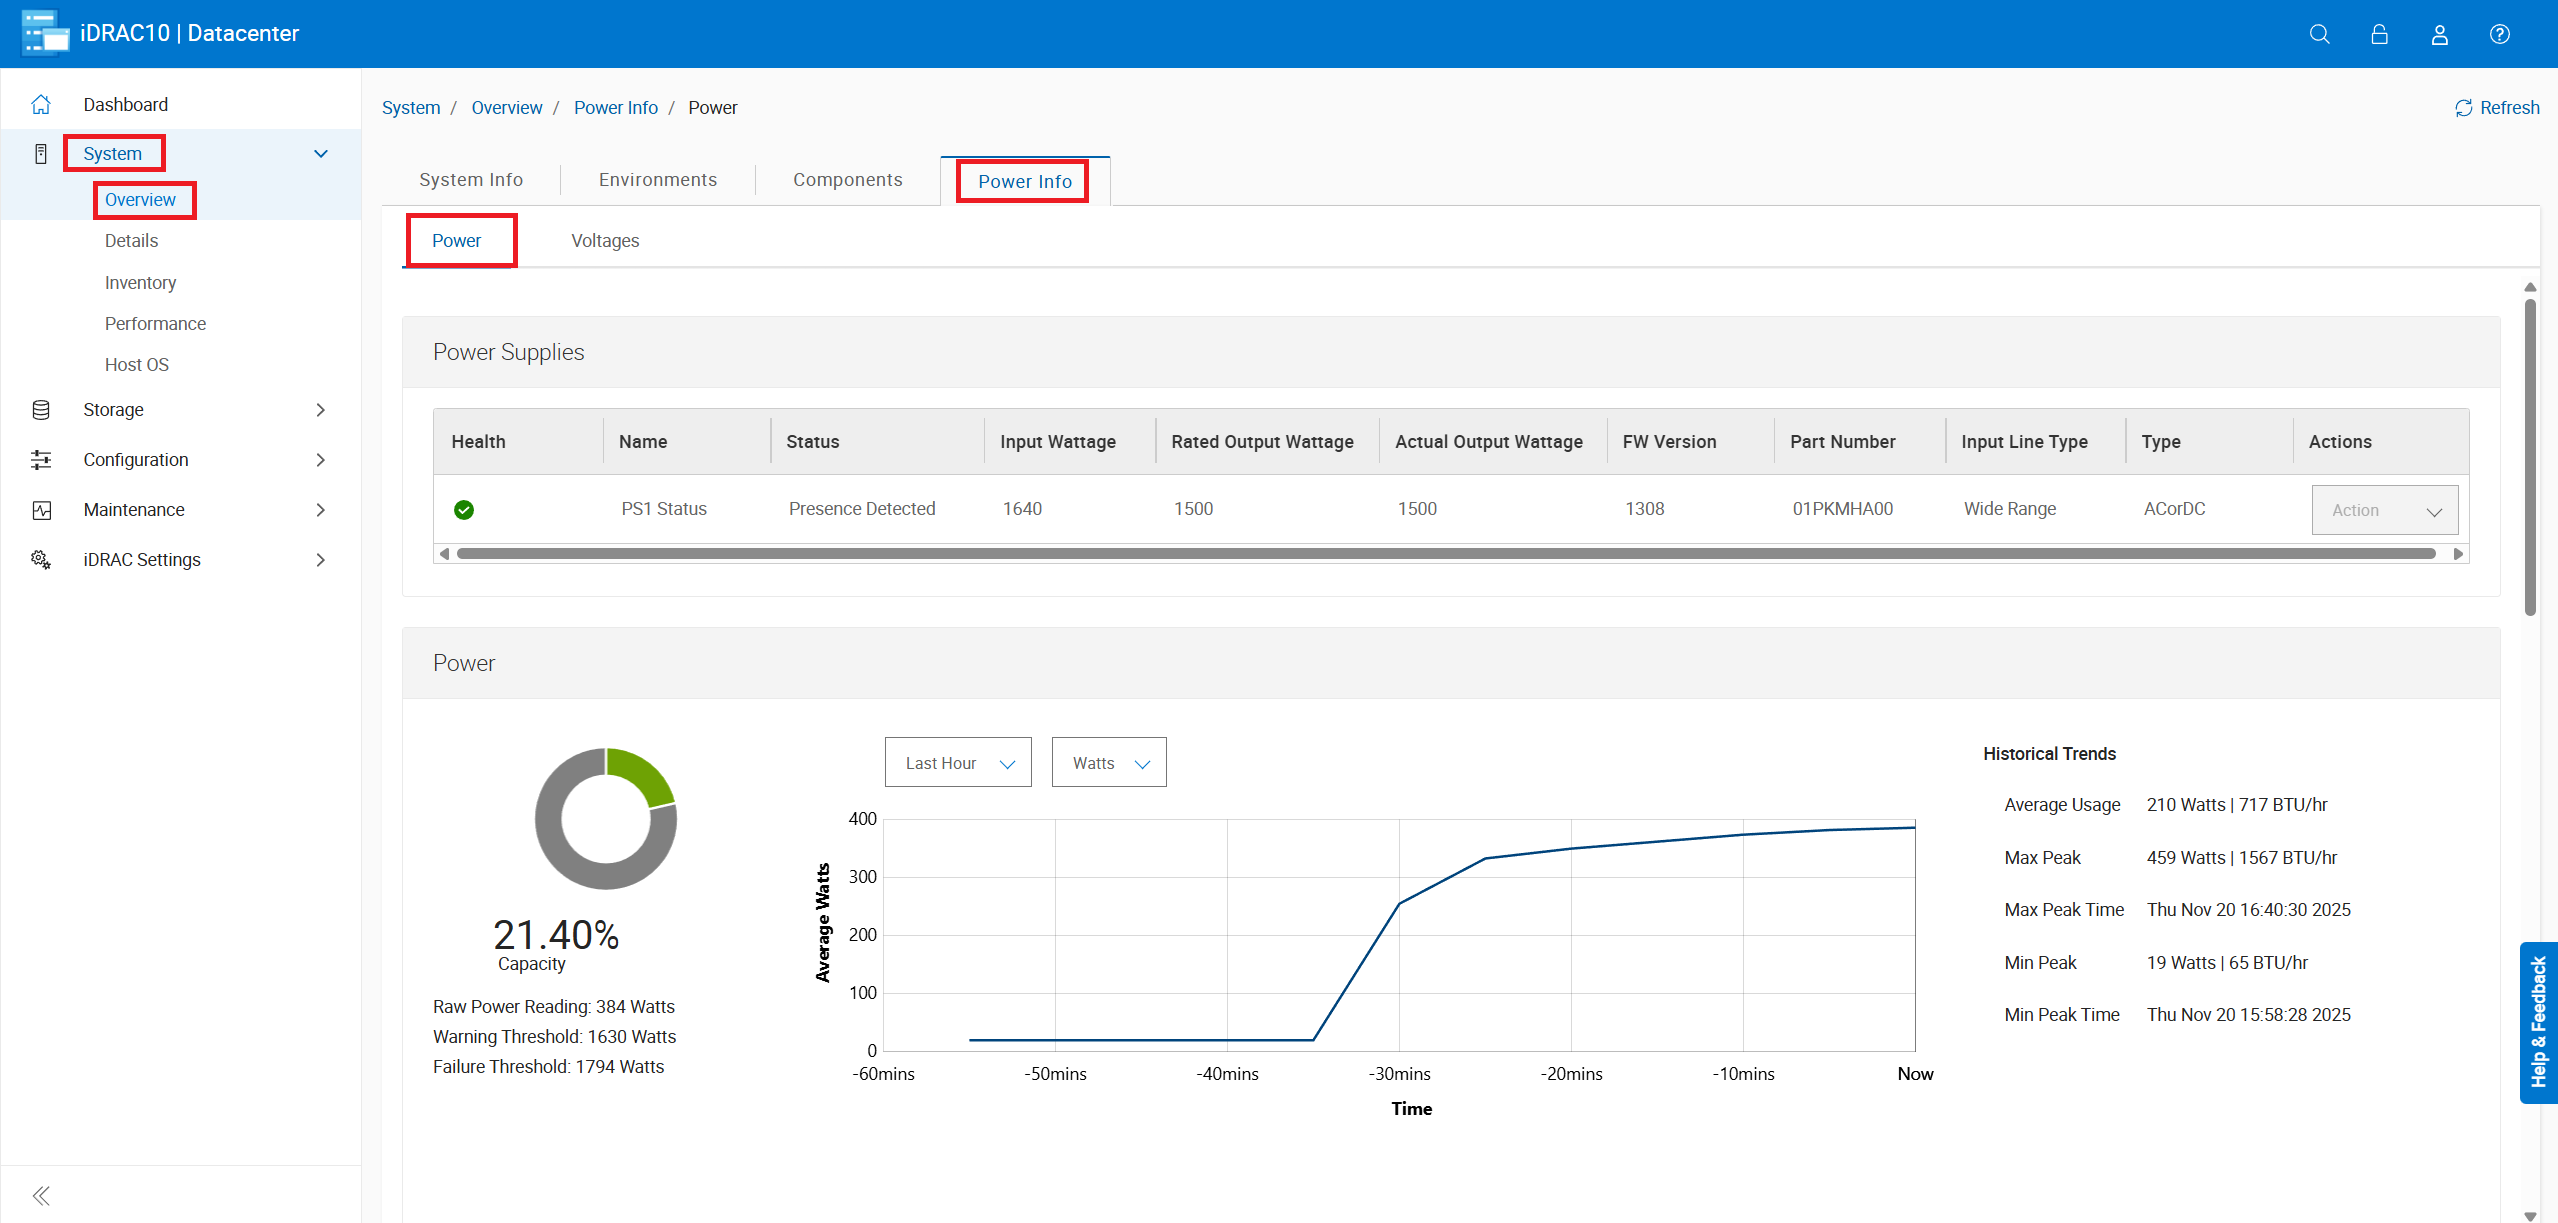
Figure 8: Go to System -> Overview -> Power Info -> Power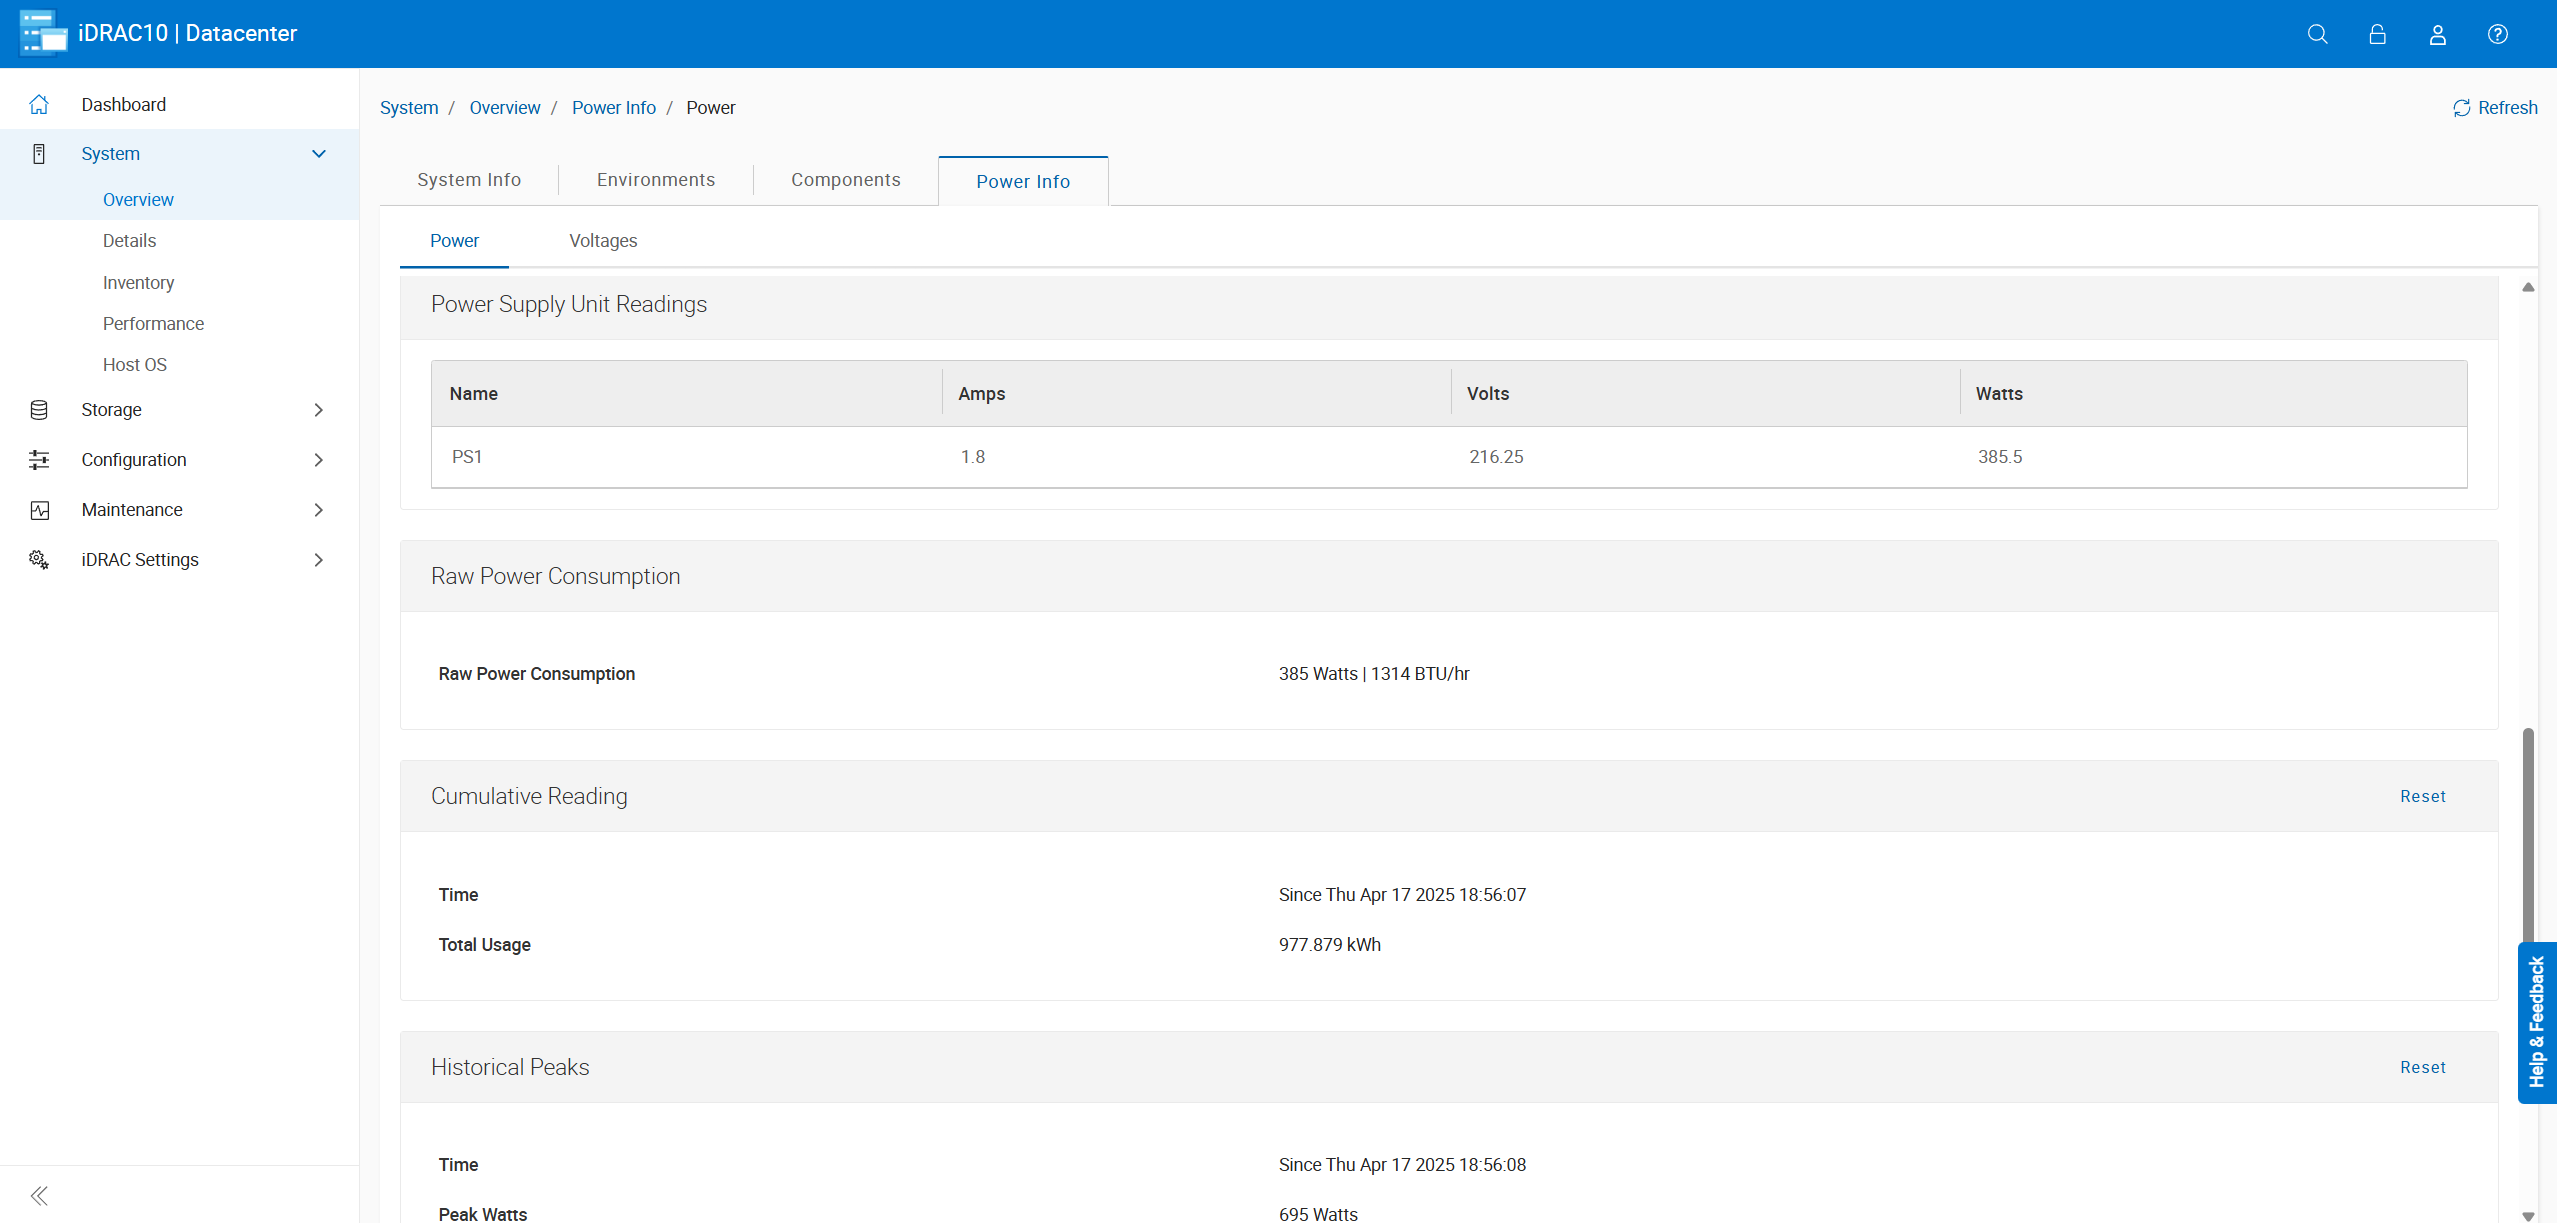
- View the servers total power consumption and Power Supply wattage.
Maintenance → System Update:
- Choose to update component firmware locally or over HTTPS.
- Setup automatic updates
- Use the rollback option to revert to a previous firmware version when needed.
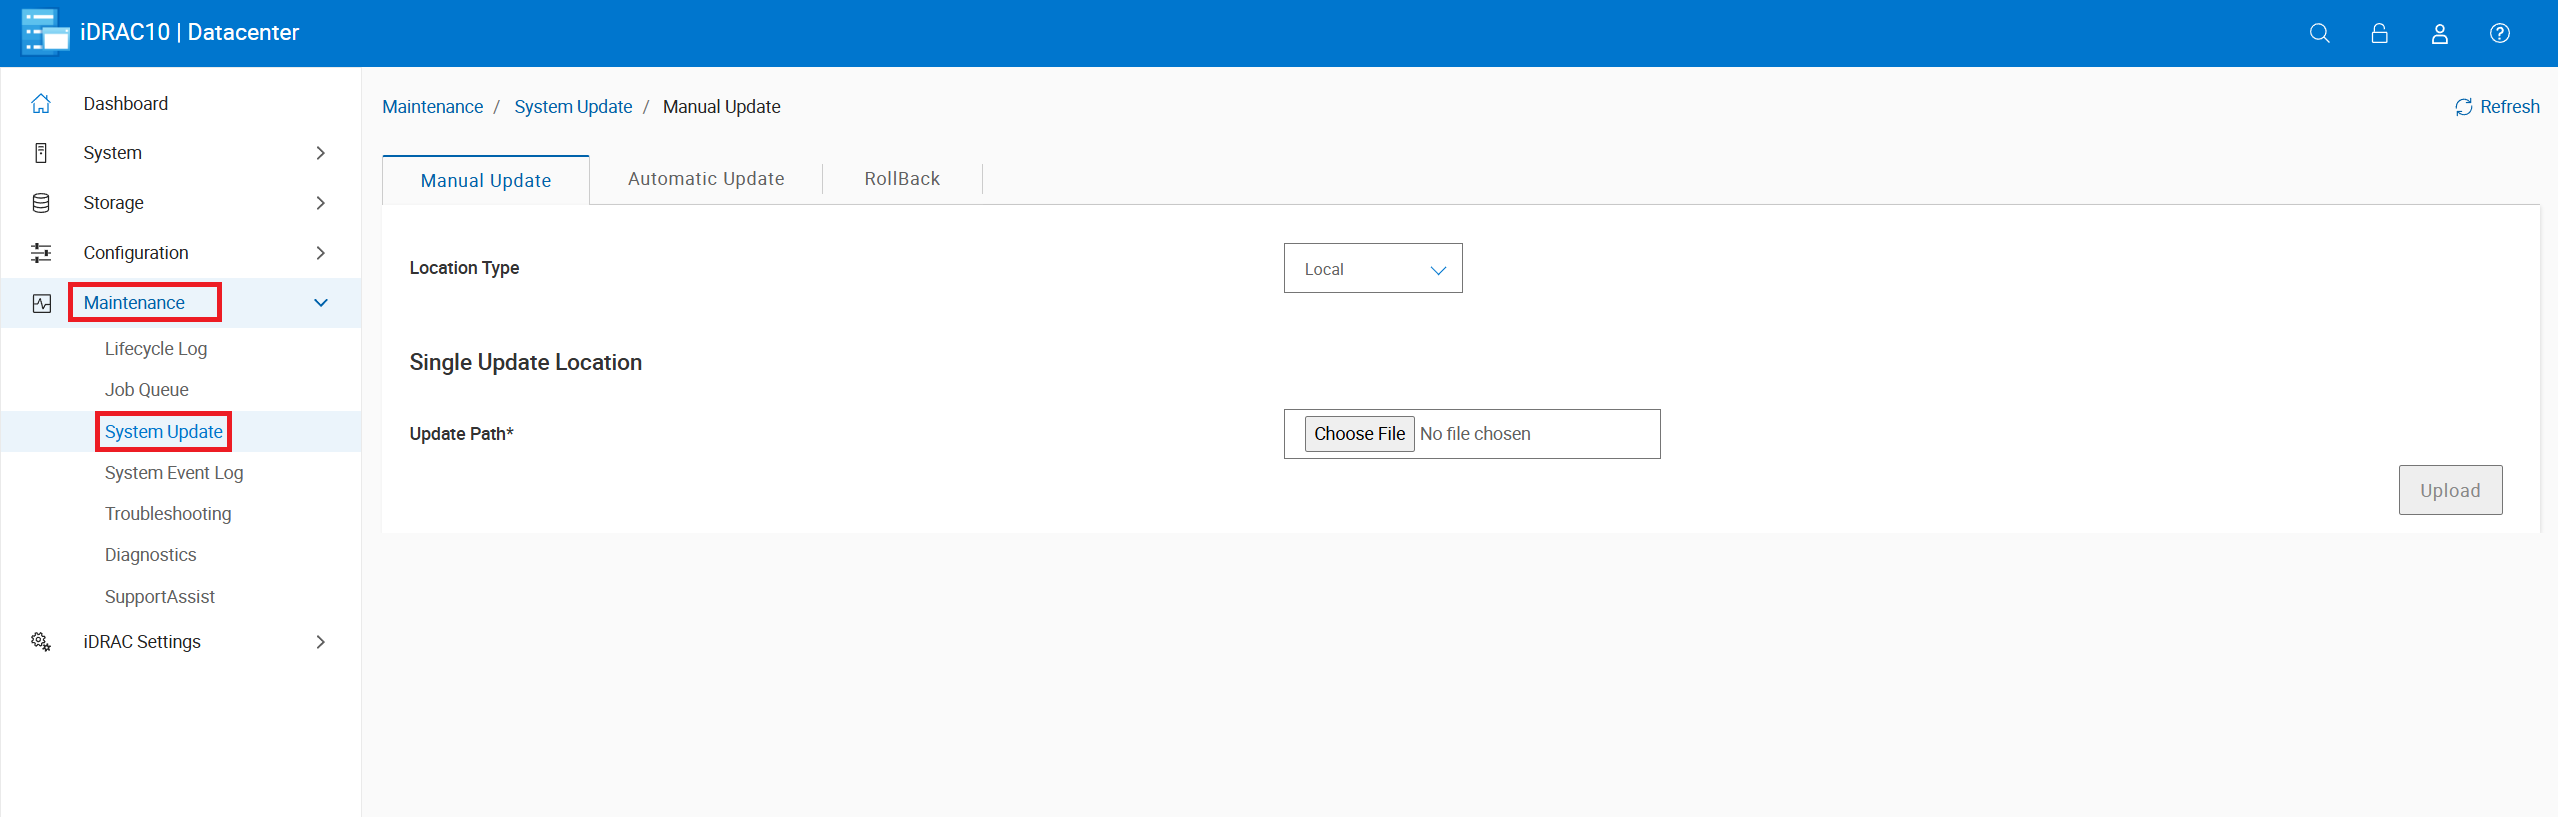
Figure 10: Select Maintenance -> System Update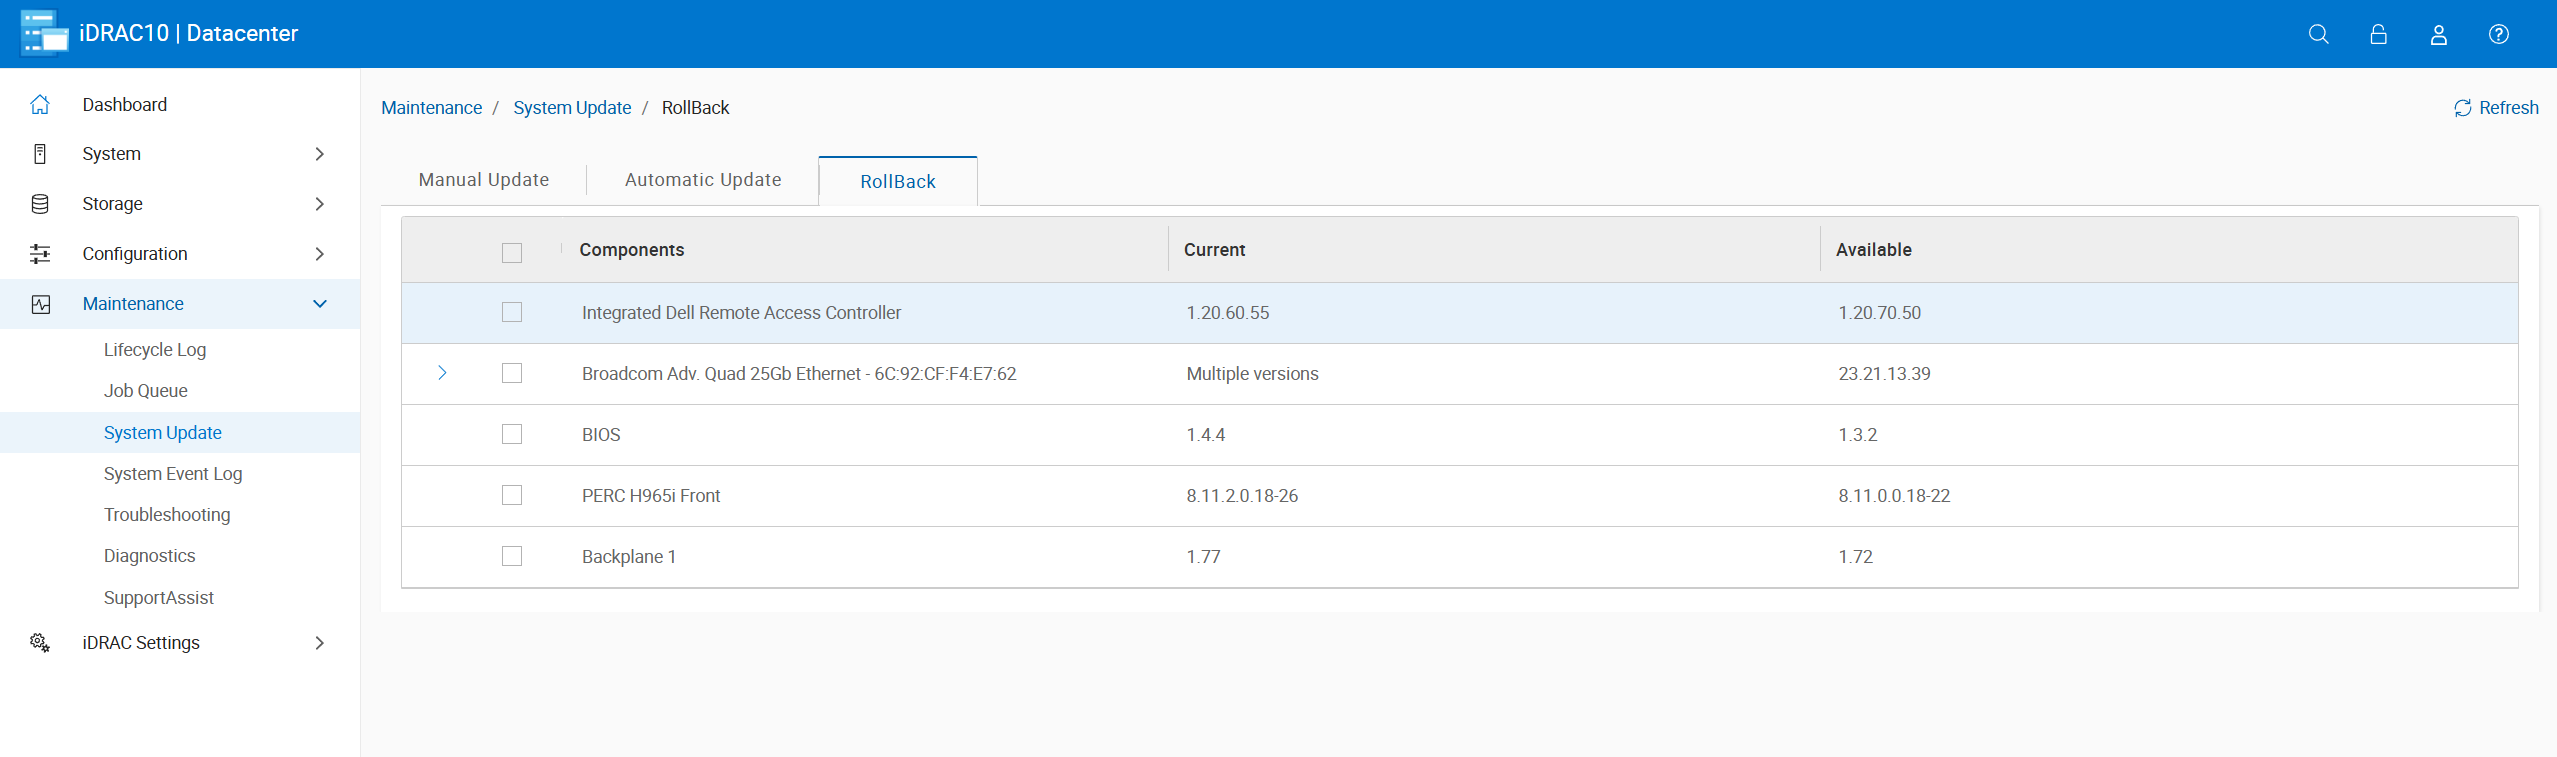 Note: The rollback option is only available for firmware updated using the IDRAC and only where the firmware version supports rollback
Maintenance → Lifecycle Log:
- Review all events: Informational, warning, and critical
- Apply filters for keywords or specific date ranges to narrow results.
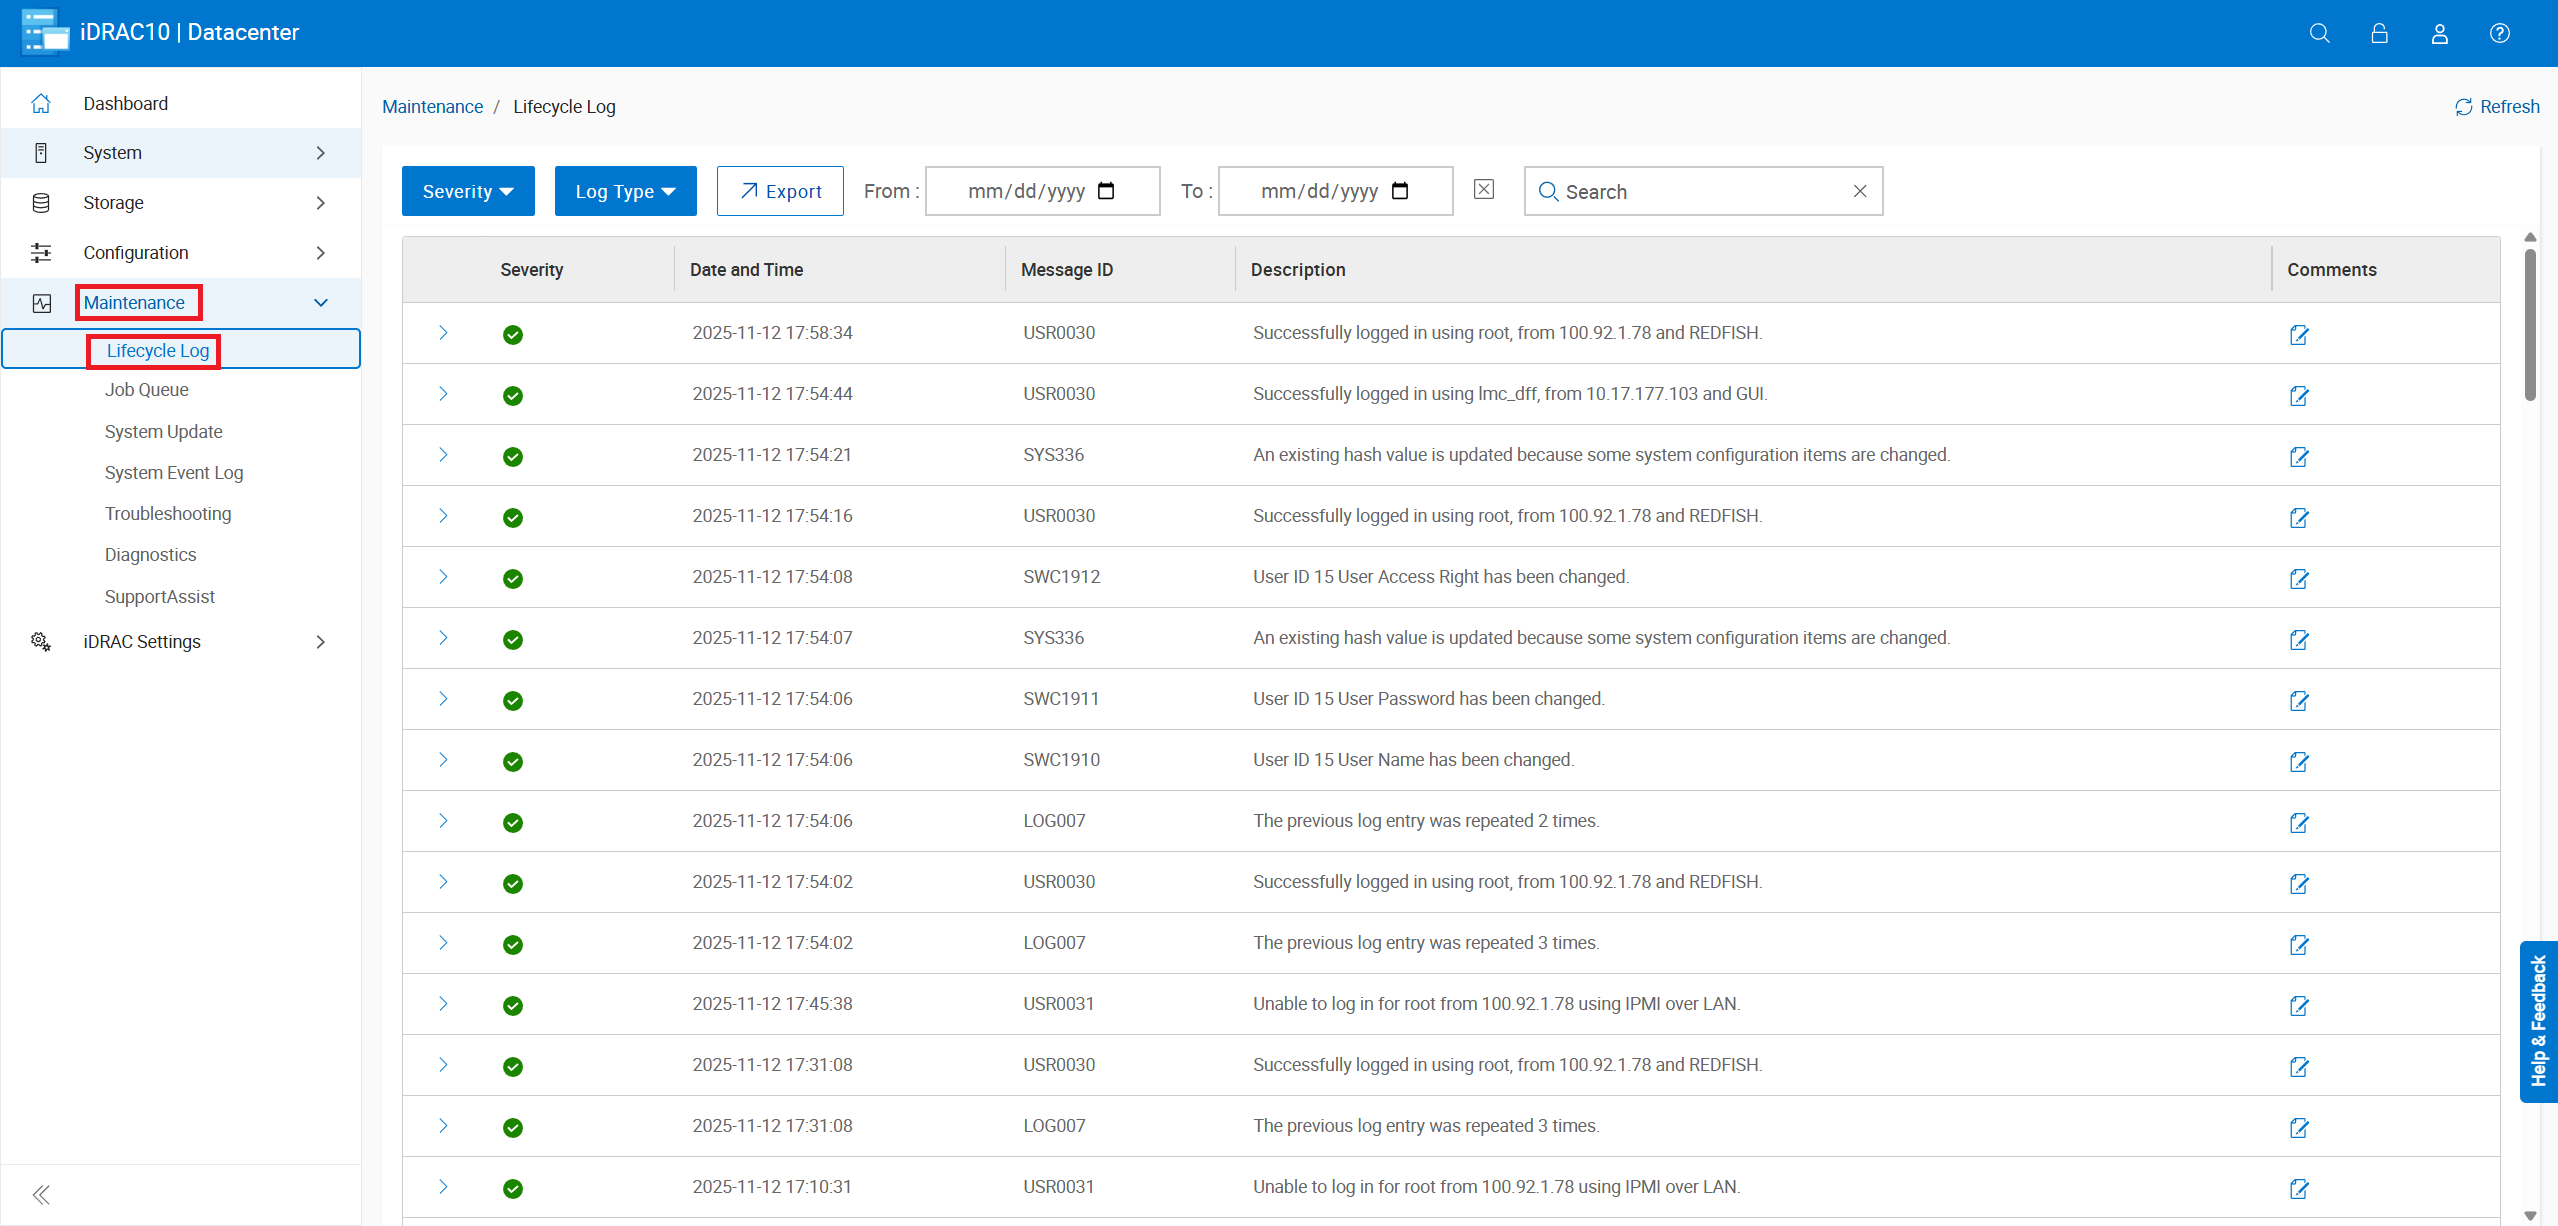
Figure 12: Click Maintenance -> Lifecycle Log
- The search option allows filtering the log for keywords, severity, type, or specified date ranges.
Maintenance → System Event Log (SEL):
- View the history of events.
- Clear the System Event Log.
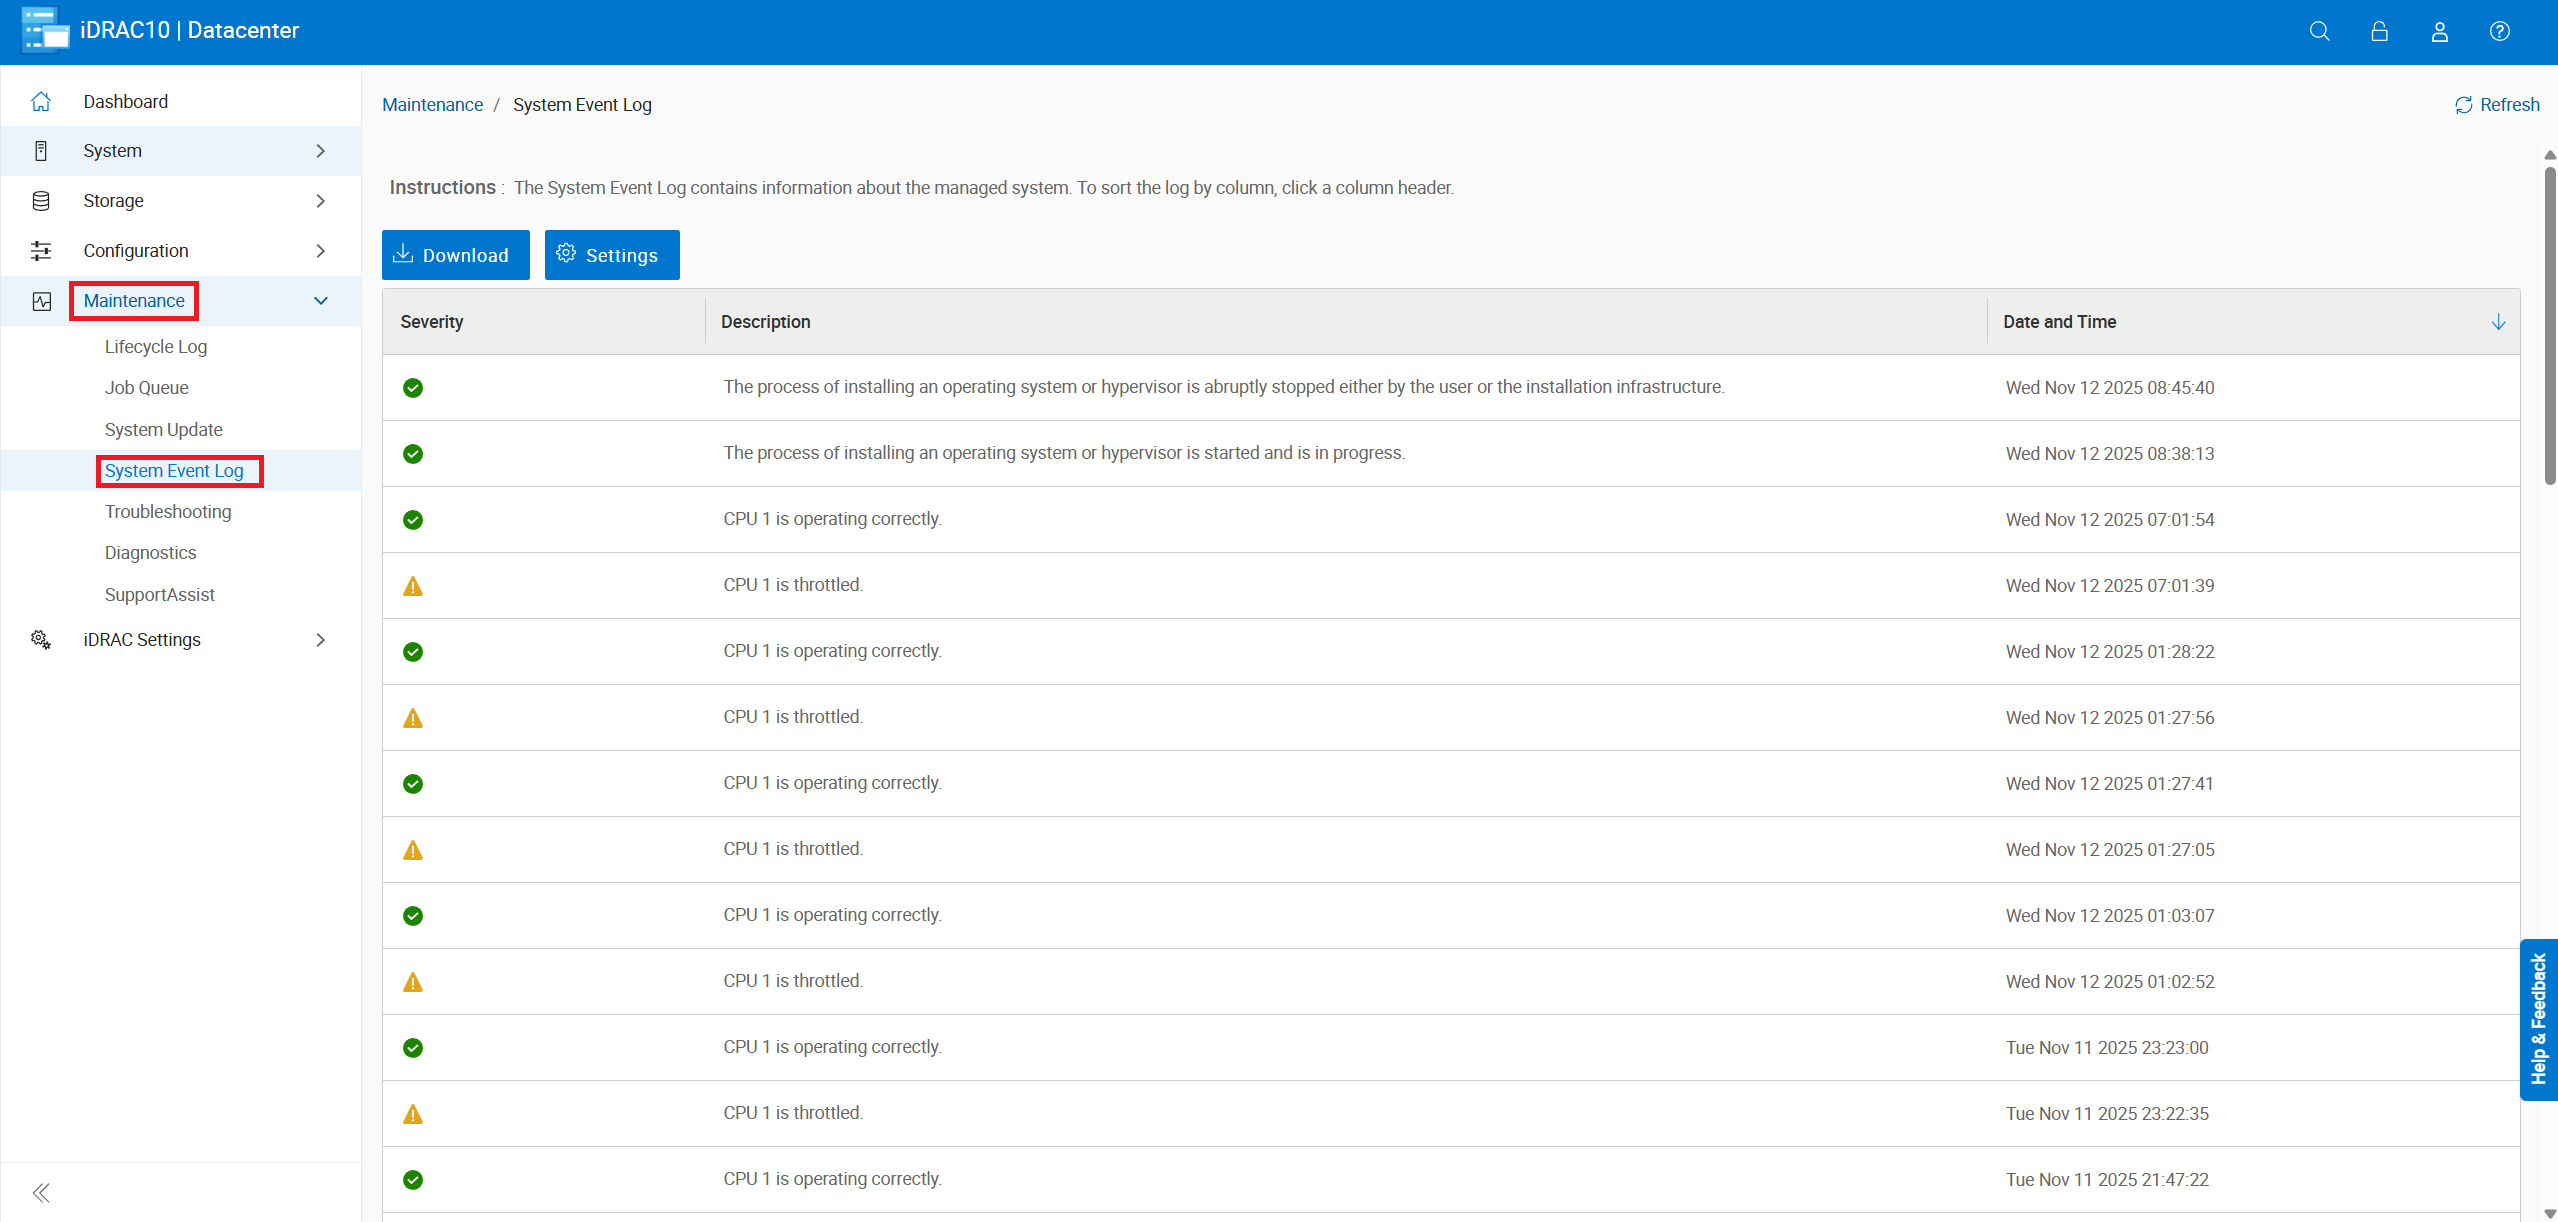
Figure 14: Click Maintenance -> System Event Log
Maintenance → SupportAssist:
- Start a collection to generate a SupportAssist Report (TSR).
- Monitor the log‑collection status.
- Check server warranty details.
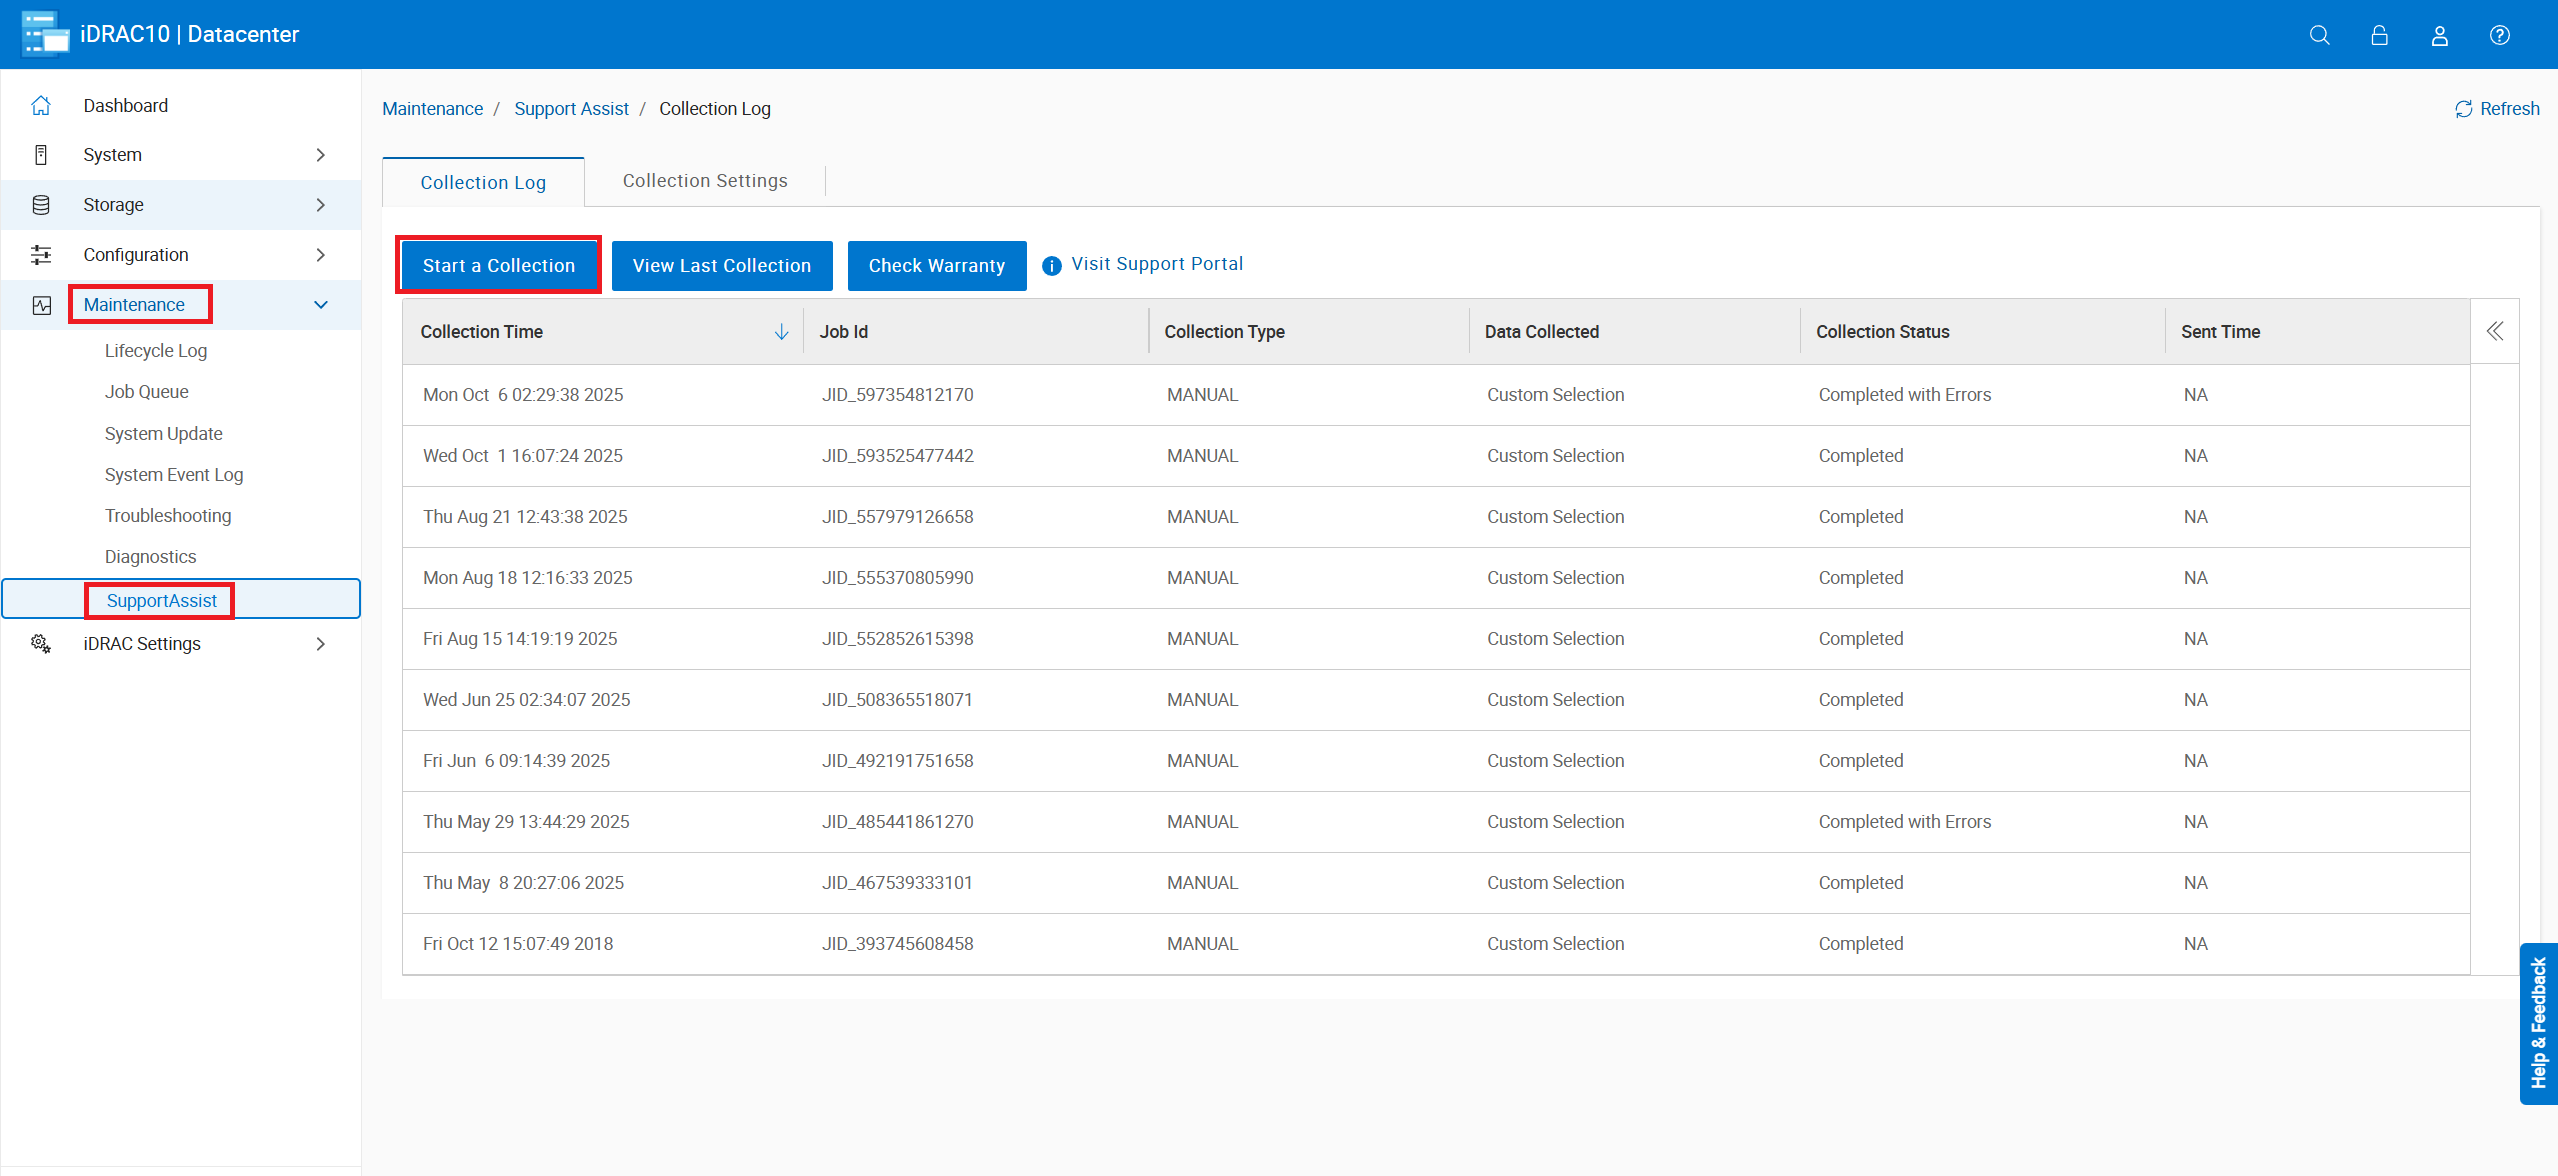
Figure 15: Click Maintenance -> SupportAssist
Storage → Summary:
- Assess overall storage health at a glance.
- Review recent storage events.
- Count virtual and physical disks.
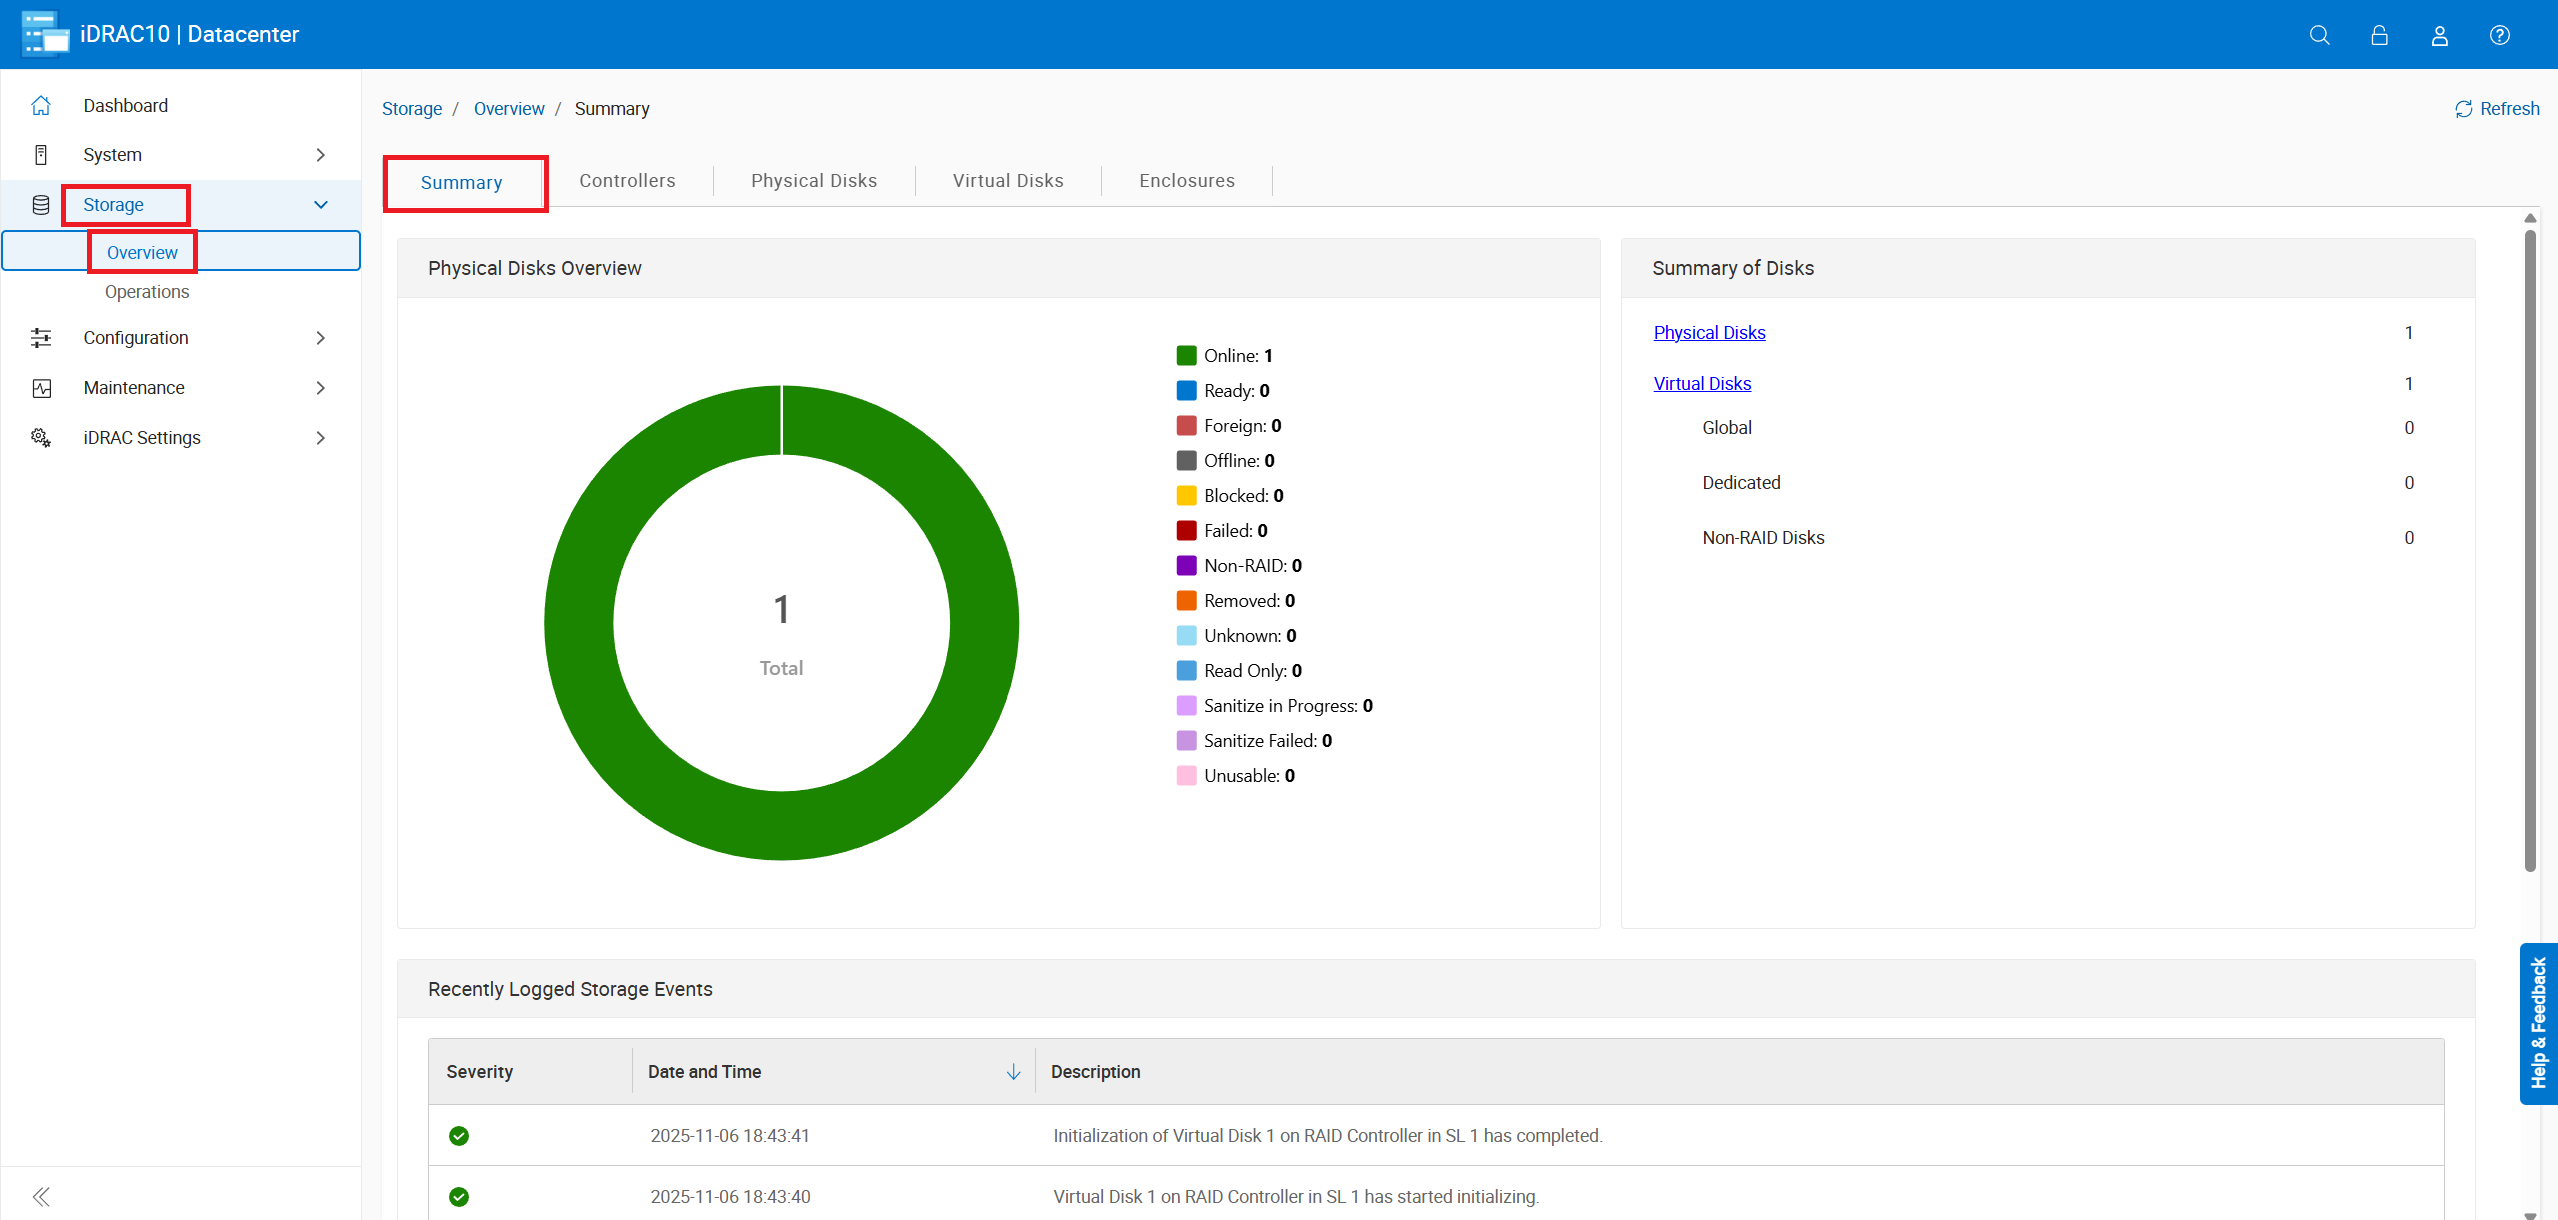
Figure 16: Click Storage -> Summary
Storage → Controllers:
- View installed storage controllers.
- Perform controller‑level actions as required.
- Check health of any controller batteries.
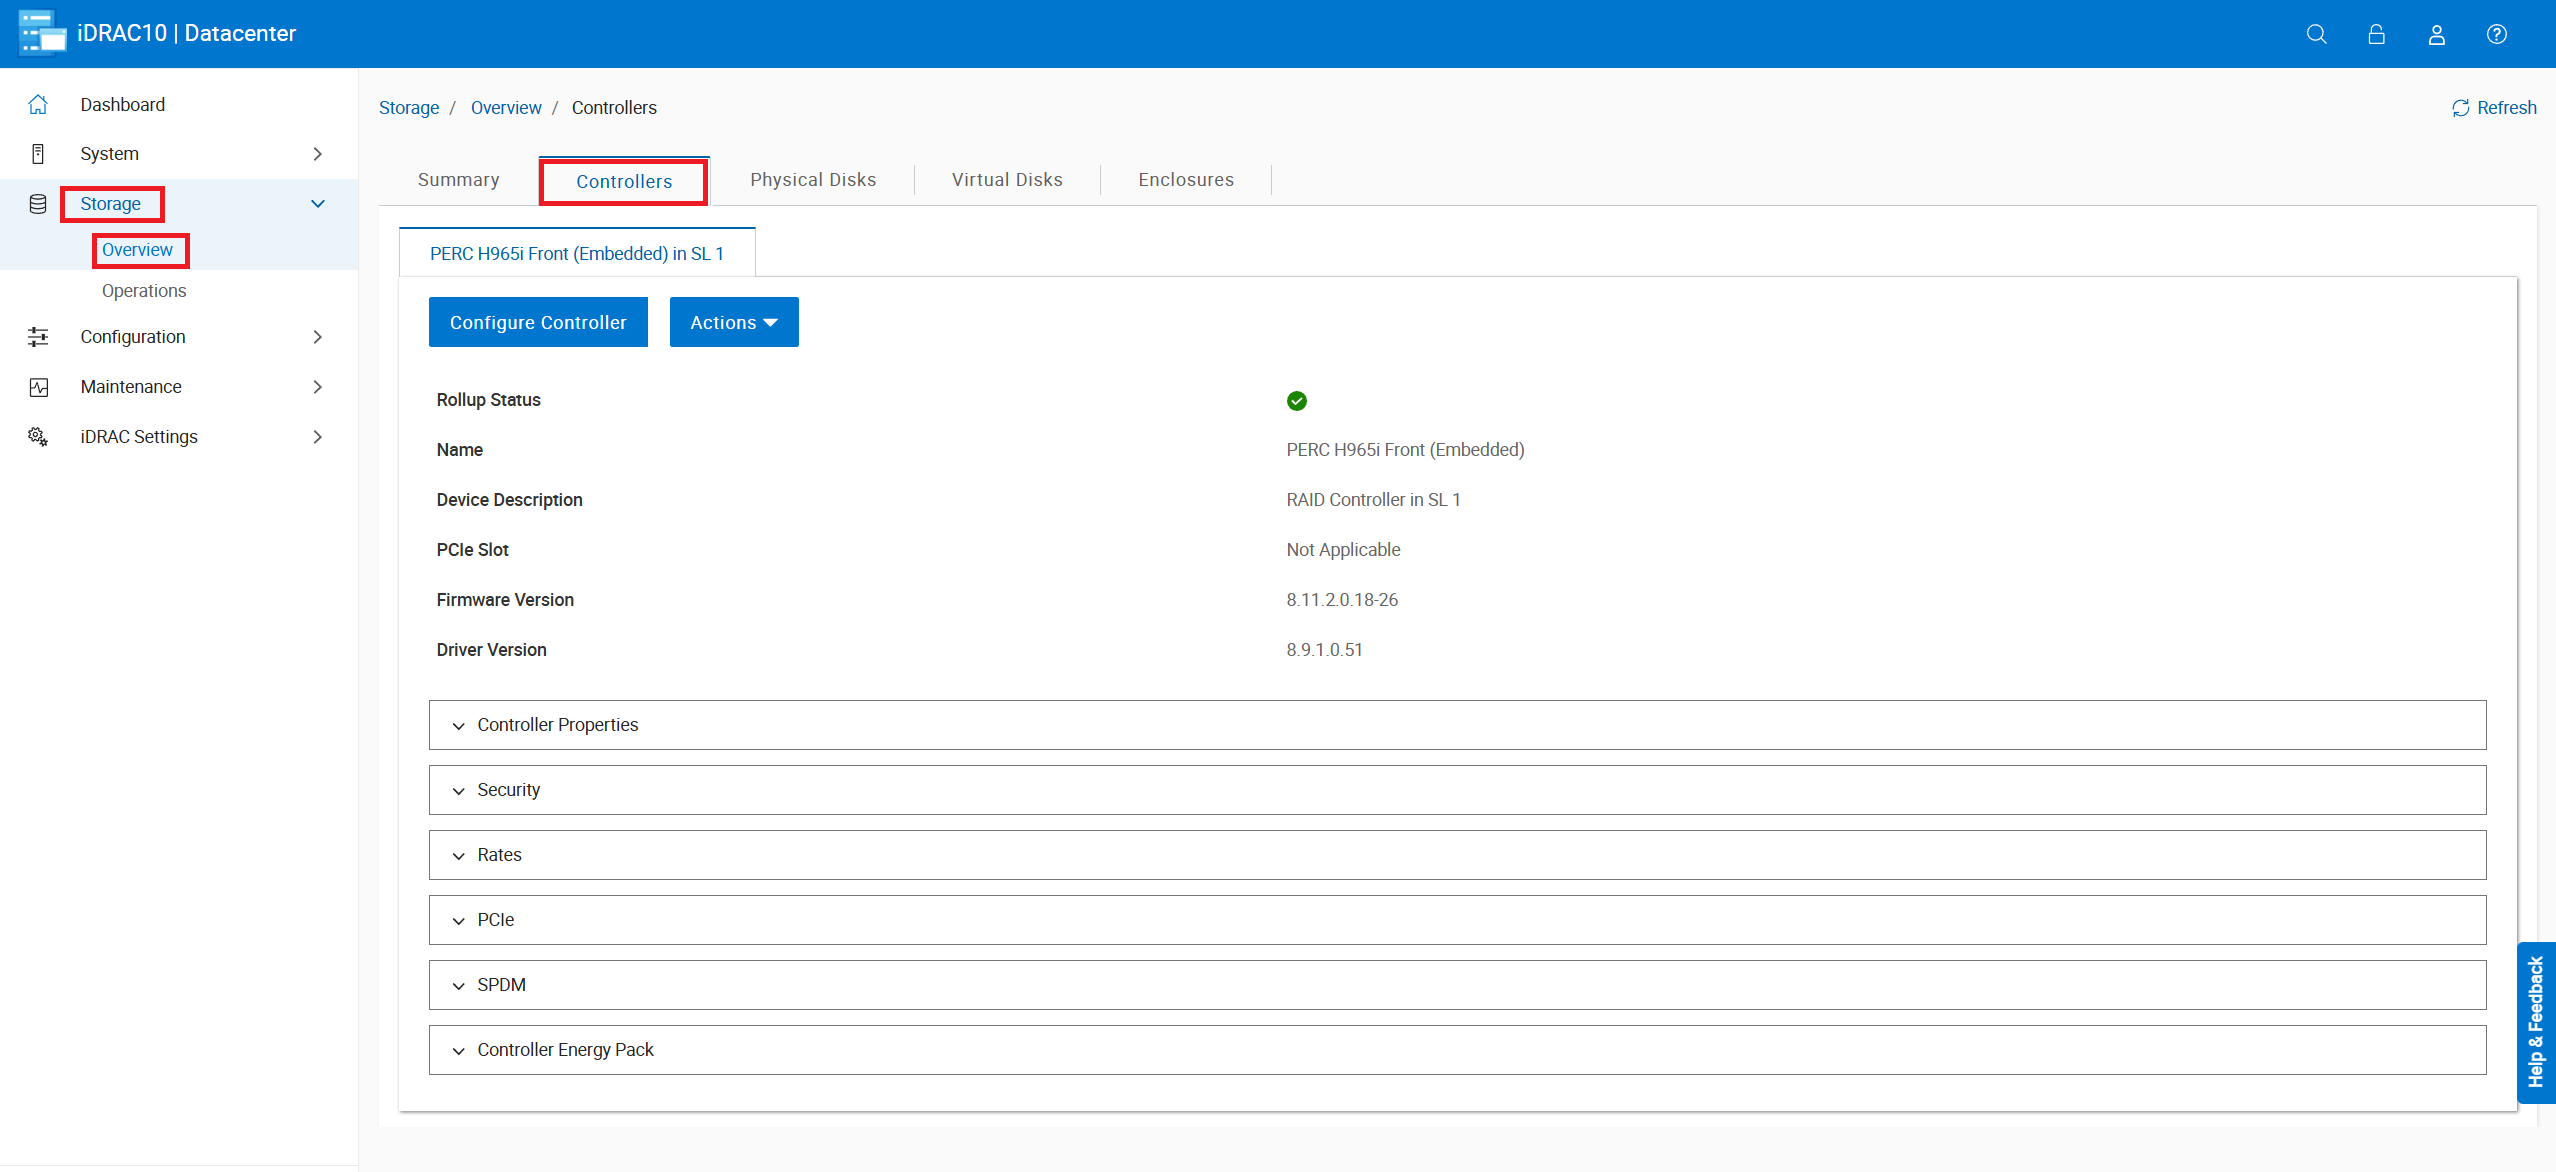
Figure 17: Navigate to Storage -> Overview -> Controllers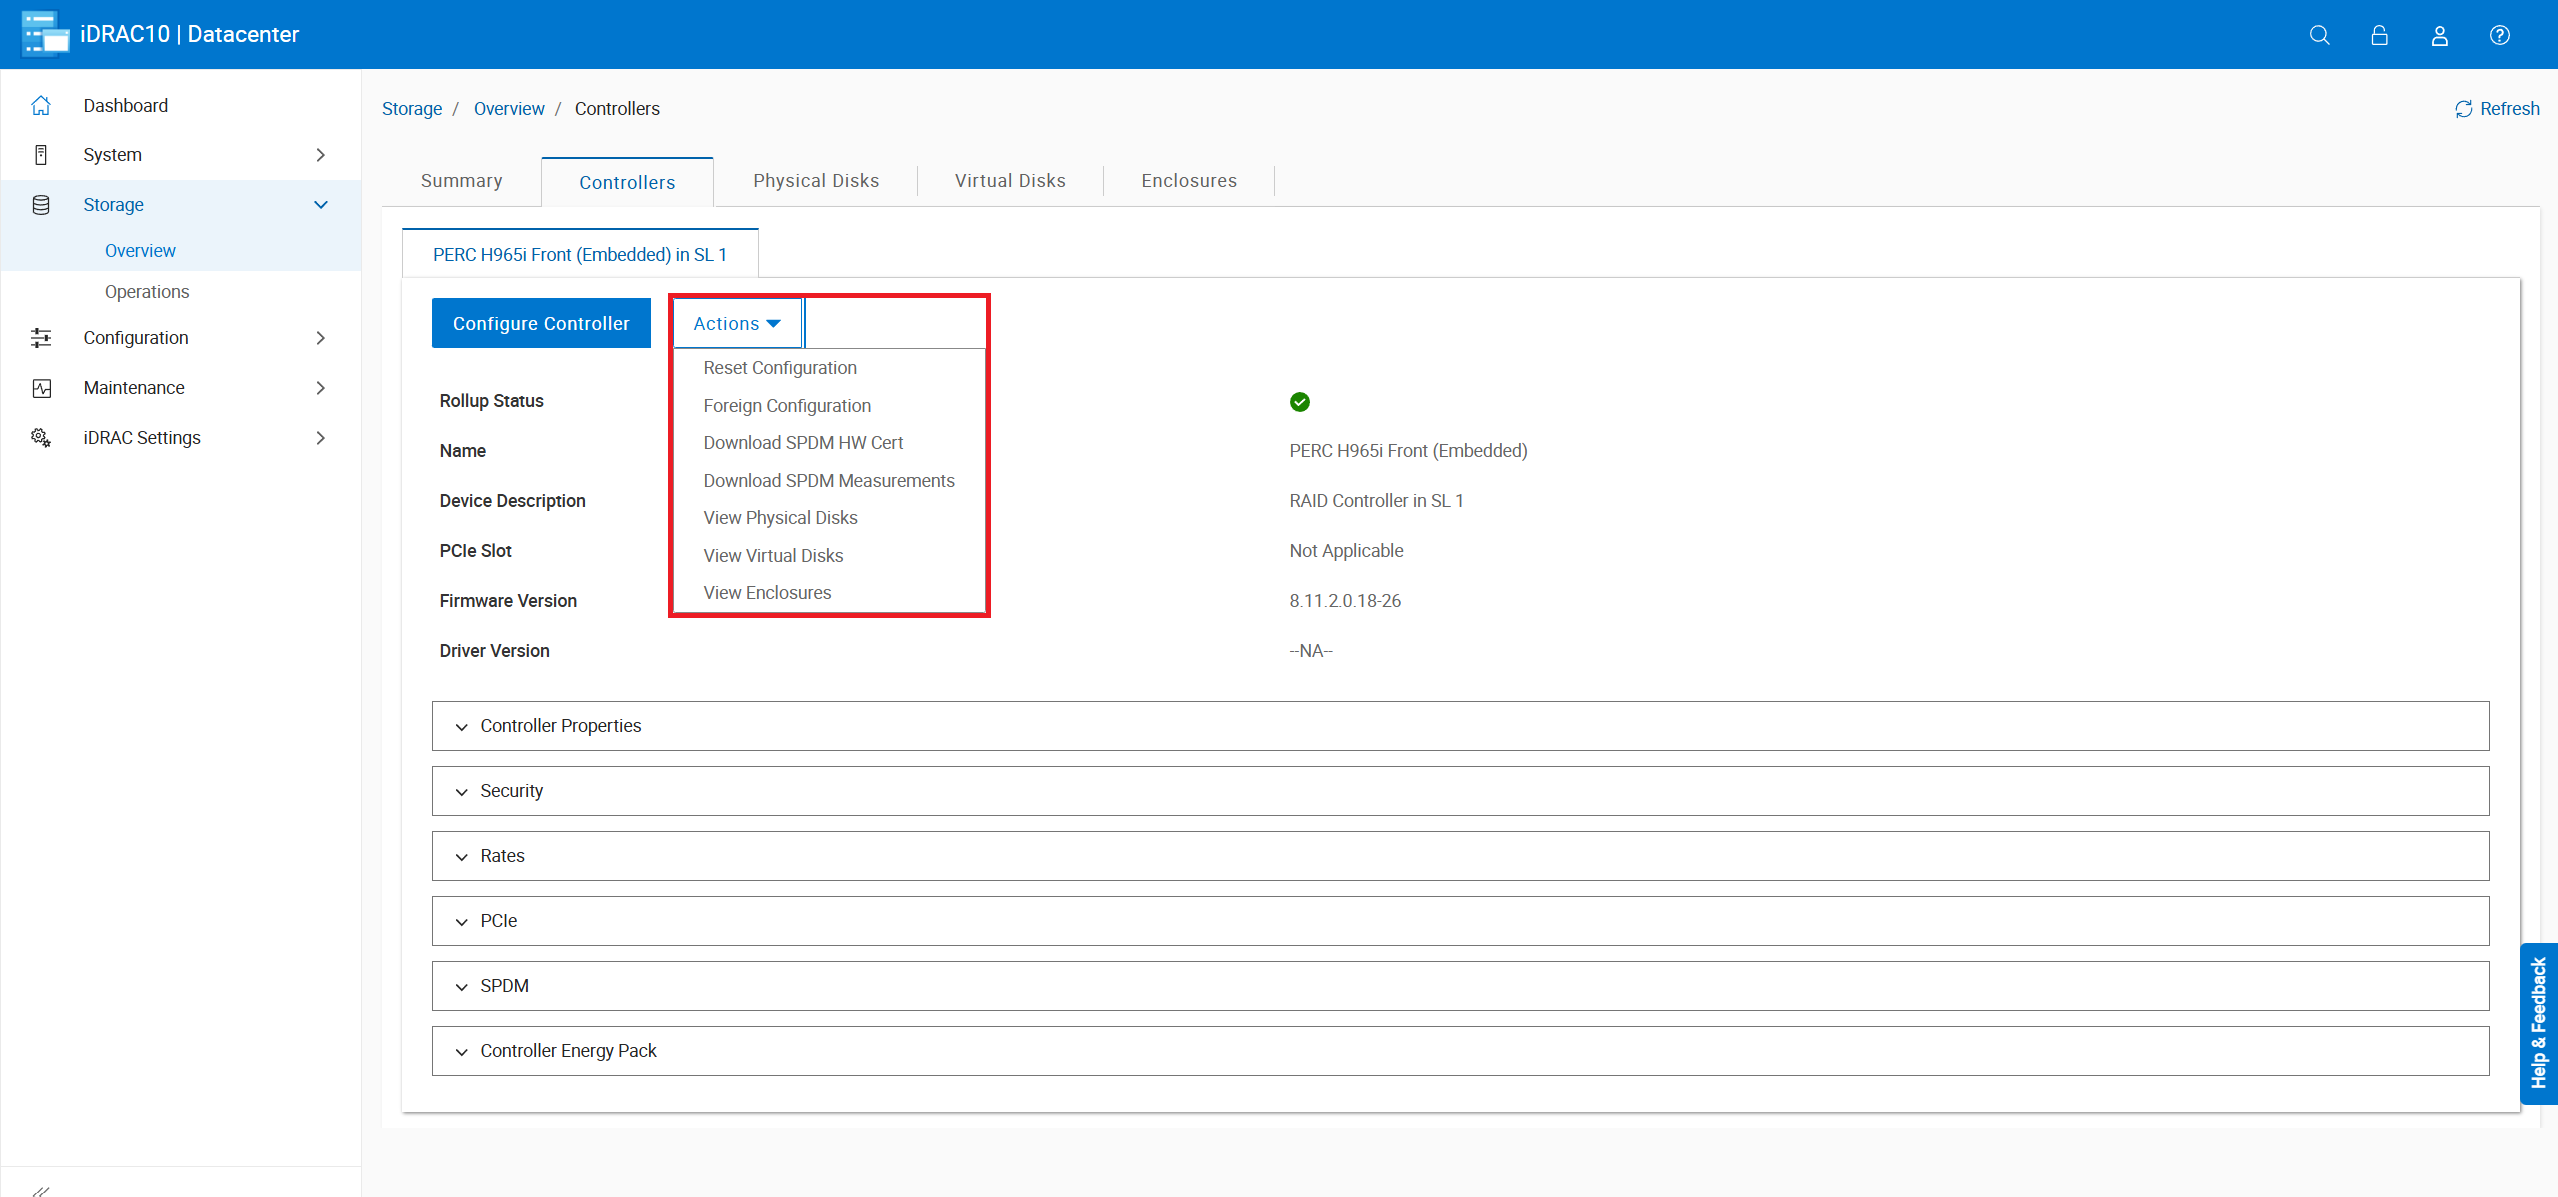
- Foreign Configuration - Allows you to clear any foreign configuration on single disks, or import foreign configuration of an entire array.
- For additional info, refer to - PowerEdge: How to Import a Foreign Configuration in the RAID Controller Using the System Setup Menu
- Never import foreign configuration into an online array as this can cause corruption merging old data from the foreign disk into the active array. Only import offline arrays.
- Discard Preserved Cache - The controller preserves the cache from a virtual disk if the virtual disk goes offline or is deleted because of missing physical disks. This preserved cache is preserved until you import the virtual disk or discard the cache.
- Importing foreign configuration is not possible when preserved cache is present.
Storage → Physical Disks:
- Inspect health status and detailed information for each disk.
- Perform disk actions (such as, secure erase, firmware update).
- Monitor physical disk rebuild progress.
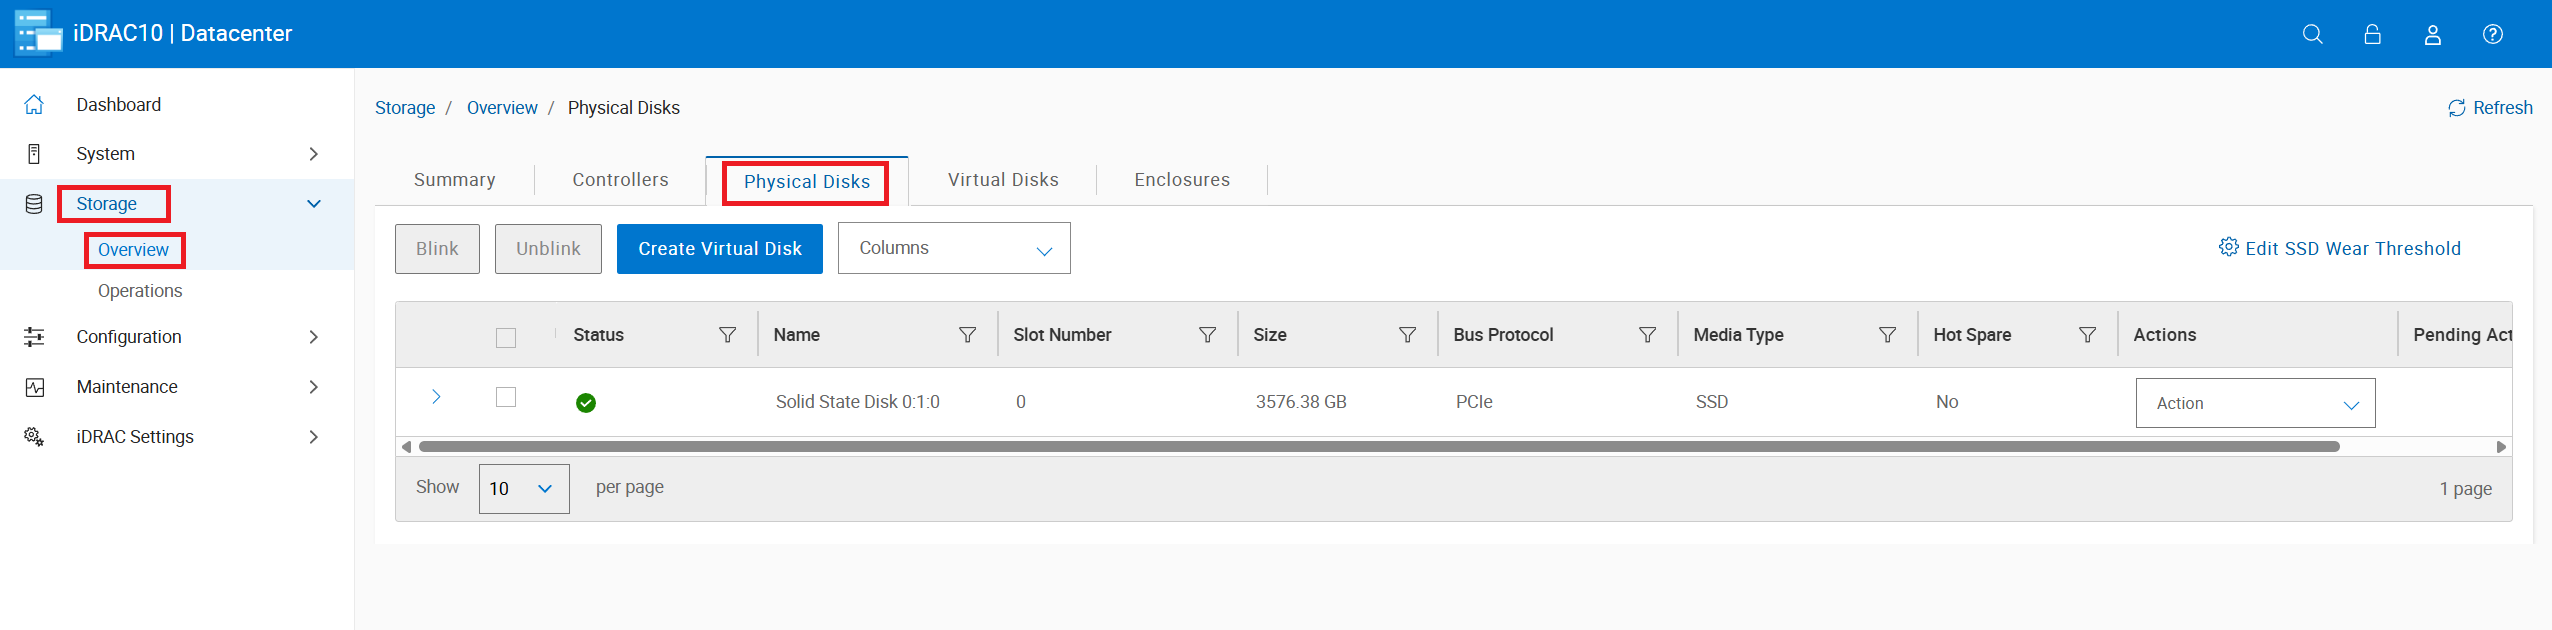
Figure 20: Select Storage -> Physical Disks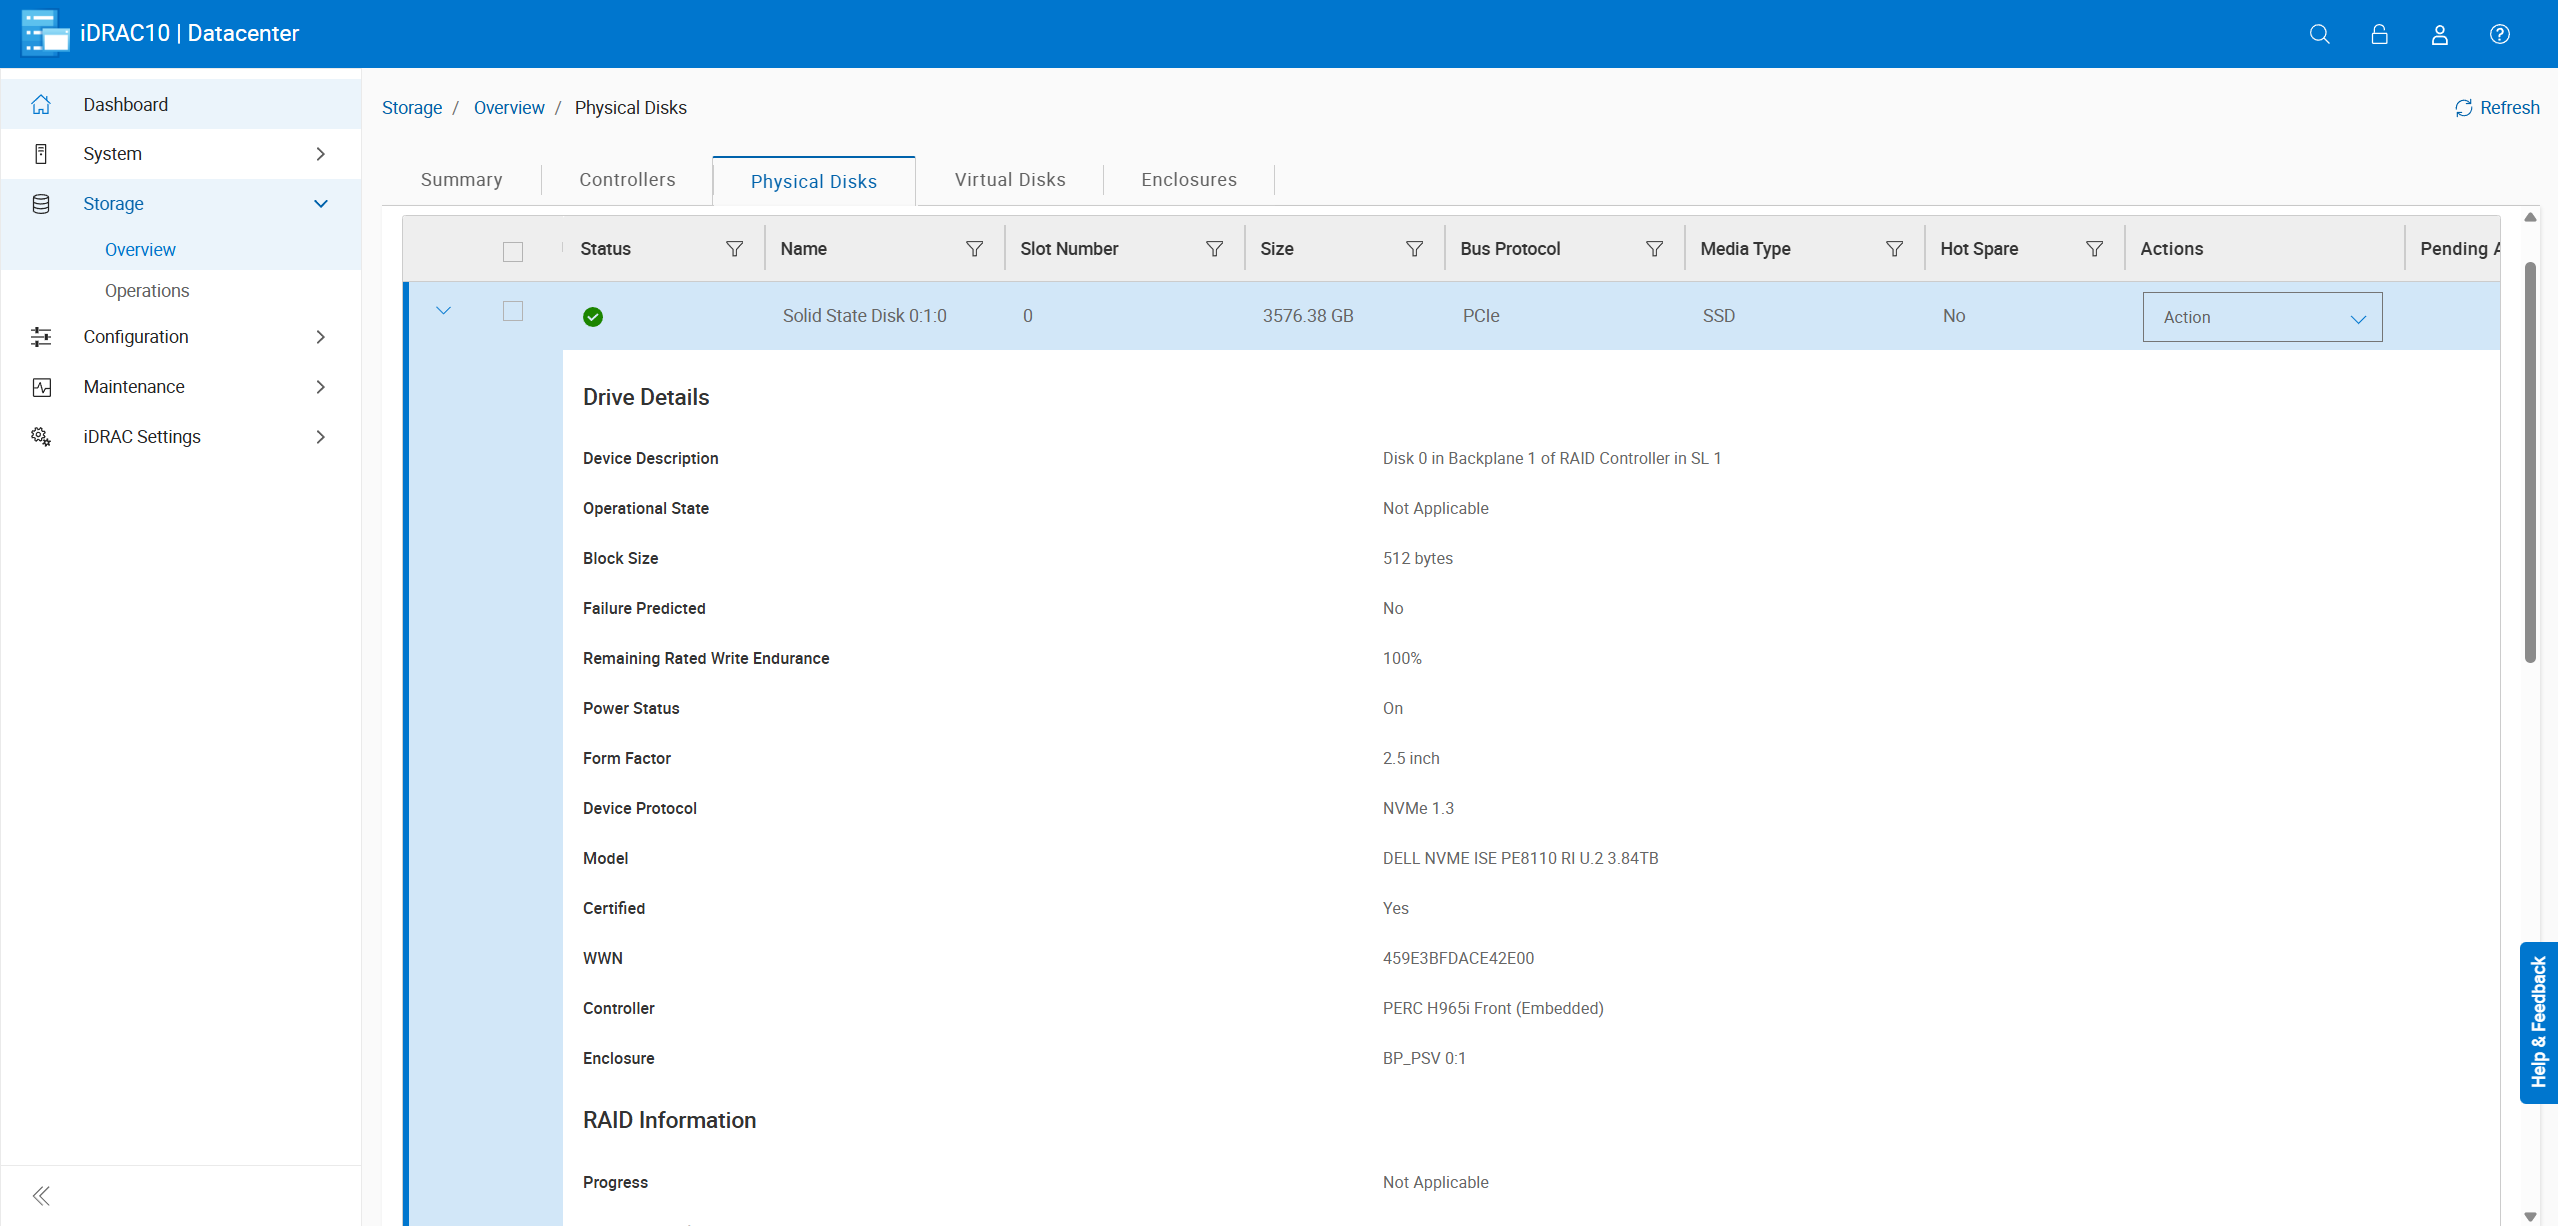
- The disk details show information such as if the disk is in predictive failed state or show the rebuild progress if the disk is in rebuild state.
Storage → Virtual Disks:
- Review health and configuration details of each virtual disk.
- Run Consistency Checks, RAID Level Migration, capacity expansions, or assign dedicated hot spares.
- Create a new virtual disk.
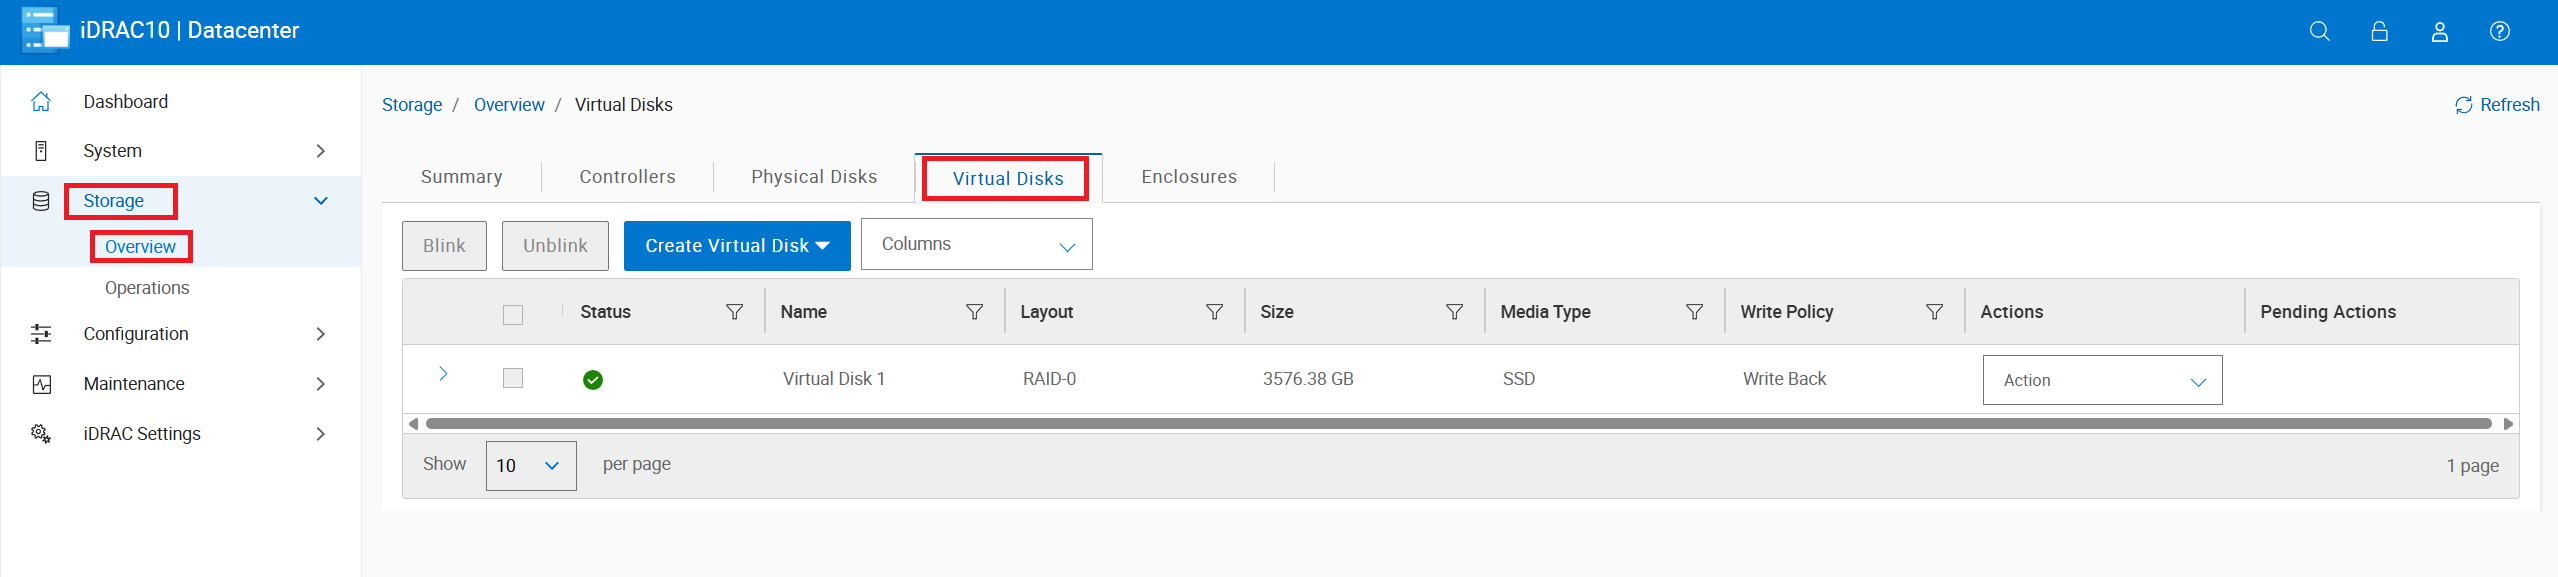
Figure 22: Click Storage -> Overview -> Virtual Disks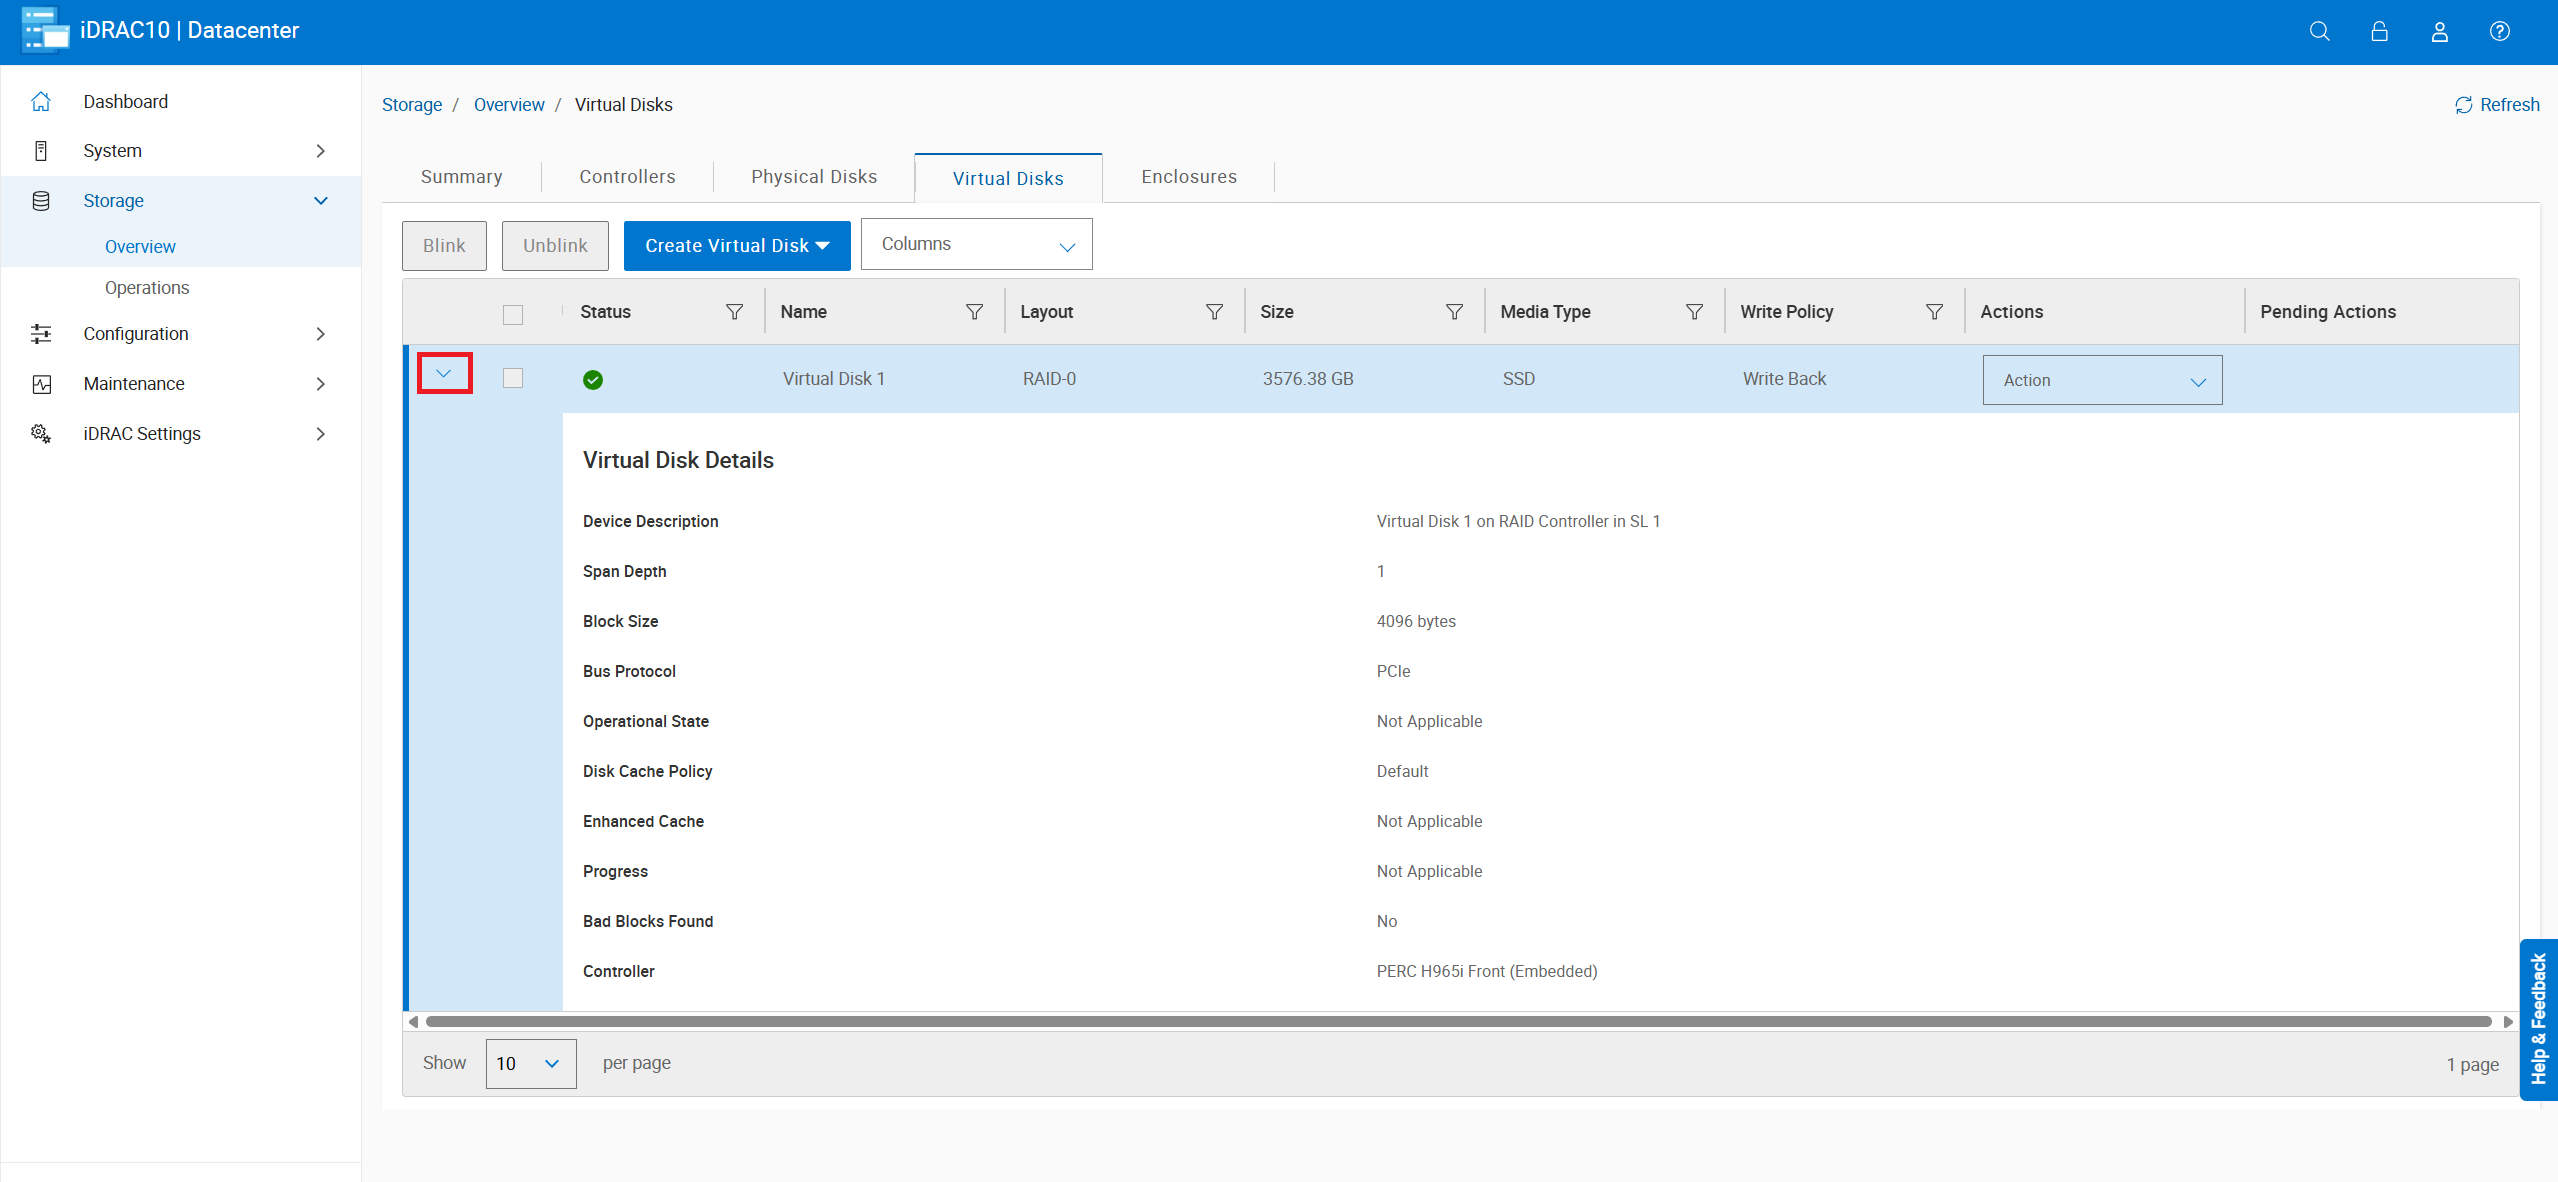
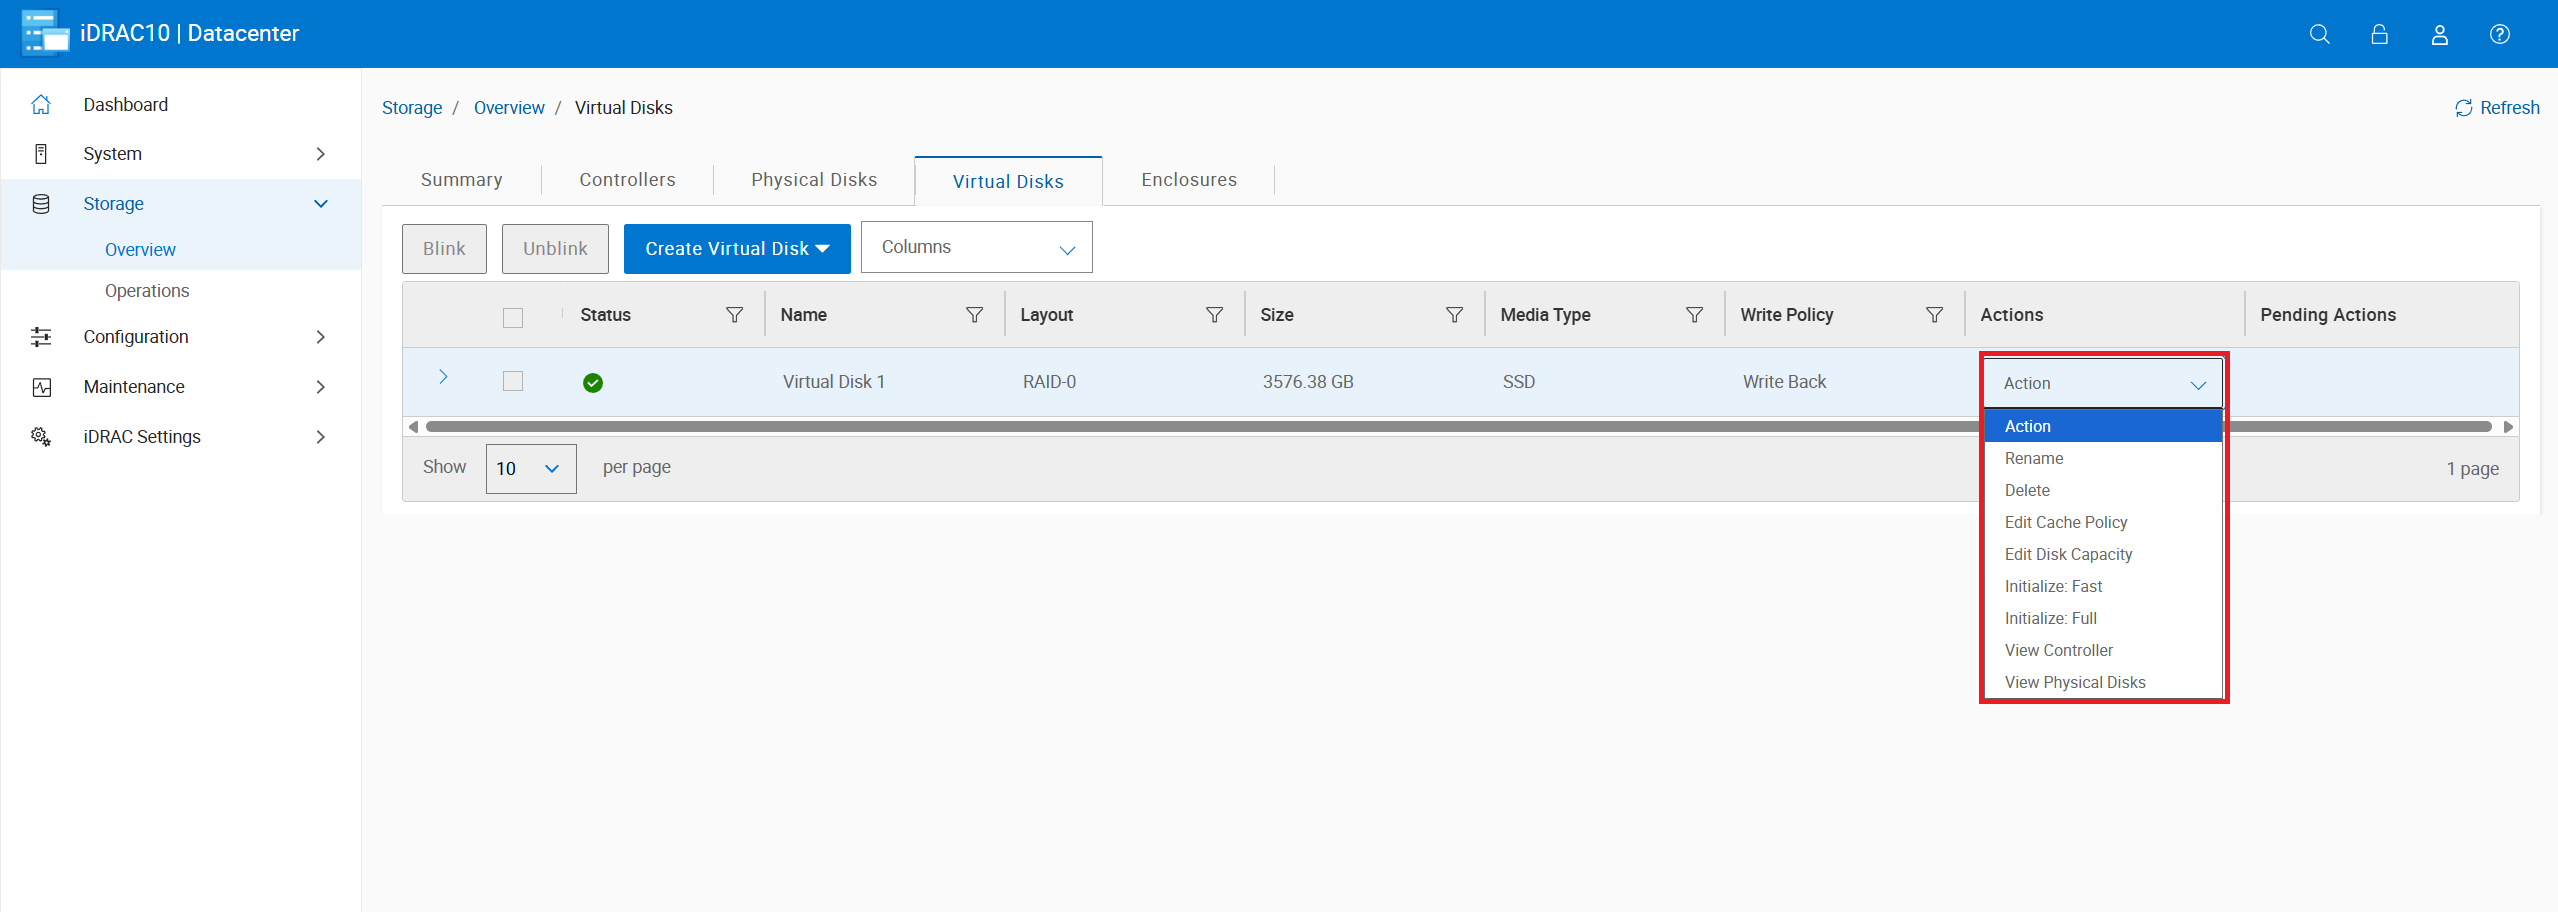
- The virtual disk actions allow you to perform tasks such as: RAID Level Migration (RLM), and Check Consistency.
- For more information about RAID Level Migration (RLM) refer to - PowerEdge: How to Reconfigure a Virtual Disk or Add More Hard Drives
- Consistency Check (CC) is a background operation that verifies and corrects the mirror or parity data for fault tolerant virtual disks. It is recommended that you periodically run a consistency check on virtual disks.
Additional Information
For monitoring servers with the IDRAC9 refer to: PowerEdge: How to Monitor Server Health from iDRAC9
Affected Products
iDRAC10 - 1.10.xx Series, iDRAC10 - 1.20.xx Series, PowerEdge M7701, PowerEdge M7725, PowerEdge R470, PowerEdge R570, PowerEdge R670, PowerEdge R6715, PowerEdge R6725, PowerEdge R770Products
PowerEdge R7715, PowerEdge R7725, PowerEdge R7725xd, PowerEdge XE7740, PowerEdge XE7745, PowerEdge XE9712, PowerEdge XE9780, PowerEdge XE9785LArticle Properties
Article Number: 000394350
Article Type: How To
Last Modified: 21 Nov 2025
Version: 2
Find answers to your questions from other Dell users
Support Services
Check if your device is covered by Support Services.