NetWorker: NVP vProxy Troubleshooting VM Backup and Restore Performance and Throughput
Summary: This article defines the diagnostic approach of troubleshooting Virtual Machine (VM) backup or restore performance issues when using the NetWorker VMware Protection (NVP) vProxy solution. ...
This article applies to
This article does not apply to
This article is not tied to any specific product.
Not all product versions are identified in this article.
Instructions
Performance-related issues involve many components, understanding the scope of the issue and environment are crucial in determining the answer for any performance-related question.
Considerations:
- Scope: Is the issue specific to one VM, a batch of VMs, or all VMs? Are there are differentiating factors between VMs where the issue is observed compared with VMs where no issue is seen (for example; location, configuration, size, and so forth)?
- vProxy Versioning: Ensure that the latest supported vProxy version is used to ensure optimized VMware and Data Domain libraries are used:
- Compatibility Requirements:
- Session Information:
- Backup or restore transport mode:
- The vProxy appliance supports HotAdd and Network Block Device (NBD) transport modes.
- The HotAdd and NBD session configuration is defined in the vProxy Properties. NetWorker Management Console (NMC) > Devices > VMware Proxies
- HotAdd connects the vProxy directly to the VMware datastores and VM disk files.
- NBD is expected to be slower as it goes over the ESXi management network. This can cause congestion on the VMware network.
- The default method used is HotAdd; however, in some configurations it is not possible to perform HotAdd. The NetWorker VMware Integration Guide for rmation about HotAdd/NBD.
- The VM backup and restore sessions (detailed below) show what transport mode was used in session.
- Backup Level: If backups are performing as level full, consider scheduling incremental. All VM backups are performed to Data Domain which creates virtual synthetic fulls. This means that all incremental backups are treated as a new full on the DD system, supporting "forever incremental." There is no Dell requirement to schedule level full backups unless required for compliance; this should be done sparingly when possible.
- Number of backup or restore sessions:
- Is the problem only observed under high backup or restore load, or is the problem observable if only one session is running.
- Parallelism:
- Backup Optimization Mode:
- The VMware protection groups support two backup Performance and Capacity. This setting can be found in the group properties from the NMC under Protection > Groups.
- Optimized for Capacity mode (default) uses variable size segmentation, which produces more overhead in data processing due to the higher deduplication rate, but reduces the capacity consumed on the Data Domain system.
- Optimized for Performance provides performance improvements when virtual machine incremental backups use Changed Block Tracking (CBT) and replicate data to a Data Domain system, and is effective when backing up large VMware Virtual Machine Disk (VMDK) files. Although Optimized for Performance results in additional space use on the Data Domain device (around 20%), this mode improves random I/O performance for instant access restores.
- Backup or restore transport mode:
- Device Information:
- Data Domain:
- Is the Data Domain a physical Data Domain, or a Data Domain Virtual Edition (DDVE)
- For DDVE, what is the deployment type, VMware ESXi hosted or Cloud hosted?
- Data Domain Model and Operating System version
- Data Domain proximity to the target vCenter? Is it in the same data center or is traffic traveling across the Internet/WAN?
- If there is packet loss or high latency (>= 50 ms) between the hosts involved (vCenter, vProxy, Data Domain), backup and restore performance may be impacted.
- Is the Data Domain a physical Data Domain, or a Data Domain Virtual Edition (DDVE)
- Data Domain:
- Cloud: Are any cloud components used in the environment, for example; VMware vCenter, Data Domain, so forth?
- Are the cloud components in the same region, or is data traveling across regions.
- Is any traffic traversing different infrastructure; for example, physical to cloud, traditional VMware to cloud, and so forth.
- For DDVE in Azure check the following from Azure Management Portal:
- Go to DDVE VM, from the Overview tab, look at the Size. This defines the compute resource tier of the Azure VM. Virtual machine sizes overview - Azure Virtual Machines | Microsoft Learn
- From the Overview tab, scroll down and click on Disk. Review the Storage Type, Size, Max IOPS, Max throughput (MB/s). Premium SSD is expected to perform better than Standard HDD. NetWorker operation throughput greater than the VM's Max throughput cannot be expected
- Go to DDVE VM, from the Overview tab, look at the Size. This defines the compute resource tier of the Azure VM. Virtual machine sizes overview - Azure Virtual Machines | Microsoft Learn

NOTE: NetWorker backup administrators must review cloud provider storage and network throughput documentation. In some instances, it may be necessary for the backup administrator to engage with the cloud provider vendor's support team.
- Location: Are the Data Domain and vCenter in the same data center, or does the backup or recover session go over the Internet.
- Connectivity and Latency: If there is packet loss or high latency (>= 50 ms) between the hosts involved (vCenter, vProxy, Data Domain), backup and restore performance may be impacted.
-
- vProxy: Backups fail with resource not found code -404 "Aging out inactive session"
- NetWorker Performance Optimization and Planning Guides found on the NetWorker Product Page on Dell Support
NOTE: Other considerations must be considered; however, the ones listed above are crucial.
This article is broken up into the following expandable areas which help target specific troubleshooting approaches:
Troubleshooting VM Backup Performance
- On the NetWorker server, create an input file (example:
vmperf) - Populate the input file with the following details:
. type: save job; vm_name: VM_NAME
sh vm_name; job output; start time; end time; job log file
p
NOTE: Replace VM_NAME with the name of the impacted VM. You can get this information from
mminfo -kot output.
- Using the
jobqueryand the input file, collect details about the job start and end times, and backup session log information.
[root@nwserver ~]# jobquery -i vmperf
Current query set
                    end time: 1654567313;
                job log file: \
/nsr/logs/policy/Gold/VMware/353252-winclient01-2022-6-6-19-1-53.log;
                  job output: Backup completed successfully.;
                  start time: 1654567245;
                     vm_name: winclient01;
end time: 1654480913;
                job log file: \
/nsr/logs/policy/Gold/VMware/353027-winclient01-2022-6-5-19-1-53.log;
                  job output: Backup completed successfully.;
                  start time: 1654480845;

                     vm_name: winclient01;
end time: 1654394509;
                job log file: \
/nsr/logs/policy/Gold/VMware/352801-winclient01-2022-6-4-19-1-47.log;
                  job output: Backup completed successfully.;
                  start time: 1654394446;
                     vm_name: winclient01;
- The times outputted are in UNIX time, but this can be converted with:
date -d@UNIX_TIME
Example:
[root@nwserver ~]# date -d@1654394446
Sat Jun  4 19:00:46 PDT 2022
[root@nwserver ~]# date -d@1654394509
Sat Jun  4 19:01:49 PDT 2022
- For backups that have a long backup run, review the job log file for information about the throughput:
[root@nwserver ~]# cat /nsr/logs/policy/Gold/VMware/352801-winclient01-2022-6-4-19-1-47.log | grep "DiskStats"
2022-06-05T02:01:48Z INFO:   [@(#) Build number: 95] DiskStats: Disk Label    |  Mode  | Bytes Moved |  Read Rate   |  Write Rate  |     Overhead  |   VDDK Wait   |   Total Time  | VM MORef  | VM Name
2022-06-05T02:01:48Z INFO:   [@(#) Build number: 95] DiskStats: ------------- | ------ | ----------- | ------------ | ------------ | ------------- | ------------- | ------------- | --------- | ------------------------------
2022-06-05T02:01:48Z INFO:   [@(#) Build number: 95] DiskStats: Hard disk 1   | hotadd |      94 MiB |     17 MiB/s |    103 MiB/s |       0:00:17 |       0:00:16 |       0:00:56 | vm-5001   | winclient01
2022-06-05T02:01:48Z INFO:   [@(#) Build number: 95] DiskStats: Total         |        |      94 MiB |     17 MiB/s |    103 MiB/s |       0:00:17 |       0:00:16 |       0:00:56 | vm-5001   | winclient01
2022-06-05T02:01:48Z INFO:   [@(#) Build number: 95] DiskStats: CSV: Generate stats in CSV format for friendly import to spreadsheet.
2022-06-05T02:01:48Z INFO:   [@(#) Build number: 95] DiskStats: CSV: VM MORef,VM Name,Disk Label,Mode,Bytes Moved,Total Time (sec),Overhead (sec),VDDK Wait (sec),Read Rate (b/s),Write Rate (b/s)
2022-06-05T02:01:48Z INFO:   [@(#) Build number: 95] DiskStats: CSV: vm-5001,winclient01,Hard disk 1,hotadd,98369536,56,17,17,17673109,107196400
NOTE: On days where the backup takes longer than usual the Total Write Speed is lower than the average seen across other backup sessions.
- The policy logs for the specific VM can be reviewed by running:
cat /nsr/policy/POLICY_NAME/WORKFLOW_NAME/*VM_NAME*.log | grep DiskStats
Example:
[root@nwserver ~]# cat /nsr/logs/policy/Gold/VMware/*winclient01*.log | grep "DiskStats"
2022-06-05T02:01:48Z INFO:   [@(#) Build number: 95] DiskStats: Disk Label    |  Mode  | Bytes Moved |  Read Rate   |  Write Rate  |     Overhead  |   VDDK Wait   |   Total Time  | VM MORef  | VM Name
2022-06-05T02:01:48Z INFO:   [@(#) Build number: 95] DiskStats: ------------- | ------ | ----------- | ------------ | ------------ | ------------- | ------------- | ------------- | --------- | ------------------------------
2022-06-05T02:01:48Z INFO:   [@(#) Build number: 95] DiskStats: Hard disk 1   | hotadd |      94 MiB |     17 MiB/s |    103 MiB/s |       0:00:17 |       0:00:16 |       0:00:56 | vm-5001   | winclient01
2022-06-05T02:01:48Z INFO:   [@(#) Build number: 95] DiskStats: Total         |        |      94 MiB |     17 MiB/s |    103 MiB/s |       0:00:17 |       0:00:16 |       0:00:56 | vm-5001   | winclient01
2022-06-05T02:01:48Z INFO:   [@(#) Build number: 95] DiskStats: CSV: Generate stats in CSV format for friendly import to spreadsheet.
2022-06-05T02:01:48Z INFO:   [@(#) Build number: 95] DiskStats: CSV: VM MORef,VM Name,Disk Label,Mode,Bytes Moved,Total Time (sec),Overhead (sec),VDDK Wait (sec),Read Rate (b/s),Write Rate (b/s)
2022-06-05T02:01:48Z INFO:   [@(#) Build number: 95] DiskStats: CSV: vm-5001,winclient01,Hard disk 1,hotadd,98369536,56,17,17,17673109,107196400
2022-06-06T02:01:48Z INFO:   [@(#) Build number: 95] DiskStats: Disk Label    |  Mode  | Bytes Moved |  Read Rate   |  Write Rate  |     Overhead  |   VDDK Wait   |   Total Time  | VM MORef  | VM Name
2022-06-06T02:01:48Z INFO:   [@(#) Build number: 95] DiskStats: ------------- | ------ | ----------- | ------------ | ------------ | ------------- | ------------- | ------------- | --------- | ------------------------------
2022-06-06T02:01:48Z INFO:   [@(#) Build number: 95] DiskStats: Hard disk 1   | hotadd |      95 MiB |     16 MiB/s |    119 MiB/s |       0:00:17 |       0:00:16 |       0:00:56 | vm-5001   | winclient01
2022-06-06T02:01:48Z INFO:   [@(#) Build number: 95] DiskStats: Total         |        |      95 MiB |     16 MiB/s |    119 MiB/s |       0:00:17 |       0:00:16 |       0:00:56 | vm-5001   | winclient01
2022-06-06T02:01:48Z INFO:   [@(#) Build number: 95] DiskStats: CSV: Generate stats in CSV format for friendly import to spreadsheet.
2022-06-06T02:01:48Z INFO:   [@(#) Build number: 95] DiskStats: CSV: VM MORef,VM Name,Disk Label,Mode,Bytes Moved,Total Time (sec),Overhead (sec),VDDK Wait (sec),Read Rate (b/s),Write Rate (b/s)
2022-06-06T02:01:48Z INFO:   [@(#) Build number: 95] DiskStats: CSV: vm-5001,winclient01,Hard disk 1,hotadd,99221504,57,17,17,16272803,124243462
2022-06-07T02:01:49Z INFO:   [@(#) Build number: 95] DiskStats: Disk Label    |  Mode  | Bytes Moved |  Read Rate   |  Write Rate  |     Overhead  |   VDDK Wait   |   Total Time  | VM MORef  | VM Name
2022-06-07T02:01:49Z INFO:   [@(#) Build number: 95] DiskStats: ------------- | ------ | ----------- | ------------ | ------------ | ------------- | ------------- | ------------- | --------- | ------------------------------
2022-06-07T02:01:49Z INFO:   [@(#) Build number: 95] DiskStats: Hard disk 1   | hotadd |      97 MiB |     15 MiB/s |    110 MiB/s |       0:00:16 |       0:00:16 |       0:00:57 | vm-5001   | winclient01
2022-06-07T02:01:49Z INFO:   [@(#) Build number: 95] DiskStats: Total         |        |      97 MiB |     15 MiB/s |    110 MiB/s |       0:00:16 |       0:00:16 |       0:00:57 | vm-5001   | winclient01
2022-06-07T02:01:49Z INFO:   [@(#) Build number: 95] DiskStats: CSV: Generate stats in CSV format for friendly import to spreadsheet.
2022-06-07T02:01:49Z INFO:   [@(#) Build number: 95] DiskStats: CSV: VM MORef,VM Name,Disk Label,Mode,Bytes Moved,Total Time (sec),Overhead (sec),VDDK Wait (sec),Read Rate (b/s),Write Rate (b/s)
2022-06-07T02:01:49Z INFO:   [@(#) Build number: 95] DiskStats: CSV: vm-5
NOTE: The policy logs follow the
jobsdb retention (default: 72 hours.) After the jobsdb window has passed the associated policy logs and jobquery entries are removed; however, the vProxy appliance retains VM backup session logs locally under /opt/emc/vproxy/runtime/logs/recycle/vbackupd/.
Troubleshooting VM Restore Performance
For restores that are in progress, the throughput can be observed in the Recover tab "Rate" column:
Troubleshooting VM Restore Performance
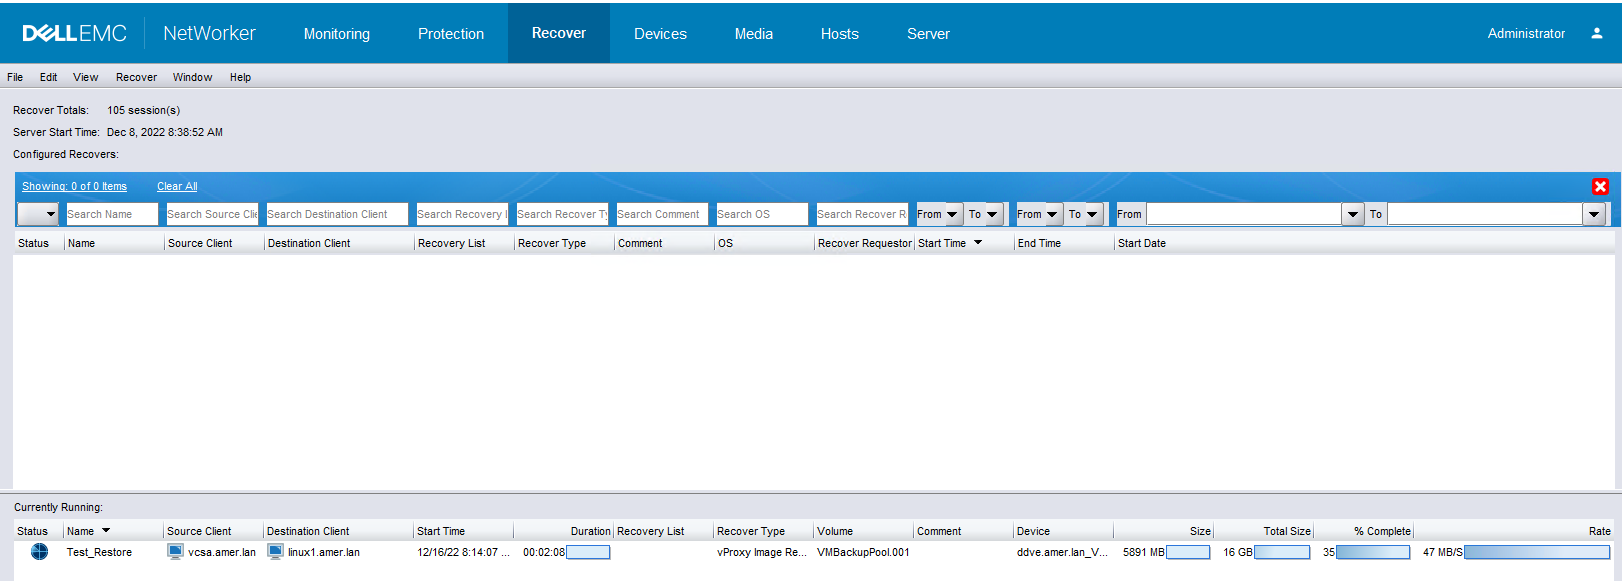
Once the restore job session completed, the restore log can be reviewed from the following locations:
- NetWorker Management Console: Open the saved recover session. The log window details about the throughput on the disks. The recover logs are subject to
jobsdbretention (default 72 hours) if this time has passed, the recover session log is removed from the NetWorker server but continue to reside on vProxy appliance. - NetWorker server:
- Linux:
/nsr/logs/recover/RecoverName.log - Windows:
C:\Program Files\EMC NetWorker\nsr\logs\recover\RecoverName.log - The recover logs are subject to
jobsdbretention (default 72 hours.) If this time has passed, the recover session log is removed from the NetWorker server but continue to reside on the vProxy appliance.
- Linux:
- vProxy Appliance: completed/failed VM recover session logs can be found on the vProxy appliance under
/opt/emc/vproxy/runtime/logs/recycle/vrecoverd/date/recover_session_id.log
All the above logs contain similar output regarding throughput of the recovered session, per disk:
2022-12-16T16:18:50Z NOTICE: [@(#) Build number: 54] Successfully recovered to a new VM.
2022-12-16T16:18:50Z INFO:   [@(#) Build number: 54] Disk Label    |  Mode  | Bytes Moved |  Read Rate   |  Write Rate  |     Overhead  |   VDDK Wait   |   Total Time  | VM MORef  | VM Name
2022-12-16T16:18:50Z INFO:   [@(#) Build number: 54] ------------- | ------ | ----------- | ------------ | ------------ | ------------- | ------------- | ------------- | --------- | ------------------------------
2022-12-16T16:18:50Z INFO:   [@(#) Build number: 54] Hard disk 1   | hotadd |      10 GiB |     44 MiB/s |     68 MiB/s |       0:00:17 |        1.4 us |       0:04:25 | vm-12226  | linuxclient01_1
2022-12-16T16:18:50Z INFO:   [@(#) Build number: 54] Total         |        |      10 GiB |     44 MiB/s |     68 MiB/s |       0:00:17 |        1.4 us |       0:04:25 | vm-12226  | linuxclient01_1
2022-12-16T16:18:50Z INFO:   [@(#) Build number: 54] CSV: Generate stats in CSV format for friendly import to a spreadsheet.
2022-12-16T16:18:50Z INFO:   [@(#) Build number: 54] CSV: VM MORef,VM Name,Disk Label,Mode,Bytes Moved,Total Time (sec),Overhead (sec),VDDK Wait (sec),Read Rate (b/s),Write Rate (b/s)
2022-12-16T16:18:50Z INFO:   [@(#) Build number: 54] CSV: vm-12226,linuxclient01_1,Hard disk 1,hotadd,10032185344,265,18,0,45138154,71134513
2022-12-16T16:18:50Z NOTICE: [@(#) Build number: 54] Moved 10 GiB at 36 MiB/s. Elapsed Time: 4m31s
Troubleshooting Performance Throughput from vProxy - ddpconnchk
ddpconnchkThe ddpconnchk tool can be used to test network connectivity and throughput from the vProxy to the DD device.
Collecting ddpconnchk:
- Download the
ddpconnchkutility from Dell NetWorker Tools - The
ddpconnchk.zipcontains multiple versions of theddpconnchkutility. Use theddpconnchkutility that matches or closely aligns with the DD OS version of the Data Domain device. - Extract the zipped package and copy the
ddpconnchk_linux_x86_64.tarto the vProxy's/home/admin directory.
Using ddpconnchk:
- Log in to the vProxy
ddpconnchk_linux_x86_64.tar was copied to. Log in over SSH using the admin account. - Change to root user:
sudo su - - Extract the
.tarpackage:tar xvf /home/admin/ddpconnchk_linux_x86_64.tar - Set the permissions of
ddpconnchk: chmod 775 ddpconnchk - An example test would be a write dump from the vProxy to a
ddboostdevice:
/ddpconnchk -s DATADOMAIN_HOSTNAME -u ddboost_username -l storage_unit_name -T writeimage -i 1G -n 1
Example:
vproxy01:~ # ls -l | grep ddpconnchk
-rwxrwxr-x 1 59899 59899 3688848 May 16  2022 ddpconnchk
-rw-r--r-- 1 59899 59899   12086 May 16  2022 ddpconnchk_README.txt

vproxy01:~ # ./ddpconnchk -s ddve.amer.lan -u sysadmin -p EmcLegato@01 -l linux1 -T writeimage -i 1G -n 1
DDP CLIENT LIBRARY VERSION 7:9:0:0-1010470

SERVER: ddve.amer.lan
---------------------
*** CONNECT SERVER TEST, ddve.amer.lan

DDP Connect Server Test PASSED

*** LIST SUs TEST, ddve.amer.lan
DDLOG: WARN: [68A0:1FBF0F0] ddcl_ddp_get_su(): Deprecated API ddp_get_storage_units_list is used by client
  3 SUs total
List SUs Test PASSED

*** GET SU INFO TEST, ddve.amer.lan/linux1

  5 images total
Get SU Info Test PASSED

*** EXTENDED TEST: WRITE IMAGE, ddve.amer.lan/linux1/1073741824
DDLOG: INFO: [68A0:1FBF0F0] ddcl_new_client_buffers created private pool with 776 DDCL buffers
DDLOG: INFO: [68A0:1FBF0F0] Cleaning up readahead cache do_ra is 1 ra_init is 0
DDLOG: INFO: [68A0:1FBF0F0] vrapid_nfs_connect: ifgroup disabled
DDLOG: INFO: [68A0:1FBF0F0] JOB END  IMAGE_DELETE ip=192.168.7.105 pid=26784 cd=0 enc=off
DDLOG: INFO: [68A0:1FBF0F0] JOB START  IMAGE_WRITE ip=192.168.7.105 pid=26784 cd=0 enc=off linux1/write_000
DDLOG: INFO: [68A0:1FBF0F0] ddcl_ddcp_ctx_init():358 - idx=3408002, detect_markers=1
DDLOG: INFO: [68A0:1FBF0F0] New fingerprint environment.

DDLOG: INFO: [68A0:1FBF0F0] Segmentation: version [9], min [4096], avg [8192], max [12288], mask = [0x0], skip_first [4096], skip_last [0]
DDLOG: INFO: [68A0:1FBF0F0] ddcl_new_client_buffers created private pool with 776 DDCL buffers
DDLOG: INFO: [68A0:1FBF0F0] Allocated read_ctx_pool of size 223488
DDLOG: INFO: [68A0:1FBF0F0] JOB START  IMAGE_READ ip=192.168.7.105 pid=26784 cd=0 enc=off linux1/write_000
Cumulative Write Throughput: 102.40 MB/s
Cumulative Read Throughput: 102.40 MB/s


WRITE IMAGE PASSED
SUCCESS: All tests completed
-i 1gdetermines the size that is written to DDR 1 g = 1 GB file which is the maximum size-n 1determines how many files are created.- These files are temporary and are deleted once the test operation has been completed.
Data Domain has multiple Network Interface Cards (NIC), and vProxy is using 1 GB management NIC.
There are multiple NICs on the Data Domain system. The management NIC is typically a 1GB interface, the Data Domain may also have 10GB NICs for data movement.
- Identify the IP addresses of the 1GB NIC and the 10GB NICs. The Data Domain administrator must confirm this.
- Confirm which IP address resolves to the Data Domain/device name used by the NetWorker server and storage node:
nslookup DataDomain_hostname
- If the NetWorker server storage node (if used) or vProxy appliance is resolving to the 1GB IP address, create a host file entry on the systems resolving the 1GB IP address to resolve the Data Domain hostname to the 10GB IP address.
- If changes are made to the vProxy appliance reload daemons
systemctl reload-daemon
systemctl restart <service>
services: vrecoverd, vbackupd, vflrd
- Restart backup and restore and confirm if throughput has increased.
Troubleshooting Data Domain Performance - precert logging and DD System Metrics
Troubleshooting Data Domain Performance - precert logging and DD System Metrics
Data Domain Boost Precert Logging:
- Open an SSH session to the vProxy and log in as admin. Then switch to root:
sudo su - - Create the following file:
vi /ddboost_precert.ini
precert_enabled=true num_log_files=4 log_file_size=512 log_file_name=ddboost_precert.log log_file_dir=/DDLog ddcl_logs_include=true ddcl_logs_sev=3 - Create the logging directory:
mkdir /DDLog ; chmod 777 /DDLog - Enable debug on the vProxy engine you are troubleshooting:
vbackupd: /opt/emc/vproxy/bin/vProxy_debug.sh -s -d vbackupd -p ddboost -l debug vflrd: /opt/emc/vproxy/bin/vProxy_debug.sh -s -d vflrd -p ddboost -l debug vrecoverd: /opt/emc/vproxy/bin/vProxy_debug.sh -s -d vrecoverd -p ddboost -l debug - Perform a backup or restore operation.
- See the following article for details on reviewing the precert logging: NetWorker: How to Analyze IO Performance Using ddboost_precert.log
NOTE:precert-io-perf.pycan be copied to and run directly from the vProxy. The script is run directly against the/DDLog/ddboost_precert.logfile. Alternatively, you can copy theddboost_precert.logfiles off of the vProxy and runprecert-io-perf.pyfrom another system.
Data Domain System Metrics:
- Log in to the Data Domain as
sysadmin.
net ping VCENTER_NAME/IP
NOTE: A single test execution does not provide enough data to conclusively determine whether packet loss or latency issues exist. Network performance can fluctuate based on the workload of the Data Domain system. While latency and packet loss may appear normal during periods of minimal activity, the same metrics may degrade when the system is processing significant backup, clone, or recovery traffic. To obtain accurate results, perform testing at multiple times, including periods of peak Data Domain utilization.
- Check for Data Domain performance overview:
system show performance
NOTE: This output shows recent Data Domain system performance statistics. These statistics may overlap with the backup/restore operation in question.
- Check DD Boost statistics and errors:
ddboost show stats
NOTE: This provides a general overview of DD boost settings and performance. It also provides an error count for functions observing higher error rates. Any questionable errors must be investigated by Data Domain supports.
- Use
net iperfto see what the transfer bandwidth is between Data Domain and vProxy:
net iperf client VPROXY_IP_ADDRESS port 9090 interval 2
Example:
sysadmin@ddve01# net iperf client 192.168.9.131 port 9090 interval 2
------------------------------------------------------------
Client connecting to 192.168.9.131, TCP port 9090
TCP window size:  256 KByte (default)
------------------------------------------------------------
[  3] local 192.168.9.106 port 45132 connected with 192.168.9.131 port 9090
write failed: Connection reset by peer
[ ID] Interval       Transfer     Bandwidth
[  3]  0.0- 0.0 sec   239 KBytes  1.48 Gbits/s
Depending on the bandwidth, expectations cannot be exactly determined, even if output shows 1.48 Gbit/sec, backup/restore may run in MB/s. Check the "local" IP and confirm if Management NIC or a 10GB data link is being used.
- Use
net iperfto see what transfer bandwidth is between Data Domain and vCenter:
net iperf client VCENTER_IP_ADDRESS port 443 interval 2
Example:
sysadmin@ddve01# net iperf client 192.168.9.111 port 443 interval 2
------------------------------------------------------------
Client connecting to 192.168.9.111, TCP port 443
TCP window size:  256 KByte (default)
------------------------------------------------------------
[  3] local 192.168.9.106 port 37072 connected with 192.168.9.111 port 443
write failed: Broken pipe
[ ID] Interval       Transfer     Bandwidth
[  3]  0.0- 0.0 sec   239 KBytes   147 Mbits/sec
Depending on the bandwidth, expectations cannot be exactly determined, even if output shows 2.27 Gbit/sec, backup/restore may run in MB/s. Check the "local" IP and confirm if Management NIC or a 10GB data link is being used. If data is routed out of the wrong interface, the DD admin must review the Data Domain configuration. A Data Domain support ticket can also be opened for NetWorker and Data Domain collaboration.
Additional Information
Related articles:
- NVP vProxy-Understanding VMware VM backup levels and sizes shown in NetWorker
- NetWorker VMware Protection-vProxy: How to Enable Debug Logging
- Data Domain: DDPCONNCHK How to troubleshoot Data Domain DD Boost connectivity and performance (Log in as registered Dell Support user is required to view this article.)
Affected Products
Data Domain, NetWorkerProducts
NetWorker FamilyArticle Properties
Article Number: 000200394
Article Type: How To
Last Modified: 20 آب 2026
Version: 23
Find answers to your questions from other Dell users
Support Services
Check if your device is covered by Support Services.