DPC: Dashboards: Understanding the Dashboard Widgets
Summary: How to Understand the DPC Dashboard Widgets
This article applies to
This article does not apply to
This article is not tied to any specific product.
Not all product versions are identified in this article.
Instructions
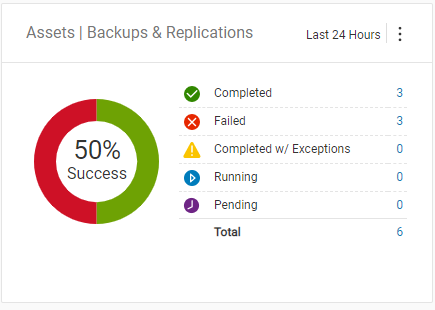
DPC Dashboards for Assets/Backup & Replication, Assets/Backup, or Assets/Replication widget.
This widget shows all backups run during the time period. These widgets count each backup (replication), not clients. If there are more than one backup per client or a backup is run more than once during the time period, each backup is counted in these totals.
This is the total for Completed, Failed, Completed w/ Exceptions, Running, Pending, and a Total of all backups (replications).
Note: For the replication numbers, DPC only shows source replications. This number can be different from the Avamar GUI, as it shows both source and destination replications in its dashboard count.
The DPC Dashboard for Assets|Summary widget.
This Widget has two sections.
At the top, it list the Total count of clients for the system, listed by VMs and then Other Assets. This is the total number of clients this DPC is monitoring.
At the bottom, it has the number Backup up for VMs and Other Assets and Replicated for VMs and Other Assets.
This count is only by client that was successful in the time period. If there are more than one backups per client or a backup is run more than once during the time period and it was successful, that client is counted only once for all of those backup (replications).
For that reason, this count will be smaller than the Assets Backup or Replication widgets, as this is rolled up by client that was successful.

The DPC Dashboard for Job/Backup & Replication, Job/Backup, or Job/Replication widget.
This widget shows all backups groups that are run. These Widgets count each backup group that is run. In an Avamar, this is the backup Policy that is counted and not the individual backups that are counted.
This is the total for completed, failed, Completed w/ Exceptions, Running, Pending, and a Total of all backup (replication) groups.

The DPC Dashboard for Assets/Backup & Replication Trend, Job/Backup Trend, or Job/Replication Trend widget.
This widget shows a line chart with the number of backup (replication) jobs that are completed over time. This shows you overall trends of your backup (replication) environment.
You have a green line for Completed backups (replications), a red line for Failed backups (replications), and a yellow line for completed with Exceptions backups (replications).

The DPC Dashboard for Assets/Top Offenders widget.
This Widget has two sections.
At the top, this widget shows a count of backups or replications that fail for 3 days or more in a row.
A the bottom, this widget lists client name, the date, and the number of days that client has not backed up or replicated.

The DPC Dashboard for Alerts | Summary widget.
This widget shows all alerts from DPC, Avamar, Networker, and Data Domain. This Widget has two sections.
At the top, it shows a count of alerts by Error, Warning, and Info type alerts.
At the bottom, it shows either a green circle with a check if there are no alerts, or it shows the alert message from each system by most resent alert.

The DPC Dashboard for Storage Capacity/Top Utilization widget.
This widget shows the capacity of the storage systems monitored by DPC. This Widget has two sections.
At the top, it show the number of systems that have Exceeded the warning threshold.
At the bottom, it shows the most utilized storage systems showing hostname and a bar graph of used capacity by %.

The DPC Dashboard for Storage Capacity | Summary widget.
This widget shows the the total capacity of all systems being monitored by DPC. This Widget has two sections.
On the left side, it shows a bar graph with used % of total capacity for all systems.
On the right side it shows in GB the Used, Available and Total capacity of all systems.

The DPC Dashboard for Health/Summary widget.
This widget shows the monitoring status of all systems in DPC. This Widget has two sections.
At the top, it shows a count of systems that are Not Reporting in DPC, Reporting unhealthy in DPC, or Reporting as healthy in DPC.
At the bottom it shows a green circle with a check if all the systems are reporting healthy, or it lists each system with a graph of health if it is not reporting or is unhealthy.
The meaning of these status:
- Not Reporting - DPC is not getting data on this system. (Open an SR with Support to get this issue resolved.)
- Unhealthy - There is an issue with the data the DPC is getting. This is seen if the system is showing an alert, or some data is missing.
- Healthy - DPC is getting data on this system and the system is not reporting any issues.

For all the widgets, there is a configuration menu (the three vertical dots in the top right hand corner of the widget) and, depending on the widget, this allows you to change the following items:

For all widgets:
- Filter - This sets the filter for the data in the widget by the systems discovered in DPC.
- Widget Type - This changes the widget to a different type of widget.
- View - This is used to choose either Asset or Job data in the widget.
- Activity Type - This is used to choose Backups, Replications, or Both in the widget.
- Time Range - This is used to choose the time range this widget is reporting on. The time range selections are Last Hour, Last 24 Hours, Last 7 Days, or All Available data.
Note: Time Range is also available for Asset Summary and Asset Top Offenders. It is not available for Asset Trend but can be selected to include today or not in Asset Trend.
Affected Products
Data Protection CentralProducts
Data Protection CentralArticle Properties
Article Number: 000011340
Article Type: How To
Last Modified: 03 Mar 2025
Version: 4
Find answers to your questions from other Dell users
Support Services
Check if your device is covered by Support Services.