Avamar: The difference between "Server Utilization" and physical space consumption on data nodes
Summary: This article discusses the difference between "Server Utilization" and physical space consumption on data nodes and why these do not correlate.
This article applies to
This article does not apply to
This article is not tied to any specific product.
Not all product versions are identified in this article.
Symptoms
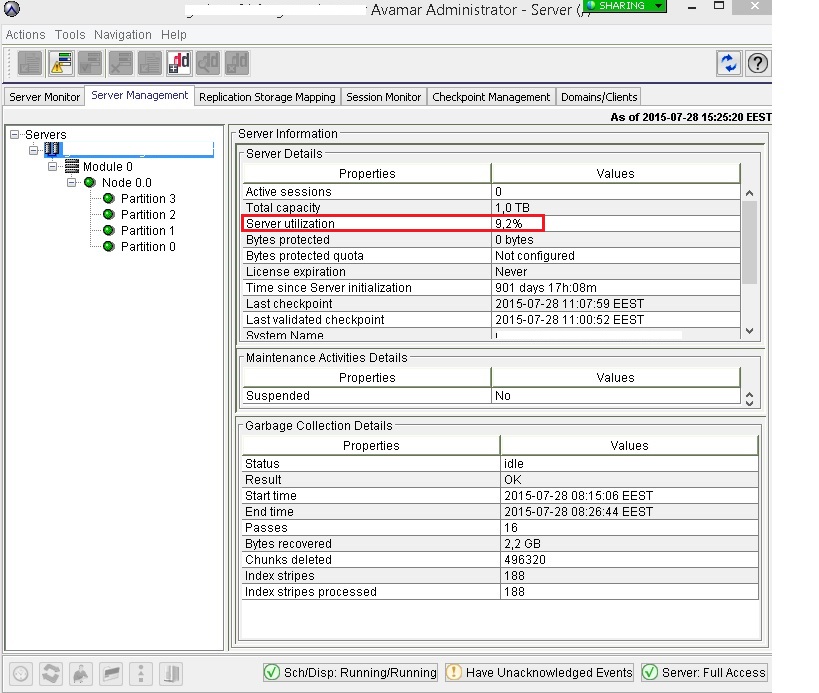
The amount of space consumed in the Avamar storage node physical data partitions is high, while the "Server utilization" figure is relatively low.
Example:
The Avamar server is reporting that it is consuming 9.2% of available space for backup data:
The Avamar data partitions show higher space consumption:

Cause
The reason for this is that the Avamar 'Server utilization' value is not calculated according to the amount of space consumed in the physical partitions.
The physical "/data" partitions hold stripes which are essentially containers for backup data.
The Avamar Server Utilization value (also known as User Capacity, or "GSAN" capacity) is measured according to how full those stripe containers are.
Once stripe containers have been created, they remain on the Avamar grid forever and are recycled as needed. Therefore, if an Avamar grid ever reaches high capacity, the existing stripe containers consume up to 65% of the total space of the data partitions.
This continues to be true even if a large amount of backup data is removed and the "server utilization" value drops.
Resolution
This is intended and normal behavior.
Additional Information
Further Information:
On a newly implemented Avamar grid, the /data partitions contain only a few stripes (data containers). Both the "Server Utilization" and the space consumed in the /data partitions report low values.
Over time, as stripes become populated with backup data, new stripes are created in the /data partitions. The space consumption of the /data partitions rise. This continues until the grid reaches predetermined 'safe' limits set by the Avamar server and the MCS.
By default, the amount of space in the data partitions consumed by stripe containers is 65%. Sometimes the value may vary, for example where the grid:
- Has custom limits applied due to licensing limitations (the limits are lower)
- Is configured with encryption at rest (the limits are lower)
- Has been configured with customized metadata capacity limits (the limits are slightly higher)
The reason for the aforementioned 'safe' limits is to ensure that the /data partitions have sufficient free space for maintenance activities to occur.
Below is a graphic illustrating this:
100%   "---------------------" <-- 100% /data partition capacity
       " Reserved for        "
       " maintenance         "
       " activity overhead   "
       "                     "
       "                     "
65%    "---------------------" <-- 100% Server Utilization value
       " Commonality         "     (visible in the Admin GUI)
       " factored data       "
       " & RAIN parity       "
       " data                "
       "                     "
       "                     "
       "                     "
       "                     "
0%     "---------------------"
The OS and Avamar server capacity behaviors are discussed in more detail in the following article: Avamar: Capacity Management Concepts and Training
Avamar integrated with Data Domain:
On Avamar grids integrated with Data Domain, backups sent to Data Domain write only a small amount of data to Avamar. This is known as metadata. The metadata resides in composite stripes and consumes relatively little space when compared with client backups stored on Avamar.
In certain scenarios, where metadata parameters have been 'tuned' by technical support, the percentage of the space consumed by 'cur' on an Avamar grid may be higher than 65%.
Other items to note:
RAIN/Parity data:
The following article describes why the server utilization will always include the space consumption of parity stripes even after all backups have been removed: Avamar shows up to ~30% usage even after all backups have been deleted and garbage collected
Affected Products
Avamar, Avamar Data Store Gen3, Avamar Server, Data DomainArticle Properties
Article Number: 000038880
Article Type: Solution
Last Modified: 06 Feb 2025
Version: 8
Find answers to your questions from other Dell users
Support Services
Check if your device is covered by Support Services.