Avamar: Understanding the "Data protected" value in the Avamar Administrator
Summary: This article discusses the "Data protected" (v7.0) values in the Avamar Administrator.
This article applies to
This article does not apply to
This article is not tied to any specific product.
Not all product versions are identified in this article.
Instructions
The purpose of this article is to describe the function of the Data protected value which is displayed in the Avamar Administrator UI, and explain what the value means to avoid misinterpretation when understanding Avamar grid capacity usage.
For information relating to general Avamar Capacity Management principles, see Avamar: Capacity Management Concepts and Training
Where is the value displayed?
-
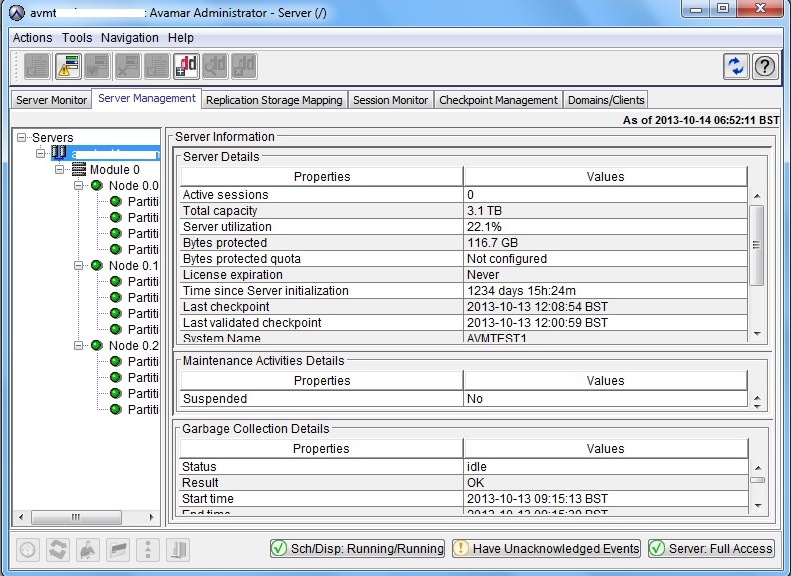
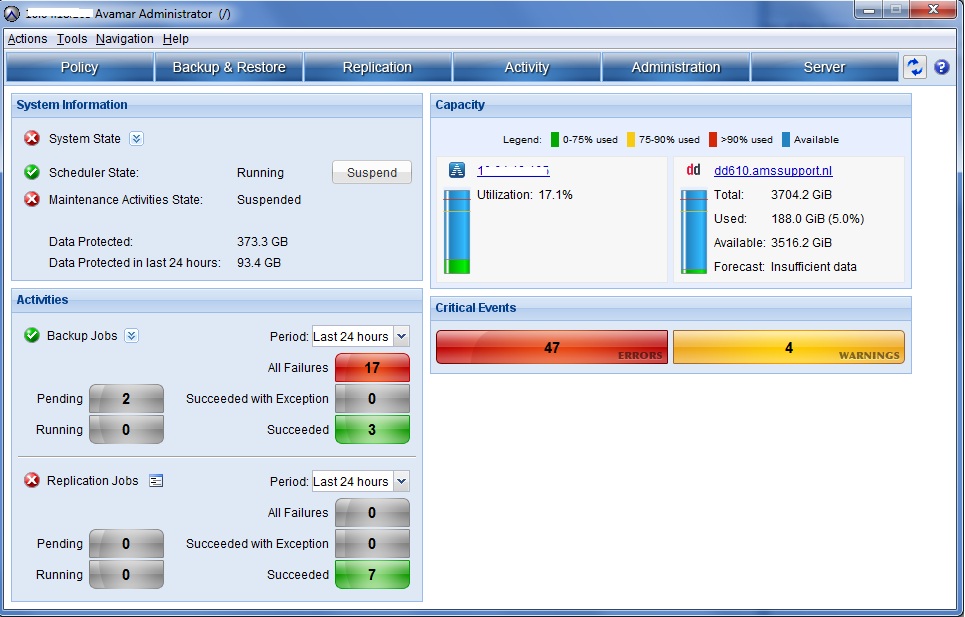
Data Protected - This is shown on the main Avamar Administrator launch screen in the System Information section from Avamar v7.0.
How is the value calculated?
-
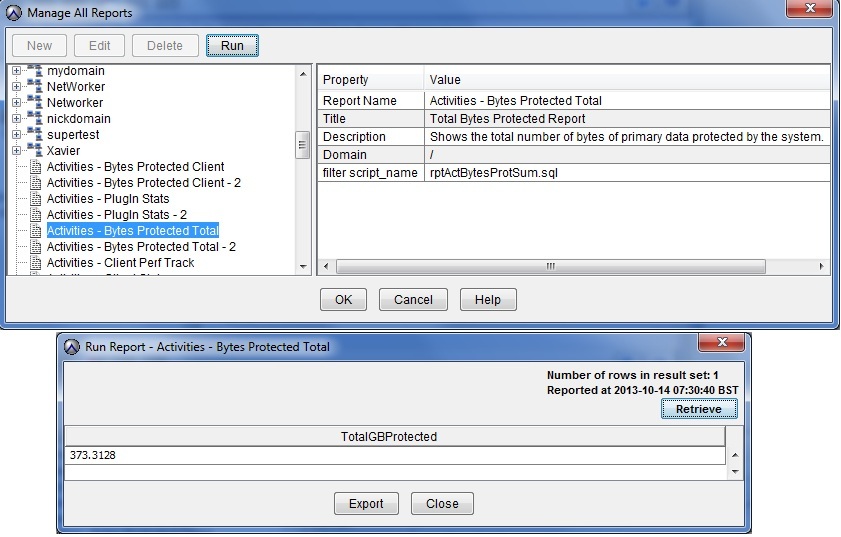
The value is generated by the "Activities - Bytes Protected Total" report which can be accessed from the Reports section of the Avamar Administrator.
-
The SQL query that this report runs can be found on the Avamar Utility Node (/usr/local/avamar/lib/sql/rptActBytesProtSum.sql)
-
The notes section of this article contains the SQL query that runs by the rptActBytesProtSum.sql report in v7.0.0-427.
What do the values mean?
-
The Data protected value attempts to identify the largest single backup on each client which has a backup on the Avamar grid. The report is the sum of this value for all clients.
-
A practical use for the value would be to learn the amount of disk space that would be required to restore the largest backup for every client.
-
The values reflect source data on the client and not deduplicated data on the backend of the Avamar grid.
Why does the "Data Protected" value not correspond with the server utilization or capacity used values?
(This is a common question.)
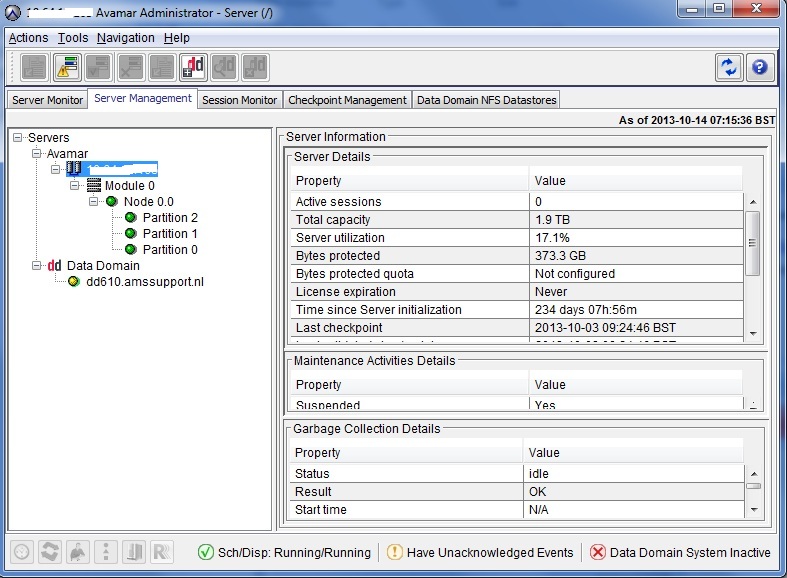
Running the command 'mccli server show-prop', or viewing the server management screen, output similar to the following is seen:
Total capacity                   1.9 TB
Capacity used                    322.2 GB
Server utilization               17.1%
Bytes protected                  373.3 GB
-
-
- The 'Total capacity' is the total amount of space available for user backups on the Avamar backend storage.
- The 'Capacity used' is the amount of total capacity which is consumed on the backend.
- The 'Server utilization' is calculated from the total capacity and capacity used values.
-
The Data protected value does not need to, and usually does not, correspond with the above values, because they are calculating different things.
Since it calculates source data on the client, it does not consider retention or RAIN redundancy overhead.
My source data has barely changed but my Data protected figure has suddenly increased or decreased - why?
A dataset is a definition of the source data which is to be backed up. If the dataset is renamed, even though the defined data is identical, any backed-up data is counted separately for each dataset. The bytes protected may increase or decrease according to such changes made to the dataset.
Why are there multiple versions of the Data protected report?
-
There are multiple variations on the bytes protected report and each produces different results.
-
The Total Bytes Protected is computed using only the results of the past X days. This accounts for situations as described above where datasets are renamed. This ensures that only the most recently backed up datasets are part of the figure.
-
The reports are subject to change in different versions therefore the SQL reports should be reviewed in /usr/local/avamar/lib/sql/rptActBytesProt* to understand what is being calculated before assessing its usefulness.
A Screenshot from the Avamar Administrator v6 UI:
A Screenshot of the Avamar Administrator v7 launch page:
(The Data Protected value is displayed prominently in the System information section.)
A screenshot of the server management screen, from the same grid:
(The values are the same as they are generated by the same report.)
The Bytes Protected Total report can be run from the 'Reports' screen. The following is run on the v7 grid shown earlier. The value is identical.
The value can also be viewed from the Avamar Utility Node command line:
mccli server show-prop
0,23000,CLI command completed successfully.
Attribute                        Value
-------------------------------- ----------------------------
State                            Full Access
Active sessions                  0
Total capacity                   1.9 TB
Capacity used                    322.2 GB
Server utilization               17.1%
Bytes protected                  373.3 GB
Bytes protected quota            Not configured
License expiration               Never
Time since Server initialization 234 days 08h:40m
Last checkpoint                  2013-10-03 09:24:46 IST
Last validated checkpoint        2013-10-03 09:24:46 IST
System Name                      avamar1
System ID                        xxxxxxxxx@XX:XX:XX:XX:XX:XX
HFSAddr                          XX.XX.XX.XX
HFSPort                          27000
IP address                       XX.XX.XX.XX
Number of nodes                  1
Nodes Online                     1
Nodes Offline                    0
Nodes Read-only                  0
Nodes Timed-out                  0
Additional Information
The SQL query that is run by the report can be found in /usr/local/avamar/lib/sql/rptActBytesProtSum.sql:
select (sum(total_gb_protected)) as "TotalGBProtected"
from (
select client_name,
       plugin_name,
       CASE WHEN sch_sum_bytes is NULL
                 THEN '/Client On-Demand Data'
            WHEN adhoc_max_bytes is NULL
                 THEN 'All Custom Datasets'
            WHEN sch_sum_bytes >= adhoc_max_bytes
                 THEN 'All Custom Datasets'
            WHEN sch_sum_bytes < adhoc_max_bytes
                 THEN '/Client On-Demand Data'
            ELSE 'REPORT ERROR'
       END as dataset,
       cast((
       CASE WHEN sch_sum_bytes is NULL
                 THEN adhoc_max_bytes
            WHEN adhoc_max_bytes is NULL
                 THEN sch_sum_bytes
            WHEN sch_sum_bytes >= adhoc_max_bytes
                 THEN sch_sum_bytes
            WHEN sch_sum_bytes < adhoc_max_bytes
                 THEN adhoc_max_bytes
            ELSE 99999999
       END) / 1024/1024/1024 as numeric(30,4)) as total_gb_protected
 from (select client_name,
              plugin_name,
              sum( sch_max_bytes ) as sch_sum_bytes
       from ( select client_name,
                     plugin_name,
                     dataset,
                     max(bytes_scanned) as sch_max_bytes
              from v_activities_2
              where (v_activities_2.status_code in (30000, 30005)) and
                    (v_activities_2.type like '%Backup%') and
                    (v_activities_2.dataset not like '/Client On-Demand Data') and
                    (expiration_ts = '0' or expiration_ts::double precision >= extract( epoch from now() ))
              group by client_name, plugin_name, dataset ) as sel1
       group by client_name, plugin_name ) as sel2
 FULL JOIN
       ( select client_name, plugin_name, max(bytes_scanned) as adhoc_max_bytes
              from v_activities_2
              where (v_activities_2.status_code in (30000, 30005)) and
                    (v_activities_2.type like '%Backup%') and
                    (v_activities_2.dataset like '/Client On-Demand Data') and
                    (expiration_ts = '0' or expiration_ts::double precision >= extract( epoch from now() ))
              group by client_name, plugin_name ) as sel3
USING (client_name, plugin_name)) as sel4
Affected Products
AvamarProducts
AvamarArticle Properties
Article Number: 000041185
Article Type: How To
Last Modified: 24 Oct 2025
Version: 10
Find answers to your questions from other Dell users
Support Services
Check if your device is covered by Support Services.