Standard features across MyService360
Summary: MyService360 simplifies complex support and services datasets into actionable intelligence. It uses standardized features to provide an intuitive and streamlined user experience. Depending on your business objective, you can customize the information that is associated with HEALTH & RISK, INSTALL BASE, and INCIDENT ...
This article applies to
This article does not apply to
This article is not tied to any specific product.
Not all product versions are identified in this article.
Instructions
MANAGEMENT.
Heads-up display
The heads-up display elevates the relevant service metrics for HEALTH & RISK, INSTALL BASE and INCIDENT MANAGEMENT and effectively summarizes the key performance indicators (KPIs) that should be monitored for each data category. It uses interactive dials whose default view highlights the right priorities for action. You can hover over sections of a dial to view the breakdown of associated information. Click the center of the dial to auto-populate data in the default table view below the heads-up display.

Figure 1 Heads-up display for HEALTH & RISK

Figure 2 Heads-up display for INSTALL BASE

Figure 3 Heads-up display for INCIDENT MANAGEMENT
The following table describes the information that is displayed in the heads-up display:
| Tab | Description |
|---|---|
|
HEALTH & RISK |
|
|
INSTALL BASE |
|
|
INCIDENT MANAGEMENT |
|
Table 1 Heads-up display information
Standard menu
MyService360 enables you to customize the information displayed within a tab. You can choose the format in which you want to view the information. You can also add or remove data filters and download the information that is displayed. By default, information for the commonly used attributes is displayed. The options to customize the view, modify filters, and download the information are displayed above the table.
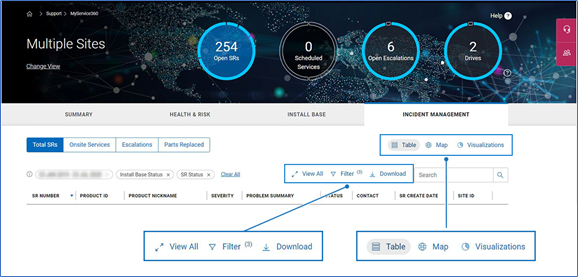
Figure 4 Standard menu
Views
MyService360 enables you to view the information available for HEALTH & RISK, INSTALL BASE, and INCIDENT MANAGEMENT in the following formats. Within a tab, you can easily toggle between the three formats for different views of the same information.
- Table―This is the default view when you first select a tab and displays information for the commonly used attributes in a tabular format.
 Note: You must select View All to get all the available attributes for a selected data set.
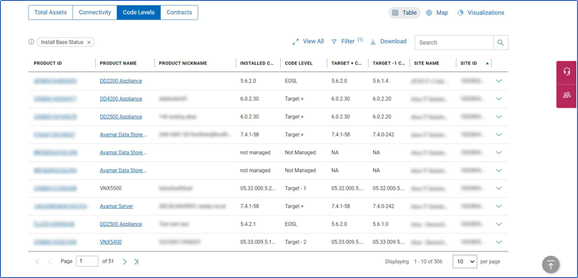
Figure 5 Table view
Click  within a table to expand a row and access a summary view of key information and attributes tailored by HEALTH & RISK, INSTALL BASE, or INCIDENT MANAGEMENT.
 Note: This one-click access feature is not currently available from the table generated when you click View All.
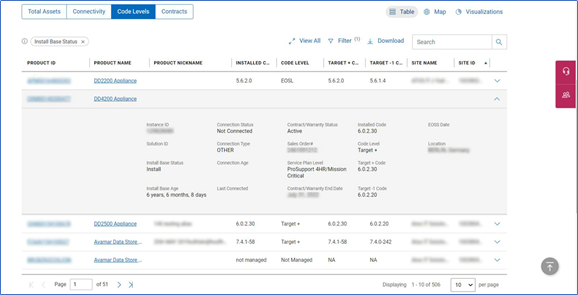
Figure 6 Expand row in Table view
Click View All to view information for all the attributes in a tabular format.
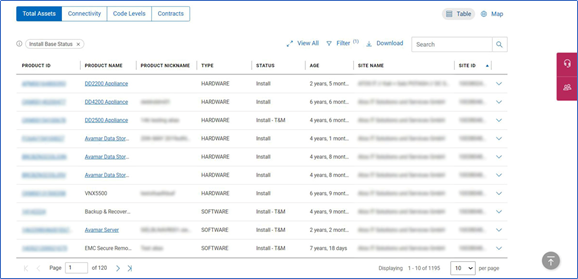
Figure 7 View All in Table view
- Map―Displays a map indicating the sites where the products are installed and the associated service information. The blue circle on the map varies in size to reflect the number of associated events for each site. Click on any circle to view more detail.
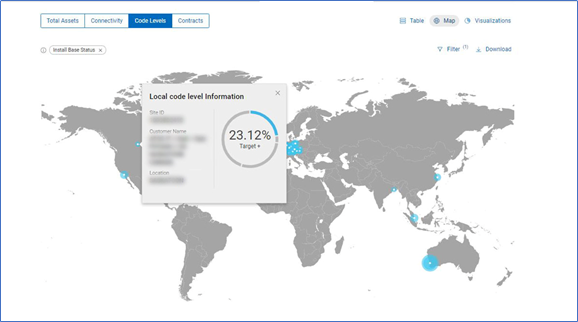
Figure 8 Map view
- Visualizations―Displays the information in a graphical format. Many of the visual analytics are interactive and you can isolate and view details by clicking on the image.
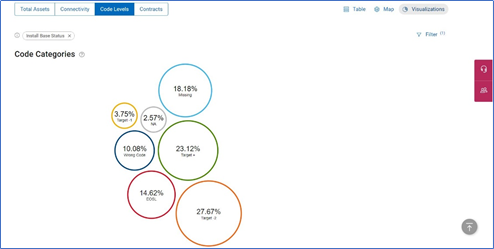
Figure 9 Visualizations view
Filters
Predefined filters are applied for HEALTH & RISK, INSTALL BASE, and INCIDENT MANAGEMENT. Depending on your objective, you can add or remove the applied filters to customize the information displayed. In the Table view, click View All to view additional options based on all available options. See the example below for INSTALL BASE.
.
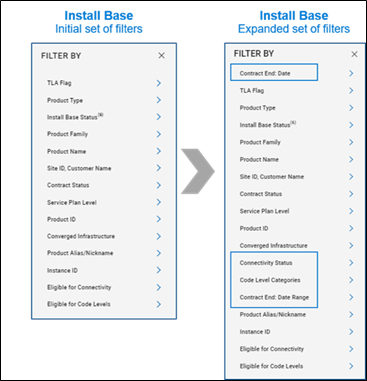
Figure 10 Filter interactions
The following table displays the default filters applied for HEALTH & RISK:
| Tab | Default Filters |
|---|---|
|
Field Change Orders |
|
|
Trackable Service Events |
|
|
Dell Security Advisories |
|
|
Dell Technical Advisories |
 Note: By default, the date range is set to the last 18 months.
 Note: By default, the date range is set to the last two years. You can also view information for a custom date range within the last three years.
Table 2 Default filters for HEALTH & RISK
The following table displays the default filters applied for INSTALL BASE:
| Tab | Default Filters |
|---|---|
|
Assets |
|
|
Connectivity |
|
|
Code Levels |
|
|
Contracts |
|
Table 3 Default filters for INSTALL BASE
The following table displays the default filters applied for INCIDENT MANAGEMENT:
| Tab | Default Filters |
|---|---|
|
Total SRs |
|
|
On-Site Services |
|
|
Escalations |
|
|
Parts Replaced |
|
Table 4 Default filters for INCIDENT MANAGEMENT
Download
You can download the information that is displayed in the Table and Map views to a CSV and PDF file respectively. In the Table view, click Download to save the default attributes information. Click View All and then click Download to save information for all the associated attributes.
Article Properties
Article Number: 000104416
Article Type: How To
Last Modified: 18 Apr 2026
Version: 8
Find answers to your questions from other Dell users
Support Services
Check if your device is covered by Support Services.