Live Optics | Optical Prime | Right-Sizing Virtual Machines
Summary: This article offers some observations on Right Sizing Virtual Machines.
This article applies to
This article does not apply to
This article is not tied to any specific product.
Not all product versions are identified in this article.
Instructions
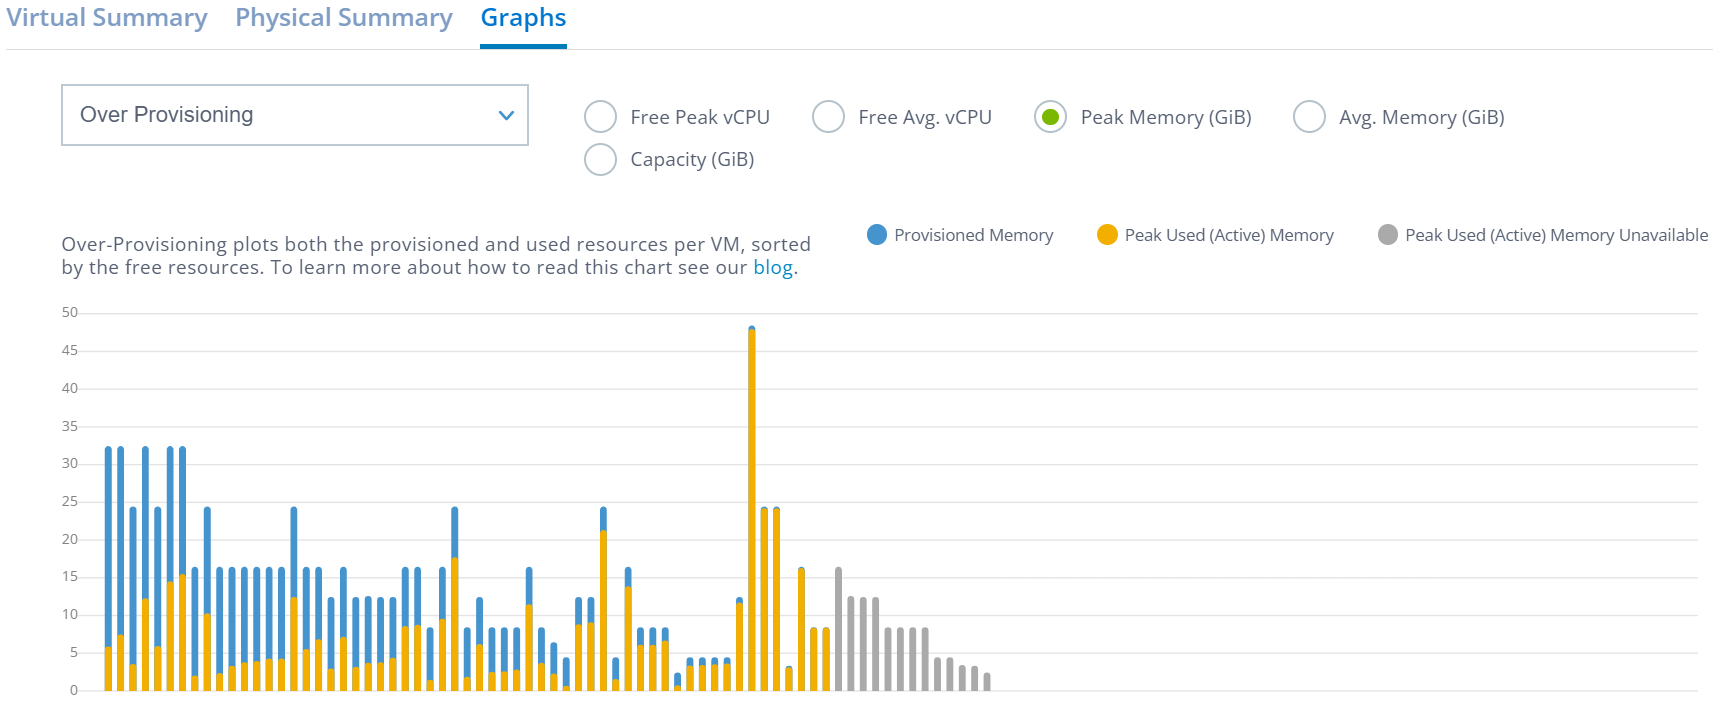
Note: The following features are dependent on data availability. Certain VM environments will not allow visibility to provisioned vs. consumed resources, or it might not be obtainable at the time. When this occurs, the VM and sometimes the entire graph (all VMs) will be represented by gray-colored bars. This would almost always occur in a Hyper-V project where a VM Tools equivalent is not present.
It is a common technique and advantage of virtualization to over-provision Virtual Machines. The practice is essentially two strategies: (1) allocating more to a VM than it might need at the time and (2) optionally, allocating more resources to all your VMs than one might have as infrastructure.
Alternatively, a VM may have been given a wasteful number of resources and they are unlikely to ever be consumed. In a private cloud environment, this might not be something that requires monitoring. However, if moving any of these VMs to a platform that charges based on allocated resources, then a vastly over-provisioned machine can cost a LOT of money.
Even in some Private Cloud environments when a resource is allocated, it is removed from the available pool. When the resources are gone, obtain more to expand. Alternatively, reclaim any unused resources to avoid the expenditure.
Public Cloud Providers happen to fall into this category. The strategy of the Public Cloud is to only pay for what is used to and if more or less is needed, then adjust resources as needed.
Typically, in the Public Cloud, an administrator assigns a VM an "Instance." An Instance is a fixed bundle of vCPU, Memory, and Capacity and is a billing increment.
For those that are new to the Public Cloud, an administrator might attempt to replicate a VM's provisioned characteristics and find themselves paying excessive amounts for resources the VM never uses.
Example of Memory Oversubscription
In the following example the VMs with the lowest usage of assigned resources are aligned left to right with the furthest left being the VM that has the most amount of unused assigned memory. In theory, these are the VMs that have the highest amount of resources that can be reclaimed and are the ideal candidates for Right Sizing.
Before shifting any resources to a billing model that requires payment for resources assignment vs. resources consumption, first "Right Size" the VMs.
The Live Optics Over-Provisioning Graph helps visualize which VMs in your environment are potential candidates for smaller configuration footprints.
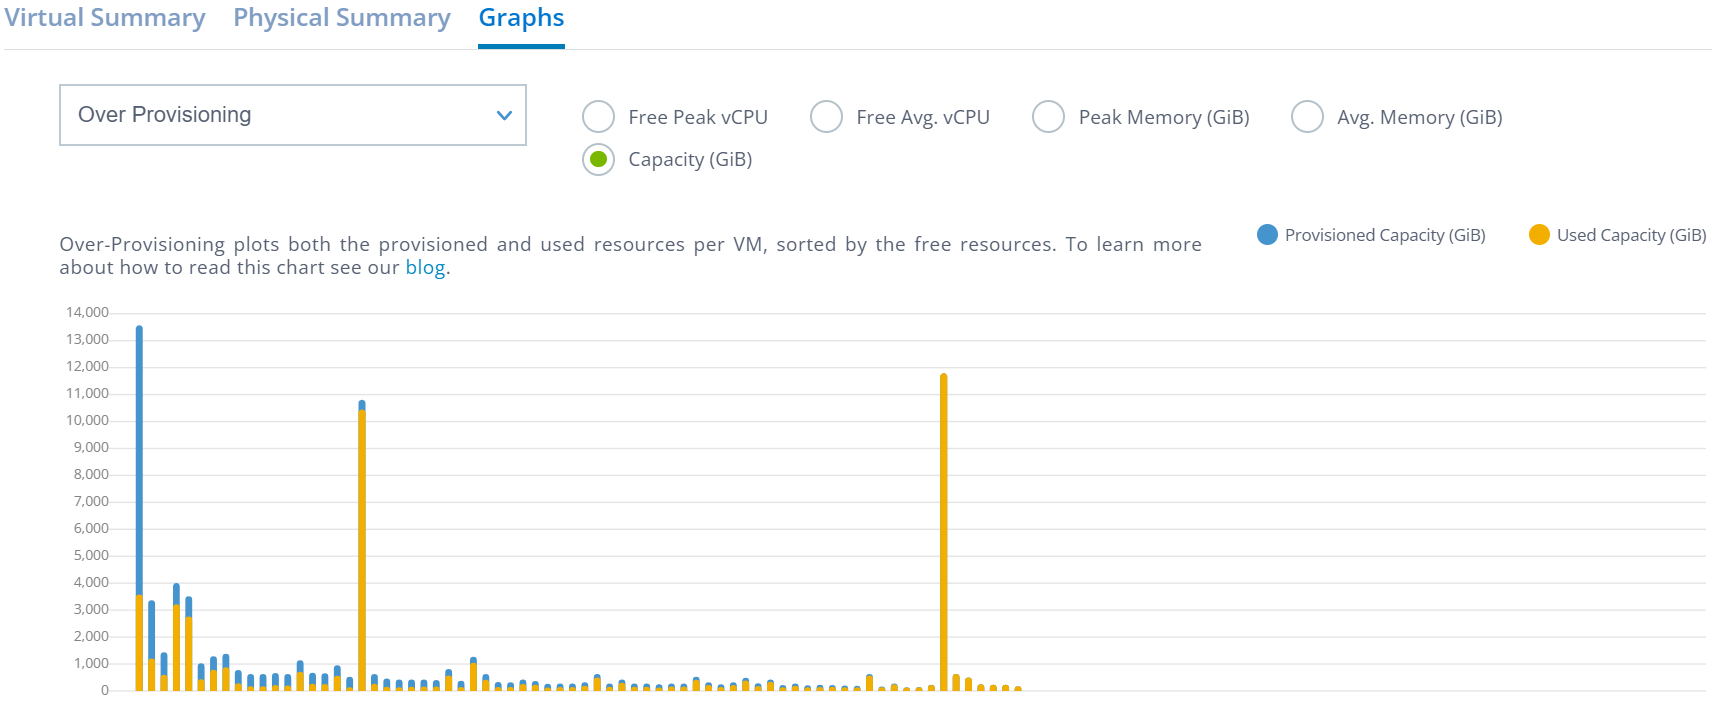
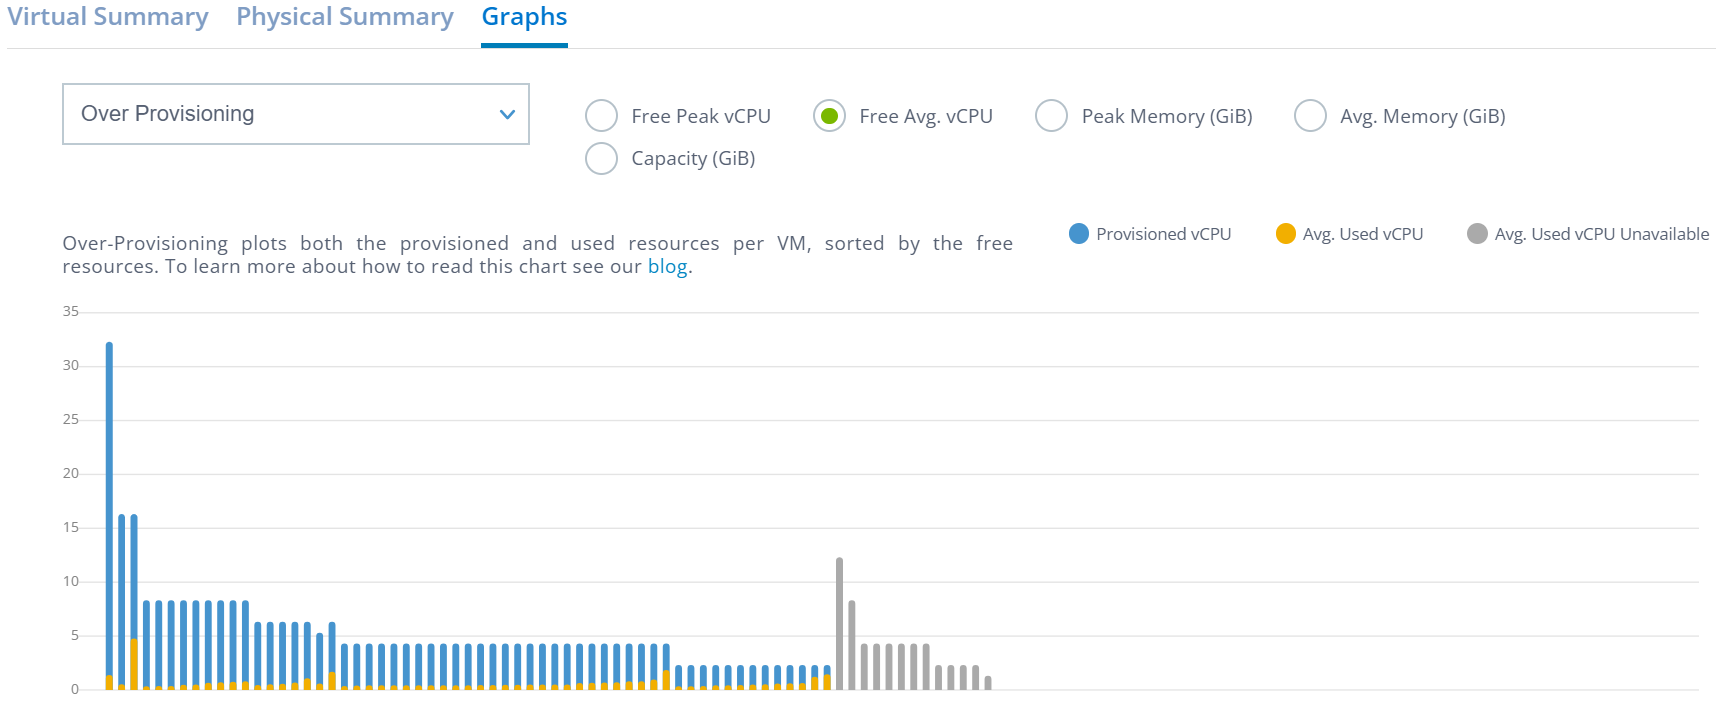
This graph demonstrates the provisioned and used attributes of vCPU, Memory, and Capacity as individual charts. The VMs with the highest amounts of unused space for the selected category will be sorted highest to lowest starting on the left side of the chart.
Look to the right (or scroll to the right in large collections) and eventually see that the VMs are mostly using close to 100% of their assigned resources.
Understanding how to read the charts.
Except for vCPU, the blue bar is the provisioned quantity of the attribute and the yellow bar is the used quantity. In general terms, the VMs showing the most blue (provisioned) compared to their yellow (used) counterparts as a percentage are the most over-provisioned.
Capacity and Memory assignment are relatively straight forward and if one decides that these resources can indeed be reclaimed, the process is straight forward and can lead to avoidance of unnecessary upgrades.
Example of Capacity Oversubscription
The following example shows all the unused capacity in blue with the VMs having the most unused capacity on the left. Notice that the bars themselves are not sorted highest to lowest by provisioned capacity; rather, the bars are aligned from highest to lowest of free or unused capacity.
These are the VMs that are the highest candidates for right capacity sizing.
Example of vCPU Oversubscription
The vCPU version is similar but is more tricky to understand. The blue bar does represent the total amount of provisioned resources. However, the yellow is the used equivalent. Let me explain.
All physical CPUs and vCPUs have a GHz consumption quantity. This % is tracked as some all the VMs' total processing power and not for each vCPU itself.
Often, a vCPU is more or less equal to a physical core. Often multiple vCPUs can be assigned to a VM, and this is done for architectural reasons demanded by the workload’s design and not necessarily strictly for performance.
Therefore, while Live Optics can show the overall % used for vCPUs, it cannot determine any architectural advantage to assigning more vCPUs to VM.
While Live Optics can accurately show the equivalent vCPU usage based on total GHz consumption, this graph is not suggesting that any vCPUs can be reclaimed, but rather that they might be a candidate for further inspection.
In the graphic below see that the first VM has 8 vCPUs assigned, but it is only using the equivalent GHz of 0.25% of a single vCPU's performance.
It is likely that this VM can successfully run with fewer vCPUs, but it is not definitive until there is an architectural review.
The gray bars at the right are a good example of where usage consumption for these VMs was not obtainable.
Affected Products
PowerEdge T140, PowerEdge T150, PowerEdge T160, PowerEdge T340, PowerEdge T350, PowerEdge T360, PowerEdge T40, PowerEdge T440, PowerEdge T550, PowerEdge T560, PowerEdge T640Article Properties
Article Number: 000233567
Article Type: How To
Last Modified: 26 Mar 2025
Version: 3
Find answers to your questions from other Dell users
Support Services
Check if your device is covered by Support Services.