VMware: Monitoring vCenter Server Appliance Resources Use
Summary: This article shows how to use vCenter Server Appliance Management Interface (VAMI) to monitor the vCenter Server Appliance resources usage.
This article applies to
This article does not apply to
This article is not tied to any specific product.
Not all product versions are identified in this article.
Instructions
Goal:
Maintain acceptable levels of performance and resource use for the vCenter Server Appliance.
Facts:
vCenter Server Appliance
Services
Performance
vCenter Server Appliance Management Interface (VAMI)
Process:
CPU Performance
vCSA should not exceed constant CPU usage of 70 percent.
If the VPXD process is consuming most of the CPU and it exceeds 70 percent, then consider the following suggestions:
- Add more CPUs to the vCSA.
- Add more vCSA instances to balance the load across the vCSA instances.
If a Java service is consuming most of the CPU, you should increase the heap memory size for the service.
Memory Performance
vCSA should not exceed constant Memory usage of 70 percent.
If Memory usage is consistently exceeding 70 percent, then do the following:
- Verify if vCSA is swapping. See information in VMware article: Solutions for Memory Performance Problems
- Verify which services have high CPU usage.
- High CPU usage may indicate excessive swapping because CPU is required to handle the swapping operation.
- If high usage is consistent, added memory may be required.
- If memory is overcommitted in the cluster, consider setting reservations for vCSA.
Monitoring CPU and Memory use with VAMI
- Get access to the VAMI of the vCSA.
https://vCSA_IP
Or
FQDN:5480
- Go to Monitor at the left and select CPU and Memory.
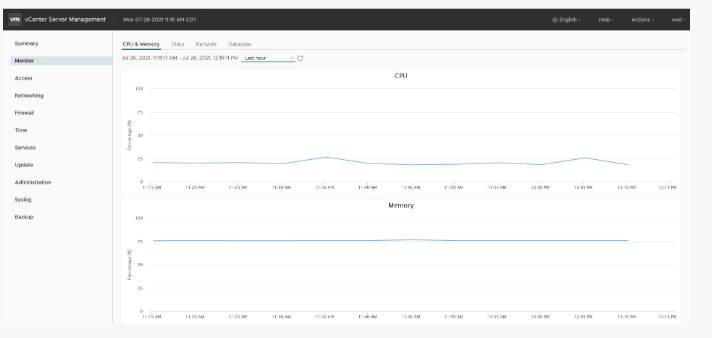
Figure 1: Monitor CPU and Memory.
- Alternately, the
<vimtop>command can be used to monitor the vCSA resources.- Log in to the vCSA shell using a PuTTY session.
- Issue the command and review the metrics for CPU and Memory.
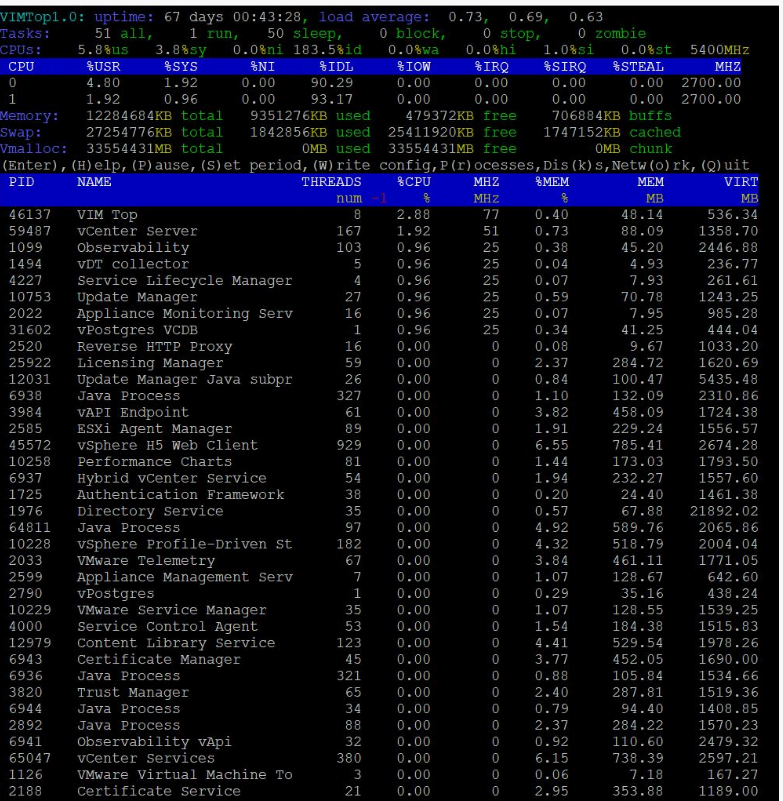
Figure 2:
Vimtop Command Output
Viewing Service Memory Allocation
The <cloudvm-ram-size> command shows the amount of memory that is allocated to the vCenter Server services. In the below example, see that the vSphere UI service is using 853 MB of 12,000 MB allocated to the vCSA.
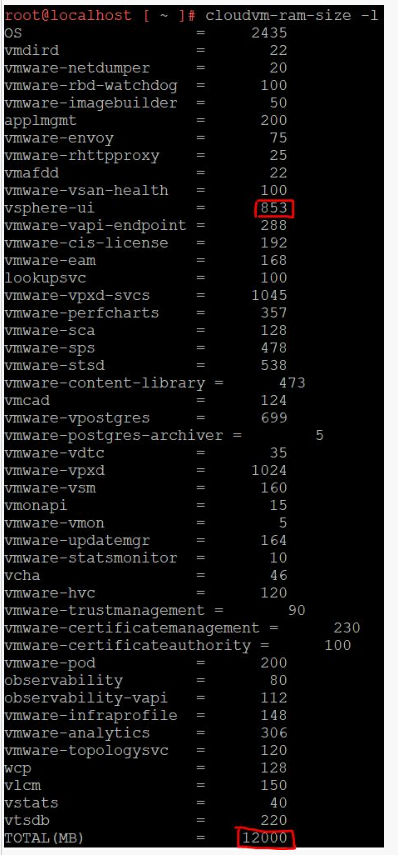
Figure 3:
Cloudvm-ram-size Command Output
Viewing the Service Heap Size
vCenter Server consists of several Java services. A Java service uses a heap (pre-reserved are of memory) to store data objects. A proper heap size is important to perform optimally. The vSphere UI may require more heap size in the following circumstances:
- Multiple vCenter Server instances in enhanced linked mode
- Many extensions and plug-ins
- Large inventories
The <cloudvm-ram-size -J service_name> command shows the total memory that is used for the heap. In the below example, see that the heap for vSphere UI service is using 597 MB of 853 MB allocated.

Figure 4:
Cloudvm-ram-size -J service_name Command Output
If the service heap size must be changed due to performance issues, see VMware article: Manually increasing the heap memory on vCenter Server components
Affected Products
VxBlock and Vblock Systems, PowerFlex rack, ScaleIO, PowerEdge XR2, Poweredge C4140, PowerEdge C6400, PowerEdge C6420, PowerEdge C6520, PowerEdge C6525, PowerEdge C6600, PowerEdge C6615, PowerEdge C6620, PowerEdge FC640, PowerEdge M640
, PowerEdge M640 (for PE VRTX), PowerEdge MX5016s, PowerEdge MX7000, PowerEdge MX740C, PowerEdge MX750c, PowerEdge MX760c, PowerEdge MX840C, PowerEdge R240, PowerEdge R250, PowerEdge R260, PowerEdge R340, PowerEdge R350, PowerEdge R360, PowerEdge R440, PowerEdge R450, PowerEdge R540, PowerEdge R550, PowerEdge R640, PowerEdge R6415, PowerEdge R650, PowerEdge R650xs, PowerEdge R6515, PowerEdge R6525, PowerEdge R660, PowerEdge R660xs, PowerEdge R6615, PowerEdge R6625, PowerEdge R740, PowerEdge R740XD, PowerEdge R740XD2, PowerEdge R7415, PowerEdge R7425, PowerEdge R750, PowerEdge R750XA, PowerEdge R750xs, PowerEdge R7515, PowerEdge R7525, PowerEdge R760, PowerEdge R760XA, PowerEdge R760xd2, PowerEdge R760xs, PowerEdge R7615, PowerEdge R7625, PowerEdge R840, PowerEdge R860, PowerEdge R940, PowerEdge R940xa, PowerEdge R960, PowerEdge T140, PowerEdge T150, PowerEdge T160, PowerEdge T340, PowerEdge T350, PowerEdge T360, PowerEdge T40, PowerEdge T440, PowerEdge T550, PowerEdge T560, PowerEdge T640, VMware ESXi 7.x, VMware ESXi 8.x, VxBlock and vBlock Systems Series
...
Article Properties
Article Number: 000207224
Article Type: How To
Last Modified: 09 May 2025
Version: 4
Find answers to your questions from other Dell users
Support Services
Check if your device is covered by Support Services.