VMware: Debugging ESXi MCE PSOD
Summary: How to debug the ESXi Machine Check Exception (MCE) purple diagnostic screen (PSOD) with an example.
This article applies to
This article does not apply to
This article is not tied to any specific product.
Not all product versions are identified in this article.
Instructions
ESXi servers may stop with a purple diagnostic screen (PSOD) due to Machine Check Exception (MCE) errors. MCE errors are due to hardware issues.
The MCE purple diagnostic screen displays multiple items. Out of these, the MCi_STATUS register is useful in debugging the issue.
Register Details:
- The
MCi_STATUSregister consists of information about the machine check error. - The register is displayed next to the "
S:" As shown in the example below:
MC: PCPU18 B:13 S:0xfe20004000011166 M:0x7246040086 A:0x38c989b100 5
Bits and their significance:
| 63 | 62 | 61 | 60 | 59 | 58 | 57 | 53-56 | 38-52 | 32-37 | 16-31 | 0-15 |
| VALID flag - If set, then information is valid. | OVERFLOW flag - If set, then may indicate multiple MCEs occurred close to each other. | UNC flag- If set, then CPU could not correct the error. | EN flag | MISCV flag - If set, then MISC register contains more information. | ADDRV - If set, then the ADDR register contains where the error occurred. | PCC flag- If set, then it means that the processor may have been corrupted. | Architectural if bit 11 is set, else "other information." | Architectural if bit 10 is set, else "other information." | Other information | Model-specific error code for CPU | Machine check error code |
To debug the error, the low 16 bits of the MCi_STATUS register are important. These bits indicate a simple or compound error.
Option 1: Using Automatic Tool
Note: You can now debug the error with the following tool that automates the steps below:
VMware Purple Diagnostic Screen (PSOD) Error Reader
VMware Purple Diagnostic Screen (PSOD) Error Reader
Option 2: Using Manual Steps
- Simple errors are quick to debug
0000 0000 0000 0000 -- No Error reported to this bank of error-reporting registers.
0000 0000 0000 0001 -- Unclassified - Error has not been classified.
0000 0000 0000 0010 -- Parity error in internal microcode ROM.
0000 0000 0000 0011 -- External error-BINIT# from another processor caused this processor MCE. Happens only if BINIT# observation enabled during power on.
0000 0000 0000 0100 -- Functional redundancy check master/slave error.
0000 0000 0000 0101 -- Internal parity error.
0000 0000 0000 0110 -- SMM handler tried to execute outside the ranges specified by SMRR.
0000 0100 0000 0000 -- Internal timer error.
0000 1110 0000 1011 -- I/O error.
0000 01xx xxxx xxxx -- Internal unclassified error. Atleast one X must be equal to 1.
- Compound errors
000F 0000 0000 11LL - Generic Cache Hierarchy error.
000F 0000 0001 TTLL - {TT}TLB{LL}_ERR. TLB errors.
000F 0000 1MMM CCCC - {MMM}_Channel{CCCC}_ERR - Memory controller errors.
000F 0001 RRRR TTLL - {TT}CACHE{LL}_{RRRR}_ERR - Cache Hierarchy errors.
000F 1PPT RRRR IILL - BUS{LL}_{PP}_{RRRR}_{II}_T_ERR - Bus and Interconnect errors.
- F - Form flag
0 – Normal Filtering
1 – Corrected Filtering
Filtering means that some or all the subsequent corrections to this entry in this structure are not posted.
- TT - Applies to 2 and 4 above.
Indicates type of transaction:
00 - Instruction
01 - Data
10 - Generic
- LL - Applies to 1, 2, 4 and 5 above.
This indicates the level in the memory hierarchy where the error occurred.
00 - Level 0 - L0
01 - Level 1 - L1
10 - Level 2 - L2
11 - Generic – LG (It is shown only when processor cannot determine the hierarchy level)
- RRRR - Indicates the type of action associated with the error. The actions are:
0000 - Generic Error - ERR
0001 - Generic Read - RD
0010 - Generic Write - WR
0011 - Data Read - DRD
0100 - Data Write - DWR
0101 - Instruction Fetch - IRD
0110 - Prefetch - PREFETCH
0111 - Eviction - EVICT
1000 - Snoop - SNOOP
- PP (Participation) - Describes the role of the local processor in the error.
00 - SRC - Local processor originated request
01 - RES - Local processor responded to request
10 - OBS - Local processor observed error as third party
11 - Generic
- T (Time-out) - 1 = Request timed out.
- II (Memory or I/O)
00 - M - Memory Access
10 - IO - I/O
01 - Reserved
11 - Other transaction
- Memory Controller errors - Defined by MMM and CCCC subfields above
- MMM - Memory error
000 - GEN - Generic undefined request
001 - RD - Memory read error
010 - WR - Memory write error
011 - AC - Address/Command error
100 - MS - Memory Scrubbing error
101-111 - Reserved
- CCCC - Channel with the error
0000-1110 - CHN - Channel number
1111 - Channel not specified
Here is an example of how to analyze an MCE purple diagnostic screenshot:
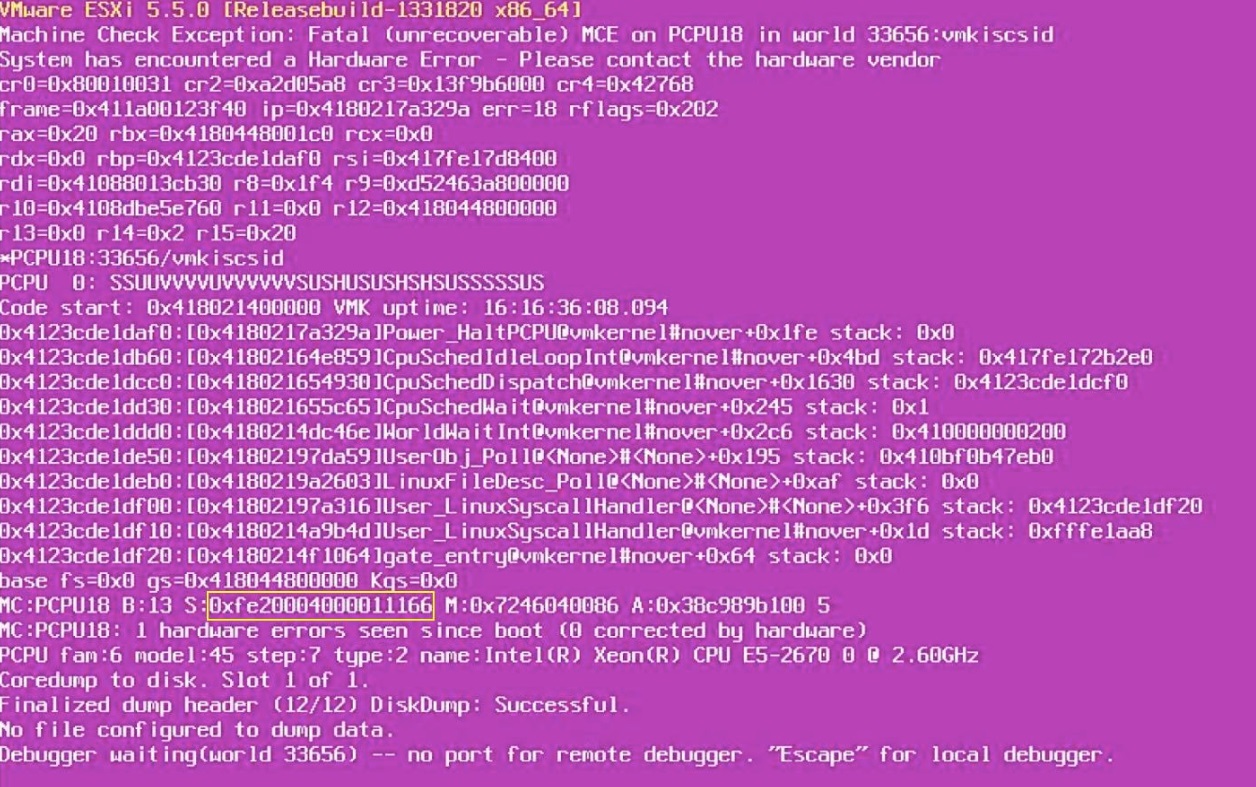
- Write down the
MCi_STATUSregister value. Here it is:
0xfe20004000011166.
- Convert it to binary:
1111 1110 0010 0000 0000 0000 0100 0000 0000 0000 0000 0001 0001 0001 0110 0110
- Take the lower 16 bits of the
MCi_STATUSregister:
0001 0001 0110 0110
Compare it with the compound errors. In this case, this appears to be a cache hierarchy error (type 4).
- Apply the values:
F = 1
RRRR = 0110 – Prefetch
TT = 01 – Transaction type - Data
LL = 10 – Level 2 cache
Conclusion:
- It looks like the purple diagnostic screen occurred while there was a prefetch operation on some data in the L2 cache of the processor.
- Thus, this could be an issue with the L2 cache on the processor.
- Therefore, the CPU should be replaced first and then check if the issue is resolved. In case the issue comes up again, the motherboard could be replaced.
Affected Products
VMware ESXi 6.7.X, VMware ESXi 7.x, VMware ESXi 8.xProducts
PowerFlex rack, ScaleIO, PowerEdge XR2, Poweredge C4140, PowerEdge C6420, PowerEdge C6520, PowerEdge C6525, PowerEdge C6615, PowerEdge C6620, PowerEdge FC640, PowerEdge M640, PowerEdge M640 (for PE VRTX), PowerEdge MX5016s, PowerEdge MX740C
, PowerEdge MX750c, PowerEdge MX760c, PowerEdge MX840C, PowerEdge R240, PowerEdge R250, PowerEdge R260, PowerEdge R340, PowerEdge R350, PowerEdge R360, PowerEdge R440, PowerEdge R450, PowerEdge R540, PowerEdge R550, PowerEdge R640, PowerEdge R6415, PowerEdge R650, PowerEdge R650xs, PowerEdge R6515, PowerEdge R6525, PowerEdge R660, PowerEdge R660xs, PowerEdge R6615, PowerEdge R6625, PowerEdge R740, PowerEdge R740XD, PowerEdge R740XD2, PowerEdge R7415, PowerEdge R7425, PowerEdge R750, PowerEdge R750XA, PowerEdge R750xs, PowerEdge R7515, PowerEdge R7525, PowerEdge R760, PowerEdge R760XA, PowerEdge R760xd2, PowerEdge R760xs, PowerEdge R7615, PowerEdge R7625, PowerEdge R840, PowerEdge R860, PowerEdge R940, PowerEdge R940xa, PowerEdge R960, PowerEdge T140, PowerEdge T150, PowerEdge T160, PowerEdge T340, PowerEdge T350, PowerEdge T360, PowerEdge T440, PowerEdge T550, PowerEdge T560, PowerEdge T640, PowerEdge XR11, PowerEdge XR12, PowerEdge XR4510c, PowerEdge XR4520c, PowerEdge XR8610t, PowerEdge XR8620t
...
Article Properties
Article Number: 000215212
Article Type: How To
Last Modified: 23 Jan 2026
Version: 7
Find answers to your questions from other Dell users
Support Services
Check if your device is covered by Support Services.