NetWorker: Troubleshooting High Memory or CPU usage by Process
Summary: This KB provides an overview of how to troubleshoot high memory or CPU usage by a process.
This article applies to
This article does not apply to
This article is not tied to any specific product.
Not all product versions are identified in this article.
Instructions
This KB provides an approach which can be used when NetWorker services or processes are observing high system resource (CPU or Memory) usage. Operating system commands such as top or Windows Task Manager may provide a point-in-time insight of the system usage; however, we can also capture system resource usage over a given window and compare that against other systems logs.
NetWorker logs and processes are detailed under:
This KB provides a method using operating system functions and logging.
WARNING: NetWorker support does not create custom scripting. The scripts provided in this KB can be used to and are minimal function. You can use these scripts as templates to create your own scripts based on environment-specific configurations or troubleshooting preferences.
Nonscripted approach: NetWorker: How To Determine Server Load Using nsrwatch
Before proceeding, there are several considerations which should be factored:
- All elements of the NetWorker datazone are supported.
- See the compatibility guides on the e-Lab navigator: https://elabnavigator.dell.com/eln/modernHomeAutomatedTiles?page=NetWorker
- See the NetWorker version-specific Performance and Optimization Guide, available on the Dell support site: https://www.dell.com/support/product-details/product/networker/overview
- In environments where remote NetWorker storage nodes are deployed. The NetWorker version of the storage node must match the NetWorker version of the NetWorker server.
- There is no disk space issue on the NetWorker server.
- Linux:
df -Th Windows: Check disk space usage from Windows File Explorer or Disk Management.
- Linux:
- For NetWorker servers: there are no DNS issues or unresolvable/orphaned resources. This can lead to
nsrdperformance issues.nsrdgets stuck attempting to resolve resources that it can not. - The resources available on the NetWorker server (CPU, RAM, and so on) are not exhausted during peak times.
- There are no significant errors in the operating system logs
- Linux:
/var/log/messages - Windows: Event Viewer (Application and System Event logs)
- Linux:
- The issue is with all standard NetWorker operations and is not more specific, for example: Backups to one Storage Node, only Cloning operations are affected, and so forth.
- Core dump generation has been enabled at the OS level on the NetWorker server, and there are no processes core dumping.
- NetWorker Performance and Optimization Planning:
NOTE: See the NetWorker version-specific Performance and Optimization Planning Guide for more details. This guide is available on the Dell support site https://www.dell.com/support/product-details/product/networker/docs.
-
- There are enough target volumes available for the NetWorker backups.
- The NetWorker server meets the minimum requirements for a datazone of this size. See: System Components.
- For a large datazone, the NMC server is on a separate machine from the NetWorker server. See: Memory requirements for the NetWorker server and NetWorker Management Console
- System kernel and networking optimizations are in-place, see: NetWorker: Best practices for networking configuration
- The port ranges have been set correctly as per the Security Configuration Guide, https://www.dell.com/support/product-details/product/networker/docs
Only once all of the above points have been ruled out, perform the following:
Microsoft Windows:
On Microsoft Windows systems, there are several graphical tools such as Task Manager and Performance Monitor which can be used to monitor resource usage by a specific process. This KB offers a batch script example to timestamp and display CPU and memory usage of a specified process at user-defined intervals.
First, determine what process must be monitored. This can vary depending on the issue. The NetWorker Processes and Ports should help narrow down the name of the processes and what they do.
You can identify the processes on the NetWorker server by using:
- Task Manager.
tasklistnsrrpcinfo -p localhost(Requires NetWorker server or NetWorker extended client package).
1. Create a .bat script containing the following:
@echo OFF
: x
wmic os get LocalDateTime /value >> performance_monitor.out
wmic path win32_perfformatteddata_perfproc_process where IDProcess="PID" get Name, PercentProcessorTime, PrivateBytes, IDProcess /format:list >> performance_monitor.out
timeout INTERVAL_IN_SECONDS
goto x
Where:PID = the Process ID of the process you want to monitor.INTERVAL_IN_SECONDS = the numerical value which represents how many seconds between each time the report runs.
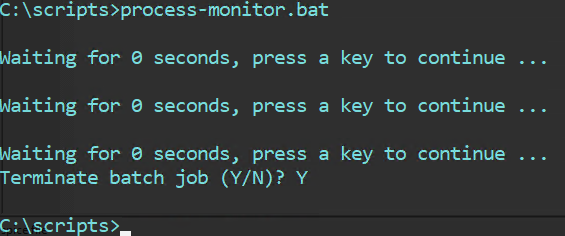
2. Save the script as process-monitor.bat in a location of your choosing.
3. Open an Administrator command prompt and cd to the directory where the script was saved.
4. Run the script.
This creates the process-monitor.out file in the directory from which the script was run. The file contains:
LocalDateTime=20240307112701.555000-300

IDProcess=6436
Name=nsrd
PercentProcessorTime=0
PrivateBytes=23605248


LocalDateTime=20240307112723.266000-300

IDProcess=6436
Name=nsrd
PercentProcessorTime=0
PrivateBytes=23605248


LocalDateTime=20240307112729.634000-300

IDProcess=6436
Name=nsrd
PercentProcessorTime=0
PrivateBytes=23605248


LocalDateTime=20240307112735.457000-300

IDProcess=6436
Name=nsrd
PercentProcessorTime=0
PrivateBytes=23670784
Where:
LocalDateTime = Is the date and time shown as YYYYMMDDHHMMSS.IDProcess = the Process ID (PID) which was entered in the script.Name = the name of the process the PID is associated with.PercentProcessorTime = Returns elapsed time that all the threads of this process used the processor to perform instructions in 100 nanoseconds.PrivateBytes = Current number of bytes this process has allocated in memory that cannot be shared with other processes.
5. To stop the script, use CTRL and C. You are prompted to stop or continue the script.
These values are not part of any NetWorker code and are detailed in the following Microsoft article: https://learn.microsoft.com/en-us/previous-versions/aa394323(v=vs.85)
Logs to be collected:
- Rendered daemon.raw
daemon.rawperformance_monitor.outfiles generated by this procedure.- System and Application event logs
Linux:
On Linux servers, you can use tools like top to monitor the system resource usage of processes. This KB offers a shell script example to timestamp and display CPU and memory usage of a specified process at user-defined intervals.
1. Log in to the NetWorker server over SSH.
2. Switch to root:
sudo su -
3. Get the PID of the NetWorker process that you want to monitor:
ps -ef | grep nsr
4. Create an .sh containing the following:
vi process_monitor.sh
#!/bin/bash
#Get System CPU and MEM details.
cat /proc/meminfo > /tmp/`hostname`_monitor-pid.out
cat /proc/cpuinfo >> /tmp/`hostname`_monitor-pid.out
#Monitor PID.
while true; do
        echo "Press [CTRL+C] to stop the loop."
        # Get timestamp.
        DATE=$(date +%Y/%m/%d-%H:%M:%S)
        # Check resource usage.
        echo -e "\\n$DATE" >> /tmp/`hostname`_monitor-pid.out ; ps -p PID -o %cpu,%mem,cmd >> /tmp/`hostname`_monitor-pid.out
        # Wait 5 seconds (change as per your discretion).
        sleep 5
done
Where:PID = the Process ID of the process you want to monitor.sleep 5 = Waits 5 seconds and runs again, you can change this interval as per your discretion.
5. Make the script executable:
chmod +x process_monitor.sh
6. Run the script:
./process_monitor.sh
nve:~ # ./process_monitor.sh
Press [CTRL+C] to stop the loop.
Press [CTRL+C] to stop the loop.
Press [CTRL+C] to stop the loop.
Press [CTRL+C] to stop the loop.
Press [CTRL+C] to stop the loop.
Press [CTRL+C] to stop the loop.
Press [CTRL+C] to stop the loop.
^C
nve:~ #
7. Leave the script running for the duration that you want to monitor or manually reproduce the issue where suspected resource over utilization occurs.
8. To stop the script, use CTRL and C. You are prompted to stop or continue the script.
NOTE: Commands can be run in the background using
nohup. For example: nohup ./process_monitor.sh &. The script runs in the background and is not stopped if the session closes. To stop the script, you must get the PID of the script `ps -ef | grep process_monitor` then stop it with using `kill -9 process_monitor_PID`
9. The script creates an output file under /tmp with the systems hostname:
nve:~ # ls -l /tmp | grep monitor-pid
-rw------- 1 root      root      2030 Jun  3 12:29 nve_monitor-pid.out
The contents of the file include a timestamp with the CPU and mem utilization of the process specified in the script.
nve:~ # tail -12 /tmp/nve_monitor-pid.out

2024/06/03-12:28:54
%CPU %MEM CMD
 0.0  0.3 /usr/sbin/nsrd

2024/06/03-12:29:02
%CPU %MEM CMD
 0.0  0.3 /usr/sbin/nsrd

2024/06/03-12:29:07
%CPU %MEM CMD
 0.0  0.3 /usr/sbin/nsrd
Logs to be collected:
- System platform and NetWorker version information: NetWorker: Methods for Identifying NetWorker Software version
- Rendered
daemon.raw daemon.rawhostname_monitor-pid.outfiles generated by this procedure.- OS messages file (
/var/log/messages) or exported System and Application event logs from windows Event Viewer.- Ensure to check the /var/log/messages file and ensure that the log covers the full
hostname_monitor-pid.outwindow. If there is a lot of activity on the server, the messages log can roll over. Other/var/log/messages-dateor/var/log/messages#exist if the messages log file has rolled over. Carefully review the timestamp from when these files were created. If they also cover thehostname_monitor-pid.outsession, grab these additional messages logs as well.
- Ensure to check the /var/log/messages file and ensure that the log covers the full
NetWorker (Linux): How to copy files to/from a Linux NetWorker server.
Additional Information
- NetWorker Processes and Ports
- NetWorker: How to Debug Backup Operations
- NetWorker: Log Files and Locations
- NetWorker Troubleshooting Guide: Process Crashes and Core Dumps
- NetWorker: How to Troubleshoot Service Response Issues in NetWorker using the nsrwatch utility
- NetWorker: How To Determine Server Load Using nsrwatch
Affected Products
NetWorkerProducts
NetWorker Family, NetWorker SeriesArticle Properties
Article Number: 000222888
Article Type: How To
Last Modified: 20 Feb 2026
Version: 7
Find answers to your questions from other Dell users
Support Services
Check if your device is covered by Support Services.