Connectrix: Web tools, Element Manager, Not Showing the Port's Health Status Under Dashboard for FOS Versions After 9.x
Summary: This issue is seen on Web tools, Element manager of switches having firmware after 9.x where port health data is not displayed although ports are online.
This article applies to
This article does not apply to
This article is not tied to any specific product.
Not all product versions are identified in this article.
Symptoms
Port health showing no data: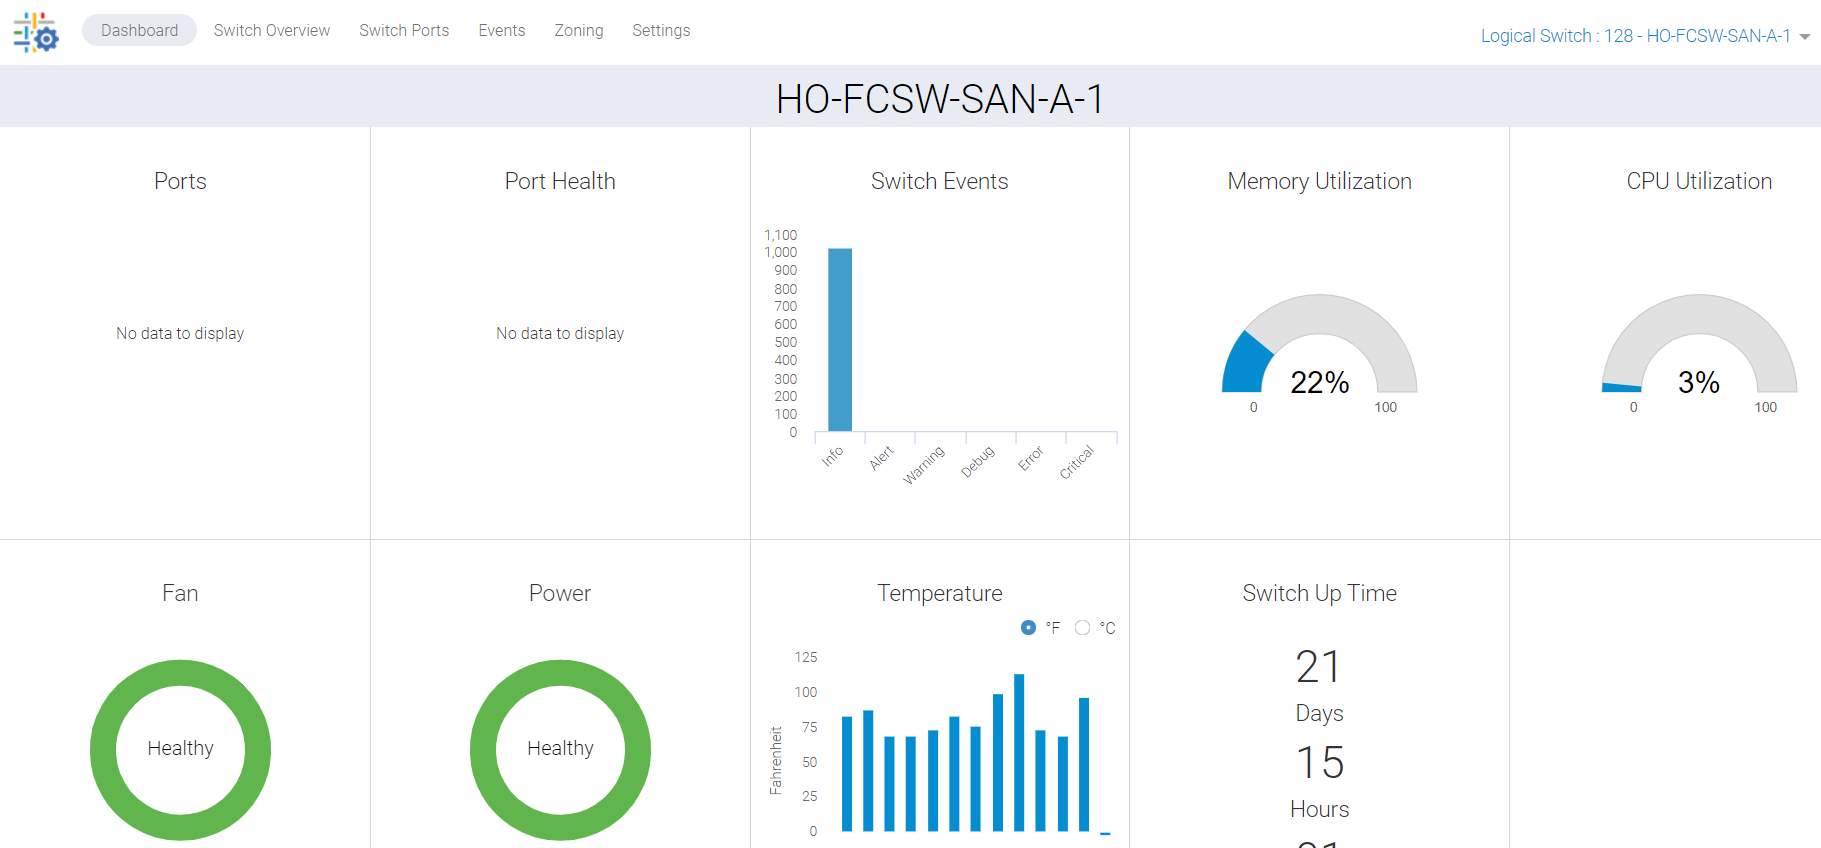
Figure 1: Screenshot of Port Health Showing No Data
Cause
This issue is due to the following reasons:
- Ports not showing green on switch Overview Tab, hence not listing the port health status under the dashboard
- Sync miss due to background stuck process
Resolution
We must refresh this data, and there are two action plans:
PLAN 1:
Root access is required to perform this activity on the switch. Restart the HTTP services for web tools.
SAN-SWITCH1:root> /fabos/libexec/webdconfigure
http attributes (yes, y, no, n): [no] y

HTTP Restart (yes, y, no, n): [no] y
HTTP enabled (yes, y, no, n): [yes] y
ErrorLog Enabled (yes, y, no, n): [no]
AccessLog Enabled (yes, y, no, n): [no]
SSLLog Enabled (yes, y, no, n): [no]
HTTP Port: (1..60000) [80]
Secure HTTP Port: (1..60000) [443]
HTTP IsAlive Check Enabled (yes, y, no, n): [yes]
HTTP Max HeapSize: (256..1024) [512]

webtools attributes (yes, y, no, n): [no]
cal attributes (yes, y, no, n): [no]
Or
PLAN 2:
Perform the following command:
Departmental model: #hareboot

Director class model: #hafailover
Affected Products
Connectrix B-Series Fabric OS 9.X, Connectrix B-Series SoftwareArticle Properties
Article Number: 000201036
Article Type: Solution
Last Modified: 17 Dec 2024
Version: 5
Find answers to your questions from other Dell users
Support Services
Check if your device is covered by Support Services.